


There is a long-standing sense of how presidential–congressional relations are expected to operate in American politics. Thurber (Reference Thurber and Thurber2022, 5) described it well: “The Framers of the Constitution bequeathed to Americans one of the most enduring rivalries in government, that between the president and Congress. Each is jealous of the other’s constitutional prerogatives.” Furthermore, “The greatest source of conflict between the president and Congress is their different constituencies” (Thurber Reference Thurber and Thurber2022, 8). Presidents are elected nationally and members of Congress are elected in states and districts. Their constituencies differ. “Rivalry is built into the election system” (Thurber Reference Thurber and Thurber2022, 8).
Yet, Thurber (Reference Thurber and Thurber2022, 11) also noted that in his first term, “Trump cut deeply into this independence.” Trump’s second term appears to have accelerated this situation. He issues executive orders rather than seek legislative authorization, moves funding that Congress authorized for specific purposes to other uses, refuses to spend money already authorized, and demands that Congress comply with his wishes. Congress is accused of having surrendered to President Trump, conceding its institutional powers to the presidency (Bendavid Reference Bendavid2025). Republicans have capitulated so thoroughly that they passed Trump’s unpopular “Big Beautiful Bill” (Glasser Reference Glasser2025). Essays opine that Republicans in Congress should “grow a spine.” They are abandoning their constitutional role as a separate and independent branch. The constitutional system is at risk.
The presumption is that this is occurring because Trump has an “iron grip on his party” (Jimison Reference Jimison2025). “Republicans have shown extraordinary deference to Mr. Trump” (Barnes and Edmondson Reference Barnes and Edmondson2025; Edmondson Reference Edmondson2025). Members of Congress fear opposing him because he has a devoted base and an insatiable drive for power (Edsall Reference Edsall2025). Trump is willing to use social media to get that base to turn on dissenters and destroy the careers of any doubting members. “When Trump sets a loyalty test today, Republicans fall in line” (Rutenberg Reference Rutenberg2025). A senator who will not vote for his legislation is engaging in “betrayal” (Parker Reference Parker2025). Senator Lisa Murkowski (R-AK) stated that “We are all afraid” (Ewing Reference Ewing2025). Republican senators who resigned rather than work with Trump likened his following to a cult:
…in today’s Republican Party, anything short of complete and unquestioning loyalty to President Trump—then in his first term—was deemed unacceptable and suspect. [Now] Any deviation from his dictates is treated as apostasy. It’s no longer about ideas or governing philosophies. It’s about personal allegiance to a single man, whose positions can shift by the day (Flake Reference Flake2025).
ALTERNATIVE EXPLANATIONS: POPULARITY AND POLARIZATION
The issue in this analysis is: What is creating congressional deference to Donald Trump? Does Trump have magical powers? Is his willingness to publicly punish dissenters through social media creating this situation? There is no doubt that Trump wants considerable power, will use social media to go after members of Congress who oppose him, and can influence public opinion about them. Is it personal power?
The issue in this analysis is: What is creating congressional deference to Donald Trump? Does Trump have magical powers? Is his willingness to publicly punish dissenters through social media creating this situation? There is no doubt that he wants considerable power, will use social media to go after members of Congress who oppose him, and can influence public opinion about members. Is it personal power?
Although the story of Donald Trump as an over-powering figure is appealing to his supporters, there are other explanations of why a Republican-controlled Congress might be inclined to defer to him. Three possible explanations are prominent. First, perhaps he is enormously popular and his party defers to that popularity. Second, perhaps the actions of Congress simply reflect the increase in polarization and nationalization of American politics. The Republican base is more cohesive and unified in their opposition to Democrats across the nation, and it supports Trump because he is their leader against liberals. Third, perhaps the alignments of presidential and congressional electoral bases create a similarity of policy goals. The first two explanations have limitations but are important to consider. The primary focus in this analysis is on the third explanation—that is, how a lengthy geographical realignment yielded a high congruence of Republican presidential and congressional electoral bases—a situation that has not existed since 1952.
The primary focus is how a lengthy geographical realignment yielded a high congruence of Republican presidential and congressional electoral bases—a situation that has not existed since 1952.
The first possible explanation is that Donald Trump is a popular president, and his party is deferring to him in recognition of his widespread electoral support. The difficulty with this explanation is that Trump’s approval rating, already not high when he was inaugurated in January 2025, has fallen significantly since then. The New York Times presidential approval tracker indicates that his approval/disapproval ratings in late January 2025 were 52%/43%. By early November 2025, his ratings had reversed: 42% approve/55% disapprove (Igielnik Reference Igielnik2025). If ratings matter, this decrease in approval ratings would incline congressional Republicans to be less supportive. As Jacobson (Reference Jacobson2019) documented, presidents have a major role in defining the image and favorability of their political party:
People’s affective reactions to the president, whatever their source, inevitably color their feelings about the other politicians in his coalition. Every president thus shapes public attitudes toward his party as well as beliefs about who and what it stands for and how well it governs when in office. Insofar as the party label represents a brand name, the president bears prime responsibility for the brand’s current image and status (Jacobson Reference Jacobson2015, 1).
Donald Trump cannot run again but most Republican members of Congress will. If Trump’s overall popularity is declining, strongly supporting him could cost many members their seats Trump remains popular with Republicans, which is very important to Republican candidates seeking to avoid strong primary opponents. However, Republicans are not a majority of the electorate and candidates must be concerned in general elections about the opinions of Independents and Democrats who are not positive about Trump. Many of his policies are unpopular (Public Religion Research Institute 2025a). If his policies result in worse economic conditions by mid-2026, some congressional careers may be at risk. Trump’s overall popularity is an unlikely explanation for why Congress is deferring to him.
The second possible explanation is that Trump is the beneficiary of the increasing polarization and nationalization of the electorate. Polarization refers to voters sorting themselves between the two major parties around issues such as abortion, with opponents moving to the Republican Party and supporters of abortion rights moving to the Democratic Party (Fiorina, Adams, and Pope Reference Fiorina, Adams and Pope2005; Levendusky Reference Levendusky2009). Polarization occurs when partisans bond with their party against the other party (Schmidt, Carmines, and Sniderman Reference Schmidt, Carmines and Sniderman2025). Policy differences morph into personal animosity to the opposing party (Iyengar and Krupenkin Reference Iyengar and Krupenkin2018; Kalmoe and Mason Reference Kalmoe and Mason2022; Mason Reference Mason2016), and partisans increasingly view the opposing party in negative terms (Abramowitz and Webster Reference Abramowitz and Webster2016; Mason Reference Mason2018; Webster Reference Webster2020). As this occurs, the nationalization of elections occurs. Nationalization means that the same issues are relevant across states and districts, partisanly aligning people in the same ways across states (Carson, Sievert, and Williamson Reference Carson, Sievert and Williamson2023; Hopkins Reference Hopkins2019). Regional issues matter less. Abortion opponents are equally partisan and supportive of Republicans across states. A president like Trump can mobilize this increased polarization and hostility to Democrats within the electorate (Costa Reference Costa2025). This greater solidarity within the party base leads congressional Republicans to vote for presidential priorities (Bond et al. Reference Bond, Fleisher, Cohen, Thurber and Yoshinaka2015; Cohen, Bond, and Fleisher Reference Cohen, Bond and Fleisher2013).
As valuable as this research is for understanding political change, it focuses only on national electorates and patterns. What is neglected is that differences in state electorates endure in America and members of Congress are elected in states and districts. The Republican Party needs majorities in enough states and districts to achieve control of Congress. The party does far better in some states (e.g., Wyoming) than others (e.g., Massachusetts). Over time, the Republican Party has pursued electorates more compatible with a conservative agenda. Most important for the issue of congressional deference is that through a lengthy realignment, the party has achieved an overlap of presidential and congressional electoral bases, which explains the current congressional support for Trump.
In referencing realignment, it is important to indicate what it does and does not mean. In many contemporary analyses, realignment refers to the movement of the white working class (generally defined as non-college white people) from the Democratic Party to the Republican Party (Gest Reference Gest2018; Greenberg Reference Greenberg1996; Judis and Teixeira Reference Judis and Teixeira2023; Kitschelt and Rehm Reference Kitschelt and Rehm2019; Lawrence Reference Lawrence1996; Leonhardt Reference Leonhardt2023). Trump often is portrayed as particularly effective in attracting these voters and creating a new alignment in American politics (Ruffini Reference Ruffini2023a, Reference Ruffini2023b). Much of this commentary is based on an inaccurate reading of historical voting patterns. A majority of the white working class has been voting Republican since at least 1952 (Stonecash Reference Stonecash2024b, Reference Stonecash2026b). Previous Republican presidential candidates including Dwight D. Eisenhower, Richard M. Nixon, and Ronald W. Reagan drew levels of white working-class support similar to what Trump receives.
THE REPUBLICAN REALIGNMENT
This section focuses on the lengthy geographical realignment of presidential and congressional electoral bases that has occurred since the 1940s (Abramowitz Reference Abramowitz2018; Bullock, Hoffman, and Gaddie Reference Bullock, Hoffman and Gaddie2006; Hopkins Reference Hopkins2009, Reference Hopkins2017; Stonecash Reference Stonecash2006, 2024a). Donald Trump is the beneficiary of the culmination of this realignment. He currently has something that has not occurred since 1952: a Republican presidency with a clear geographical partisan alignment between his base and congressional Republicans. He has few congressional party members elected in states or districts won by the 2024 Democratic presidential candidate (i.e., Kamala Harris). Congressional Republicans avidly support him because they have the same constituencies.
This realignment proceeded faster for presidential than congressional races. The Republican Party was struggling to win presidential elections after five straight Democratic wins from 1932 to 1948. Republicans won the House in 1946 and 1952 but quickly lost that majority. The party needed a bigger base. There also were those seeking not only a majority but also a more conservative majority. The wins by Eisenhower in Southern states suggested possibilities for the future. The Barry M. Goldwater, George C. Wallace, and Richard M. Nixon presidential elections indicated that the Republican Party could win in Southern states and Western interior states with a more socially conservative message. The party changed many positions, moving away from supporting civil rights and toward embracing gun owners and conservative Christians (Karol Reference Karol2010; Mellow Reference Mellow2008; Stonecash Reference Stonecash2024a).
Realignment has been top down, with partisan voting for governorships and state legislative seats shifting after voting for national offices (Black and Black Reference Black and Black1987; Maxwell and Shields Reference Maxwell and Shields2019; McKee Reference McKee2010). As Republicans gained electoral majorities in states where they previously had not dominated, they sought to tilt the political process in ways that were favorable to them. They have redistricted in ways that benefit Republican candidates (Brennan Center 2025a; Eguia Reference Eguia2025) and imposed voting rules that create more hurdles—repeated registrations, longer lines, and voter-ID requirements—that they hope will discourage minorities from voting (Brennan Center 2025b). These actions enabled Republicans to amplify their partisan advantage in states where they were gaining support. Together, they increased the success of Republican candidates and gave Trump his supportive base.
The difference of the Republican Party’s current base compared to the past is remarkable. In the 1940s, when Republican presidential candidates won states, they consistently did reasonably well in 11 states largely in the NortheastFootnote 1 and split outcomes in 18 others (table 1). They did poorly in 19 states (Stonecash Reference Stonecash2024a, 1–13). Those states eventually moved Democratic (R to D) as the Republican Party moved to more conservative positions (Reiter and Stonecash Reference Reiter and Stonecash2011). They also did fairly well in the other 18 states.Footnote 2 Together, these two sets of states provided almost all Republican Electoral College votes in the 1940s. There were 19 states—Southern and Western interior—where the Republican Party received little support.Footnote 3
The Shifting Republican Presidential Base: Success by State Groupings, 1940–1948 and 2016–2024

Table 1 Long description
The table compares Republican performance across three state categories: R to D (Republican to Democratic shift), Stable, and D to R (Democratic to Republican shift).
For the 1940 to 1948 period:
- Number of States: R to D (11), Stable (18), D to R (19).
- Republican Average Percentage of Vote: R to D (48.8), Stable (48.3), D to R (30.7).
- Percentage of States Won by Republicans: R to D (39.4), Stable (44.4), D to R (1.8).
- Percentage of Republican Electoral College Votes: R to D (32.0), Stable (65.0), D to R (2.9).
For the 2016 to 2024 period:
- Number of States: R to D (12), Stable (20), D to R (19).
- Republican Average Percentage of Vote: R to D (35.8), Stable (49.3), D to R (58.7).
- Percentage of States Won by Republicans: R to D (0), Stable (51.7), D to R (96.5).
- Percentage of Republican Electoral College Votes: R to D (0), Stable (30.6), D to R (69.4).
The political leanings of two of the state groupings have shifted significantly. The 19 states where the Republican Party did not do well have moved from Democratic to Republican (D to R). For 2016–2024 (i.e., the three Trump elections), the party now wins 96.5% of the 19 states and derives 69.4% of its electoral votes from them. Republican presidential candidates did not win any of the 11 states across the three elections. Trump often is characterized as unconcerned about and even hostile to blue states. It is because they are not part of his base.
Congressional support for Republican presidents depends on two crucial conditions: (1) having a congressional base aligned with the president; and (2) winning a majority in both the House and the Senate. For decades, these two conditions did not come together. As realignment unfolded, Republican presidential candidates pursued votes in areas that previously had been solidly Democratic. The pursuit of success in the South is the most prominent area where partisanship was first reversed in presidential elections. To pull voters away from the Democratic Party, Republicans focused on anxiety about and resistance to racial inclusion, concerns about conservative Christian norms being displaced, and other cultural issues (Abramowitz Reference Abramowitz2018; Kruse Reference Kruse, Kruse and Zelizer2022; Maxwell Reference Maxwell2021; Maxwell and Shields Reference Maxwell and Shields2019). Presidential candidates made inroads well before Republican congressional candidates, which produced the rise in split outcomes (Stonecash Reference Stonecash2013). A Republican president would win a House district or state but the winner of the House or Senate seat would be a Democrat. Republican presidents generally faced a Republican congressional party that was either in the minority or, if in the majority, had several members who won in districts or states won by a Democratic presidential candidate.
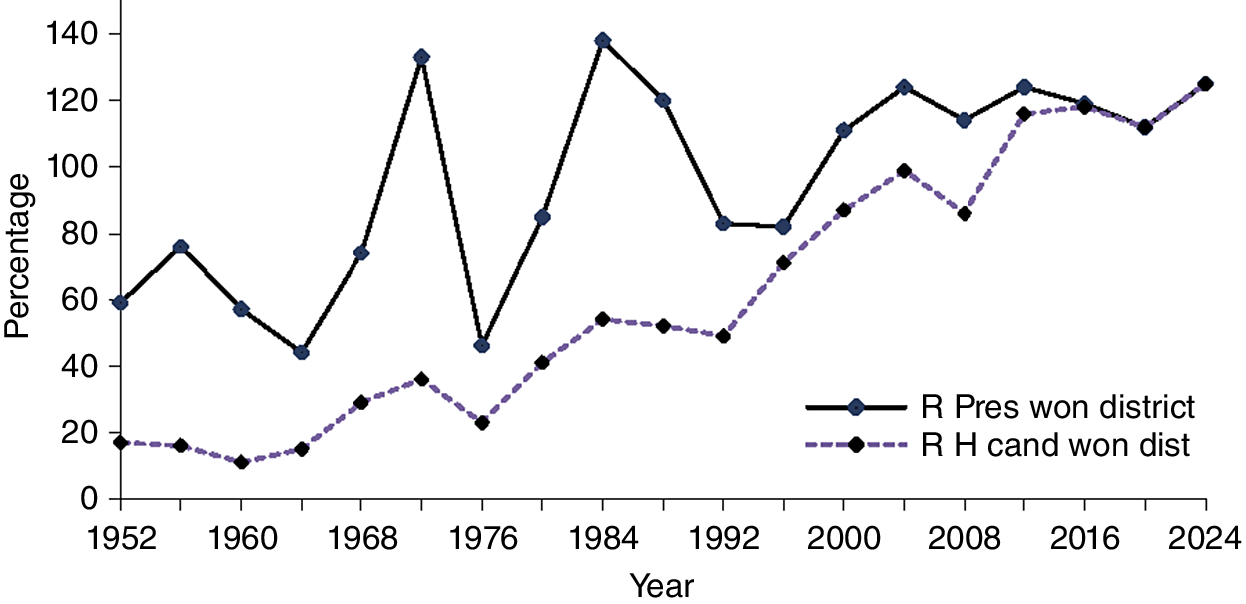
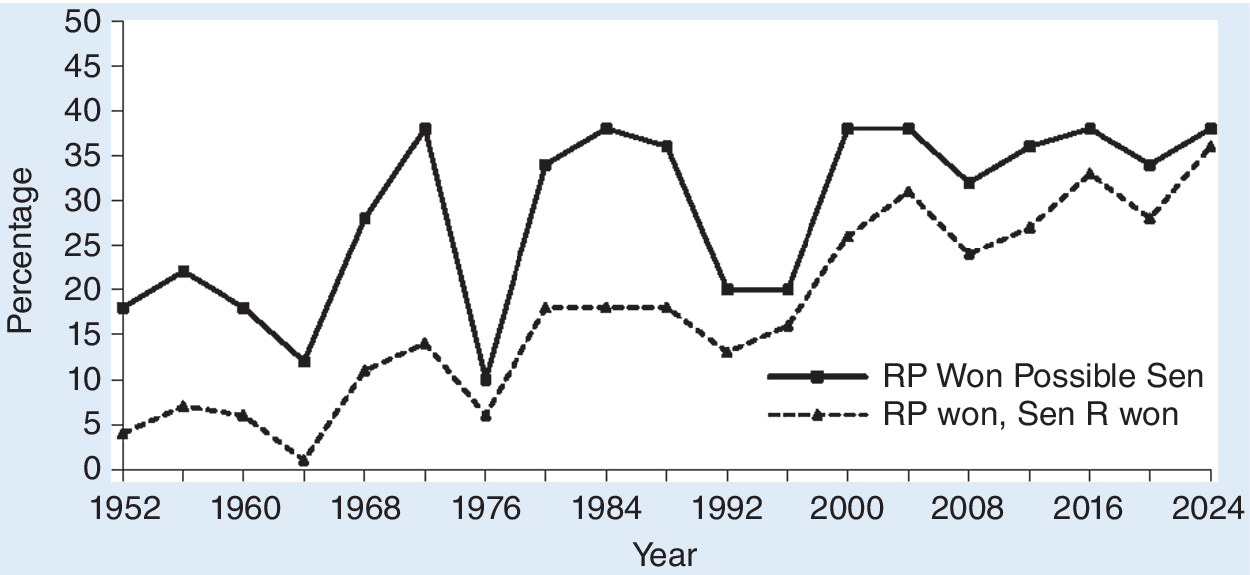
The first issue, a Republican president winning in a district or state but not having an accompanying Republican congressional member, is shown in figures 1 and 2 (Stonecash Reference Stonecash2026a). The analysis begins with 1952 because that was the first year a Republican won the presidency post–World War II. It also was the year that a Republican presidential candidate began to make inroads into the 19 states. The initial focus is on changes in the 19 states because those are where gains for the Republican Party have occurred and where achieving the overlap of presidential and congressional results has taken so long and become so important. In the 1950s through the 2010s, the success of Republican presidential candidates in House districts was well ahead of House candidates. The two came together only in 1964, 1976, and 1992–1996, when Republican presidential candidates did not fare well and their success shrank to that of the House base. When the Republican Party won the presidency in 1952–1956, 1968–1972, and 1980–1988, there was a substantial gap between the success of presidential and House candidates in the 19 states.
House Districts Won by Republican Presidential Candidates and Success Rate of Republican House Candidates in Those Districts, 19 States, 1952–2024

Figure 1 Long description
The X-axis represents Year in 4-year increments from 1952 to 2024. The Y-axis represents Percentage from 0 to 140.
Two data series are plotted with diamond markers:
1. R Pres won district (solid black line): This series shows high volatility. It starts at approximately 60 in 1952, peaks at 135 in 1972, drops sharply to 45 in 1976, and reaches its highest peak of nearly 140 in 1984. After 1984, it fluctuates between 80 and 125, ending at 125 in 2024.
2. R H cand won dist (dashed purple line): This series shows a steady long-term upward trend. It begins below 20 in 1952 and remains relatively low (under 40) until 1980. From 1980, it climbs steadily, surpassing 80 by 2000 and reaching its peak of approximately 125 in 2024, where it converges with the presidential win line.
The gap between the two lines is widest between 1952 and 1992, with the presidential win rate consistently higher. From 2000 onward, the two lines track much more closely together.
States Won by Republican Presidential Candidates and Actual Republican Senate Seats Won in States Won by Republican Presidential Candidate, 19 States, 1952–2024

Figure 2 Long description
The X-axis represents the Year in four-year increments from 1952 to 2024. The Y-axis represents Percentage from 0 to 50 in increments of 5. Two lines are plotted.
1. R P Won Possible Sen (solid line with square markers): This line represents the percentage of states won by the Republican presidential candidate. It starts at 18 percent in 1952, peaks at 38 percent in 1972, 1984, 2000, 2004, 2016, and 2024, with significant troughs in 1964 (12 percent) and 1976 (10 percent).
2. R P won, Sen R won (dashed line with triangle markers): This line represents the percentage of actual Republican Senate seats won in those same states. It consistently tracks below the solid line but follows a similar trajectory. It starts at 4 percent in 1952, reaches a low of 1 percent in 1964, and shows a general upward trend in the latter half of the graph, peaking at 36 percent in 2024.
The gap between the two lines is widest in the mid-20th century and narrows significantly toward 2024, indicating an increasing alignment between presidential and senatorial election outcomes in Republican-won states.
Senate results in the 19 states followed the same pattern (see figure 2). Republican presidential candidates won many of the 19 states but Republican Senate candidates in states won by their presidential candidate did not fare as well. These results are presented differently from those of the House. Each state has a possible two Senate seats that could be Republican. To indicate the possible Republican Senate seats that the presidential candidate could have in office (not only states won), each presidential state win is multiplied by two. Because only one third of Senate races occur in an election year, it is necessary to include Republican senators who were elected earlier. If a candidate won 10 states, there could be 20 Republican senators. Figure 2 shows the possible Republican Senate seats that the Republican presidential candidate’s winning states could have and how many Republican senators were in office after the election. The gap was substantial from the 1950s through the 2000s.
The second condition is that for many decades and for both chambers, when a Republican won the presidency, he had to contend with either not having a majority in both chambers or having a majority but with some members from districts or states that he lost. Dwight D. Eisenhower had a relatively good situation. In 1952, he had 221 Republican House members, four of whom were in split districts. In the Senate, there were 48 Republicans and two more elected in states that a Democratic presidential candidate won. The more frequent scenario was winning the presidency but not having a Republican majority in both chambers. Ronald W. Reagan and George H. W. Bush faced that situation. When a Republican won the presidency and had a majority of partisans in both chambers, many congressional members in the majority won in states or jurisdictions that were won by a Democratic presidential candidate. In 2000 and 2004, George W. Bush had majorities in both chambers but a significant number of members from jurisdictions that the Democratic presidential candidate won.
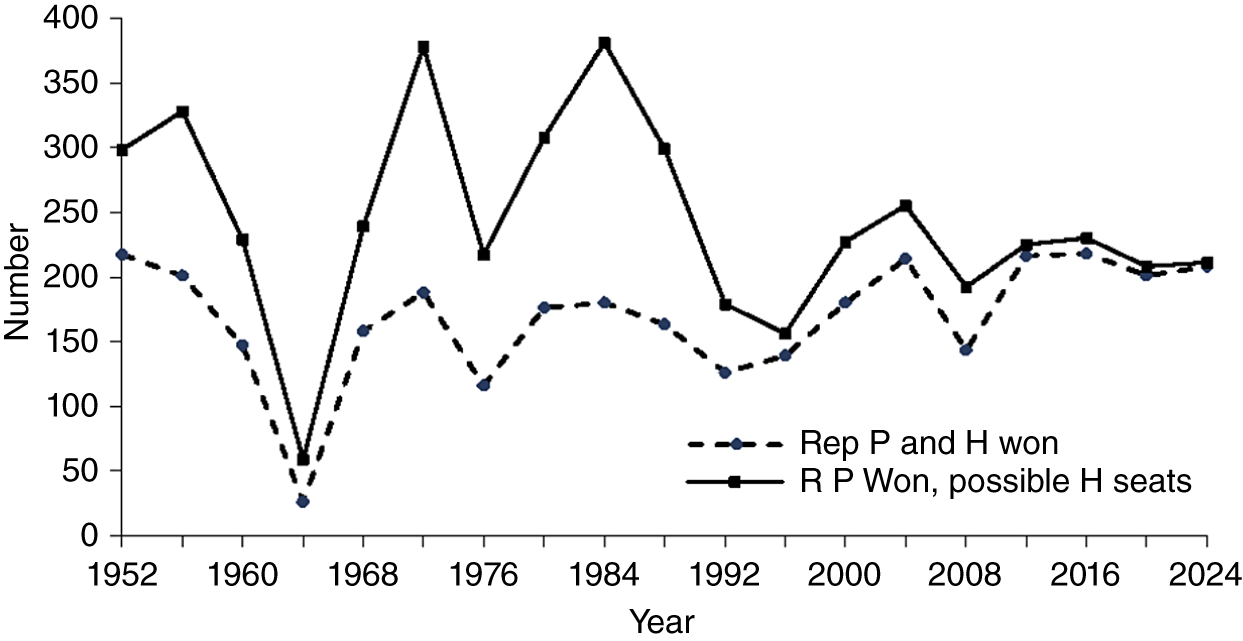
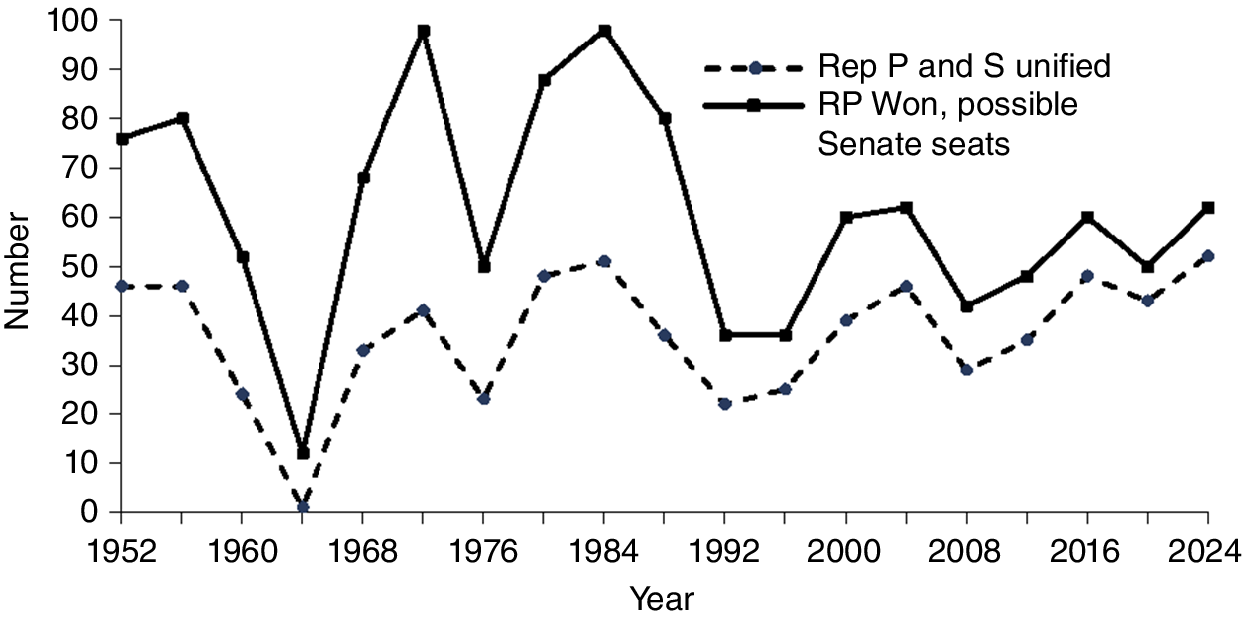
This geographical mismatch of bases for Republican presidential candidates occurred at the national level for several decades. Figures 3 and 4 track these situations. In figure 3, the solid black line tracks the House districts that a Republican presidential candidate won. The dashed line tracks the actual Republican congressional winners in districts that were won by the Republican presidential candidate. The gap indicates the seats that a Republican presidential winner could not bring with him—and it was considerable until the 1990s. Figure 4 indicates the same pattern for presidential and Senate results in states. The gap was substantial until the 1990s. Republican presidents would win high numbers of states and districts but not have a majority of members from districts or states that the president won.
House Districts Won by Republican Presidential Candidates and Republican House Results in Those Districts, 1952–2024

Figure 3 Long description
A line graph with the X axis labeled Year, ranging from 1952 to 2024 in 8 year increments, and the Y axis labeled Number, ranging from 0 to 400.
There are two data series:
1. A solid black line with square markers labeled R P Won, possible H seats. This line represents the total number of districts won by the Republican presidential candidate. It shows high volatility with major peaks near 380 in 1972 and 1984, and deep troughs in 1964 (near 60) and 1992-1996 (near 160-180).
2. A dashed blue line with diamond markers labeled Rep P and H won. This line represents districts where both the Republican presidential candidate and the Republican House candidate won. It follows a similar pattern to the solid line but at a lower volume, starting near 220 in 1952.
The spatial relationship between the lines is critical. From 1952 through the 1980s, there is a wide vertical gap between the two lines, indicating many districts voted for a Republican president but a Democratic House member. Starting in the 1990s, the gap narrows significantly. By 2012 through 2024, the two lines nearly converge, fluctuating together between the 200 and 230 mark, indicating a high correlation between presidential and House voting patterns in modern elections.
Republican Presidential State Wins, Possible and Actual Republican Senate Wins in Those States, 1952–2024

Figure 4 Long description
The X axis represents Year from 1952 to 2024 in 8 year increments. The Y axis is labeled Number and ranges from 0 to 100. Two data series are plotted.
* The solid line with square markers represents R P Won, possible Senate seats. It shows high peaks near 80 in 1956, nearly 100 in 1972 and 1984, and a significant trough near 12 in 1964. Post 1992, it fluctuates between 40 and 60.
* The dashed line with circular markers represents Rep P and S unified. This line consistently tracks below the solid line, following the same peaks and troughs. It reaches its lowest point at 0 in 1964 and its highest point at approximately 52 in 1984 and 2024.
Both lines show a sharp decline in 1964 and 1976, with a general stabilization in the latter half of the timeline.
THE CONDITIONS FACING REPUBLICAN PRESIDENTS
Table 2 summarizes the situation of Republican presidents since 1952. Dwight D. Eisenhower won two terms and, at the beginning of each term, had high geographical overlap with his congressional party. Only in 1952 did he have a majority in both chambers. It was not until 2000 and 2004 that a Republican president had majorities in both chambers. However, even then, George W. Bush had a congressional party with many members in both chambers elected in districts won by the Democratic presidential candidate. Trump had majorities in both chambers at the beginning of each of his terms. He also has more members who share the same electoral base than anyone except George W. Bush in 2004. However, Bush’s support eroded as the Iraq War continued.
Republican Presidencies and Congressional Seats Overlap

Table 2 Long description
The table consists of nine columns organized by Year, House Republican Seats in Districts, and Senate Republican Seats in States.
* 1952: House Total 221, Majority Yes, Republican Party Won 217, Democratic Party Won 4. Senate Total 48, Majority Yes, Republican Party Won 46, Democratic Party Won 2.
* 1956: House Total 202, Majority No, Republican Party Won 201, Democratic Party Won 1. Senate Total 47, Majority No, Republican Party Won 46, Democratic Party Won 1.
* 1968: House Total 192, Majority No, Republican Party Won 158, Democratic Party Won 34. Senate Total 43, Majority No, Republican Party Won 33, Democratic Party Won 10.
* 1972: House Total 191, Majority No, Republican Party Won 188, Democratic Party Won 3. Senate Total 42, Majority No, Republican Party Won 41, Democratic Party Won 1.
* 1980: House Total 194, Majority No, Republican Party Won 176, Democratic Party Won 18. Senate Total 53, Majority Yes, Republican Party Won 48, Democratic Party Won 5.
* 1984: House Total 181, Majority No, Republican Party Won 180, Democratic Party Won 1. Senate Total 53, Majority Yes, Republican Party Won 51, Democratic Party Won 2.
* 1988: House Total 175, Majority No, Republican Party Won 163, Democratic Party Won 12. Senate Total 45, Majority No, Republican Party Won 36, Democratic Party Won 9.
* 2000: House Total 221, Majority Yes, Republican Party Won 180, Democratic Party Won 41. Senate Total 50, Majority Yes, Republican Party Won 39, Democratic Party Won 11.
* 2004: House Total 232, Majority Yes, Republican Party Won 214, Democratic Party Won 18. Senate Total 55, Majority Yes, Republican Party Won 46, Democratic Party Won 9.
* 2016: House Total 241, Majority Yes, Republican Party Won 218, Democratic Party Won 23. Senate Total 51, Majority Yes, Republican Party Won 48, Democratic Party Won 3.
* 2024: House Total 220, Majority Yes, Republican Party Won 208, Democratic Party Won 12. Senate Total 53, Majority Yes, Republican Party Won 52, Democratic Party Won 1.
The past two decades are different in another way. After considerable volatility where Republican presidential candidates won—as realignment unfolded—their success in the 19 states has become their stable base along with some swing states (Stonecash Reference Stonecash2024a, 266). Split outcomes (i.e., the partisan winners of presidential and congressional elections differ) have declined steadily in recent years (DeSilver Reference DeSilver2021, Reference DeSilver2024; Stonecash Reference Stonecash2013). The correlation between presidential and House results increased from 0.55 in 1980, 0.63 in 1992, 0.74 in 2000, and 0.91 in 2020 and 2024. The congressional party is strongly tied to presidential results. The situation for Trump is particularly favorable for him to have strong congressional support. In 2016–2024, when he won House districts or states, the congressional winner was very likely to be a Republican.
Congressional support is further encouraged in that voters in the states that serve as Trump’s base still feel positive toward him. The states that he won in 2024 have relatively high percentages of self-identified conservatives (Jones Reference Jones2019) and those who are supportive of Christian nationalism (Public Religion Research Institute 2025b), and they are likely to continue to provide strong support. In mid-October 2025, Trump’s overall job approval was negative nationally; however, a Morning Consult poll indicated that in the 19 states that he won in 2024, his job approval was a net 12% positive (Yokley and Easley Reference Yokley and Easley2025). In the other 12 states that Trump won, his job approval was a net 4.6% positive. Republican members of Congress know that he is not popular nationally; but, in their electoral jurisdictions, he is viewed positively—and particularly with Republicans. Supporting Trump makes political sense and makes them willing to accommodate him.
Not only has the Republican Party changed its base but the Democratic Party also has changed its base, which in turn prompts greater opposition to Republicans. A political party that in the 1950s had a substantial number of congressional members from the South has now transitioned to relatively liberal states. This prompts greater cohesiveness of Republicans in Congress. In the states that Trump lost, his net job (approval - disapproval) ratings are very negative, averaging between -18 and -30 depending on the poll. In the states that Trump lost, only 30% were self-identified conservatives, whereas in the states that he won, the average was 40% (Jones Reference Jones2019).
The situation for the second Trump administration is summarized as follows:
In the House of Representatives:
-
• In the years 1952–2012, when a Republican presidential candidate won a district, Republican House candidates won 63.6% of those districts. For Trump’s three elections, the percentage is 96.7%.
-
• In 2016 and 2024, Republicans had a majority in the House. In 2016, Trump had a higher number of Republicans from districts he won than any other president since 1952. His 2024 total is slightly lower but still relatively high.
-
• Trump has a majority in the House combined with few Republican House members from districts that a Democratic presidential candidate won. Only Dwight D. Eisenhower shared this situation.
In the Senate:
-
• In his second term, Trump has a majority (52) in the Senate that is from states that he won.
-
• Dwight D. Eisenhower came close: Republicans had 46 in 1952 and 1956.
-
• Ronald W. Reagan was the only other Republican president to have this situation in the Senate in 1984, but he did not have a majority in the House.
-
• George W. Bush had to contend with no majority from states that he won as well as 11 (2000) and nine (2004) senators from states that were won by Democratic presidential candidates.
-
• Previous Republican presidents who won states had Republican Senate candidates win an average of 55.5% within those states. During Trump’s three elections, the average is 83.3%.
-
• Trump also has few Republican senators in districts that a Democratic presidential candidate won (i.e., three in 2016 and one in 2024).
CONCLUSION
Many factors shape the divisions between Democrats and Republicans in Congress. This study shifts the focus from a national perspective to where Republican officials win elections, the overlap of their constituencies, and the gradual process that produced an increased overlap. It has taken a long time, but the Republican Party now enjoys considerable unity of electoral bases and purpose. Donald Trump clearly pressures members to accept his agenda, but his advantage is that he starts with a congressional party that shares his electoral base more than any other Republican presidents have experienced. Poll after poll show that his support among Republicans is strong. Commentators note that “House and Senate leaders have willingly ceded their prerogatives and cheered on the president” (Hulse Reference Hulse2025). It is not capitulation but rather having overlapping electoral bases and agreement with his objectives. It is not a surrender of Congress’s role for members who share his electoral base to agree with him. They may have doubts about his style and comments, but they share an electoral base and view his wins as an opportunity to pursue conservative goals. As Speaker of the House Mike Johnson stated in March 2025: “This is the Super Bowl. This is the moment we’ve all been waiting for our entire careers and, finally, the stars have aligned so we can do that better” (Hulse and Edmondson Reference Hulse and Edmondson2025). Trump is doing things that many members want. Members of Congress come from districts or states that have consistently voted Republican in recent years. The presidential and congressional wings of the Republican Party are tied together. It is not surprising that Trump’s congressional party provides strong support.
This study shifts the focus from a national perspective to where Republican officials win elections, the overlap of their constituencies, and the gradual process that produced this overlap.
DATA AVAILABILITY STATEMENT
Research documentation and data that support the findings of this study are openly available at the PS: Political Science & Politics Harvard Dataverse at https://doi.org/10.7910/DVN/LRQQNL.
CONFLICTS OF INTEREST
The author declares that there are no ethical issues or conflicts of interest in this research.



 Open access

