


INTRODUCTION
The study of parasites depends on their detection, identification and quantification. Microsporidia are a prominent example: although they are intracellular parasites, they are typically detected using light microscopy by the presence of extracellular spores, the transmission stage. An infection of low intensity is easily missed because spores represent only a fraction of an ongoing infection and other life stages remain invisible. Additionally, spore morphology offers few distinct characters and so analysis of samples by light microscopy is not sufficient for identification of microsporidian parasites or discrimination between parasite species. Species identification is done on ultrastructural morphology by transmission electron microscopy, an approach that is not feasible for routine analysis.
PCR-based methods overcome these drawbacks because they detect parasite DNA of all life-cycle stages and allow discrimination of parasites via specific primers. Quantitative data on infections can be obtained via quantitative PCR (qPCR). Here, the amount of amplified DNA is measured at every cycle by fluorescent techniques and data on reaction kinetics can then be used to infer initial copy number of the DNA template in question (Higuchi et al. 1993). Despite its general use in molecular biology, including quantification of human pathogenic microsporidia (e.g. Hester et al. 2002; Menotti et al. 2003a,b; Wasson and Barry, 2003), qPCR is not often applied in studies on the ecology and evolution of host-parasite interactions (Cheesman et al. 2003; Mouton et al. 2004; Mucklow et al. 2004). Here, empirical research lags behind theory: one reason for this is that the techniques to analyse experiments on host-parasite interactions are limited. There is dire need for novel methods that allow measurement of parasite growth, analysis of multiple infections or detection of infections in different stages of the hosts' life-cycle.
Here, we report the development of a qPCR protocol to detect, discriminate and quantify infections of the microsporidian parasites Glugoides intestinalis, Octosporea bayeri and Ordospora colligata, in their host, the freshwater crustacean Daphnia magna. Our goal was to produce a simple protocol that is (a) easily applied to the study of other microparasitic infections and (b) easily adopted in laboratories with little previous experience with qPCR.
Quantitative PCR allows very precise measurements of parasite DNA but depends strongly on sample quality. At times, the volume of a sample may be difficult to control and additional variation is introduced during DNA extraction. The total amount of DNA in a sample is primarily affected, while relative amounts of parasite to host DNA are less affected. In these cases, we propose the use of the ratio of parasite to host DNA as a measure of infection intensity. This approach is similar to the relative quantification methods used in reverse transcriptase real-time quantitative PCR (RT qPCR, Pfaffl, 2004). By correcting for variation in the total DNA content of samples, the resolution of qPCR is greatly improved. We demonstrate the applicability of this correction method and comment on its usefulness as well as its limitations.
MATERIALS AND METHODS
The host-parasite system
Daphnia magna Straus (Crustacea: Cladocera) is a zooplankter of ponds and lakes and is host to many parasite species (Green, 1974; Stirnadel and Ebert, 1997; Decaestecker et al. 2005). It reproduces by cyclical parthenogenesis and therefore the same genotype can be used repeatedly in different experiments. Body size of an adult animal ranges from 1·5 to 5 mm.
Glugoides intestinalis and Ordospora colligata are microsporidian parasites of D. magna (Larsson et al. 1996, 1997). These unicellular parasites transmit horizontally via infectious spores and infect epithelial cells in the upper half of the gut of their host. Once inside the cells, they undergo merogony and after ~3 days new spores are produced and released with the faeces. Due to autoinfection, the number of parasites in a host increases monotonically and infections are chronic. A single host usually harbours up to a few thousand parasites. Octosporea bayeri is also a microsporidian parasite of D. magna that infects fat body and ovaries and transmits both horizontally and vertically (Jírovec, 1936). Hosts may harbour several million parasites. It is the most common parasite in a metapopulation of D. magna in the Tvärminne archipelago in southern Finland (Ebert, 2001). All three parasites have been used repeatedly in studies that investigate the ecology, epidemiology and evolution of host-parasite systems (e.g. Ebert, 1994; Ebert et al. 2000; Capaul and Ebert, 2003; Lass and Ebert, 2005).
There are no DNA sequences published for Oc. bayeri, yet its SSUrRNA, ITS and 5′ end of the LSU are identical to Flabelliforma magnivora (GenBank Accession no. AY649786), another parasite of D. magna (Larsson et al. 1998). Currently the taxonomic relationship between these parasites is not resolved as there are no ultrastructural data available on Oc. bayeri. Octosporea bayeri is heterosporous and transmits both horizontally and vertically (Vizoso and Ebert, 2004; Vizoso et al. 2005). Flabelliforma magnivora has only one spore type and horizontal transmission has never been observed (Mangin et al. 1995, where this parasite is named Tuzetia sp.).
Detailed information on all parasites used in this study is available in the online publication by Ebert (2005).
Purification of spores and DNA extraction
Although qPCR can be applied to quantify all life stages of a parasite, initial tests were done on DNA extractions from spore suspensions. This allowed us to relate qPCR readings to the number of parasites in a sample and thus gauge the method.
For G. intestinalis and Or. colligata, several hundred infected adult Daphnia were homogenized in a 10 ml homogenizer, filtered through a 25 μm mesh into a 50 ml tube and centrifuged for 15 min at 5000 g. For Oc. bayeri, 10–50 animals were homogenized with a minipestle in a 1·5 ml tube, filtered through a 25 μm mesh into a 1·5 ml tube and centrifuged for 15 min at 104g. Pellets from all parasites were re-suspended in 100 μl of water, carefully overlaid on 1 ml of 25% Ludox HS-40 (Sigma, Buchs, Switzerland) in a 1·5 ml tube and centrifuged for 10 min at 104g. The spore pellet was re-suspended in 50 μl of water and concentration of spores was assessed with a bacterial counting chamber (Thoma ruling) using phase-contrast microscopy with 400× magnification.
DNA from whole animals or from spore suspensions can conveniently be extracted with a commercial kit (E.Z.N.A. Tissue DNA Kit, Peqlab, Erlangen, Germany). Other extraction methods were also tested (DNeasy Tissue Kit (Qiagen, Hilden, Germany), phenol/chloroform/isoamyl alcohol extraction) but yielded less DNA. Whole animals were homogenized in a 1·5 ml tube with a minipestle prior to extraction. Tissue lysis buffer was not added directly to the homogenate but was used to flush remaining tissue from the minipestle into the tube. OB™-Protease (supplied with the kit) digestion lasted for 2–3 h. Spore suspensions were checked under 400× phase-contrast microcopy after protease digestion. Remaining spores of G. intestinalis and Or. colligata lost their refringency, indicating that they germinated. About 30% of all spores of Oc. bayeri were digested. The final elution volume of the DNA extraction was 200 μl. The protocol requires the use of warmed elution buffer (70 °C) which affects the volume in air displacement pipettes. Therefore, a Multipette® positive displacement pipette (Eppendorf, Hamburg, Germany) was used. Extracted DNA was stored at −20 °C.
Real-time quantitative PCR
Primers were designed with the Primer3 web interface (Rozen and Skaletsky, 2000). Annealing temperature was set to 60 °C to allow for simultaneous realization of different amplification reactions in the same run. Primer sequences were selected to be species-specific based on an alignment of rDNA sequences of the Microsporidia (Canning et al. 2002) and care was taken to place binding sites in highly variable regions. Specificity was tested against different microsporidian parasites of D. magna: Berwaldia schaefernai, Flabelliforma magnivora, Glugoides intestinalis, Gurleya vavrai, Larssonia obtusa, Octosporea bayeri, Ordospora colligata and Microsporidium 1 and 2 (sensu Decaestecker et al. 2005). In addition we tested primers against parasites which may occur in the habitat of Daphnia: Pasteuria ramosa (a common bacterial parasite of D. magna), Bryonosema plumatellae, Pseudonosema cristatellae, Trichonosema pectinatellae (microsporidia from freshwater bryozoa), Nosema sp. (isolated from a diving beetle), Microsporidium sp. (from a spontaneous infection in a semi-natural Daphnia population) and Ordospora sp. (from Daphnia galeata×mendotae or D. pulicaria).
Primers GlugoFwd CAGAAGCGGGGAACATCAGTC and GlugoRev GCTTTGACACTGCATTCTTTGAGT were used to amplify a 114 bp fragment located 331 bp downstream of the SSUrRNA gene of G. intestinalis (GenBank Accession no. AF394525). Primers OctoFwd CGAGCGAACAAGAAATAGCC and OctoRev ACCAAGCAACCCTACTCTGC were used to amplify a 137 bp fragment of the LSUrRNA gene of Oc. bayeri (GenBank Accession no. AY649786). Primers OrdoFwd GTGATGTTGAGTATTTGAGCG and OrdoRev CACTGACTCTTTCATCGTCC were used to amplify a 182 bp fragment of the SSUrRNA gene of Or. colligata (GenBank Accession no. AF394529). Primers of D. magna were chosen to amplify a 89 bp fragment of the actin gene (GenBank Accession no. AJ292544). Several primers in the rRNA gene were tested, yet they all had suboptimal amplification efficiencies.
Real-time quantitative PCR was performed in 20 μl reaction volumes on a Rotor-Gene 2000 (Corbett Research, Sidney, Australia) with SYBR Green PCR Master Mix (Applied Biosystems, Rotkreuz, Switzerland). Various concentrations of template and reagents were explored and the following were found to yield optimal results: 600 nM of each primer, 2 μl of template (i.e. 1% of the extracted DNA), 100 μg/ml BSA (New England Biolabs, Ipswich, MA, USA) and 0·25 units HotStarTaq DNA polymerase (Qiagen, Hilden, Germany) in addition to the polymerase in the mastermix.
The amplification profile consisted of an initial denaturation (15 min at 95 °C), 50 cycles (20 s at 94 °C, 20 s at 60 °C, 15 s at 72 °C followed by fluorescence acquisition) and a melting curve (60 °C–95 °C, rising by half a degree, resting for 5 s at each step, constant fluorescence acquisition). A negative control (2 μl of water) was included in every run. Samples were quantified using Rotor-Gene 6.0 software (Corbett Research, Sidney, Australia) and statistics were calculated with JMP v5.0.1a (SAS Institute Inc., Cary, NC, USA).
Amplification efficiency of parasite primers and reproducibility of qPCR were assessed with a dilution series of DNA extracted from a known number of spores. They contained DNA equivalent to 104 (105 for Oc. bayeri) down to 10 (1 for Oc. bayeri) spores and were replicated 4 times (8 times for Oc. bayeri). Dilution series also reflect ranges of infection intensities that occur in infected animals.
Primers for the quantification of D. magna DNA were tested with a dilution series of DNA extracted from a single adult Daphnia. Reactions contained DNA equivalents of 10−2 to 10−6 individual Daphnia and were replicated 4 times.
Relative quantification of samples in the tests below was done against a dilution series of DNA extracted from an adult infected Daphnia. Dilution series were replicated 4 times and contained the original extraction, a 5- and a 25-fold dilution. Measurements were expressed in spore equivalents by the calibration of the standard against extractions from pure spores.
Comparison of qPCR to light microscopy
Thirty-one Daphnia, previously exposed to Or. colligata, were screened for the parasite using both light microscopy and qPCR. Sample volume was 25 μl. We counted spores in 0·02 μl (0·8‰ of the sample) using a haemocytometer (Thoma ruling) with phase contrast-microscopy under 400× magnification. In our laboratory, this is the standard method for counting spores. From the remaining sample, DNA was extracted and 1% of the extraction was amplified by qPCR. Measurements from both methods were used to calculate either the number of spores (light microscopy) or spore equivalents (qPCR) in the whole sample. Data were log10[x+1] transformed and analysed by linear regression.
Reproducibility of DNA extraction and qPCR
Twelve adult Daphnia infected with Or. colligata were homogenized in 240 μl of deionized water, split in 12 aliquots from which DNA was extracted separately. In every sample, host and parasite DNA were quantified 4 times with qPCR (2×4×12=96 measurements). Data were log10 transformed prior to performance of ANOVA.
Correcting for variation in sample content
We prepared 12 samples from each of 3 D. magna genotype/Or. colligata isolate combinations (A, from Heverlee, Belgium; B, from Cumnor, UK; C, from Tvärminne, Finland). From each genotype, 8 animals were homogenized in 160 μl of deionized water and split in 12 samples of different volume (2 sets of 6 volumes: 5, 8, 11, 14, 17 and 20 μl) from which DNA was extracted. In every sample, parasite and host DNA were quantified 4 times by qPCR (12×3×2×4=288 measurements). Data were log10 transformed and averaged readings of both parasite and host DNA in every sample were analysed with ANOVA.
RESULTS
We observed no amplification when primers were tested against a variety of parasites of D. magna as well as other parasites that may occur in its habitat.
Quantitative PCR efficiencies were 94% (G. intestinalis), 95% (Oc. bayeri) and 94% (Or. colligata), with 100% indicating a doubling of products with every amplification cycle. Linear regression of parasite DNA readings against expected concentrations explained more than 98% of total variance in all 3 parasites (Fig. 1).

Fig. 1. Repeated qPCR readings of differentially concentrated genomic DNA extracted from spores of 3 microsporidian parasites. Estimates are expressed in spore equivalents.
Using qPCR, we detected parasite DNA in samples that were diluted down to the equivalent of 1 spore per qPCR in all replicates of G. intestinalis and Or. colligata and in 3 of 8 replicates of Oc. bayeri. A dilution down to a tenth of a spore scored negative in all 8 replicates of Oc. bayeri. This reflects a Poisson error that is introduced at low DNA concentrations because only 1% of every DNA extraction is amplified. The number of DNA templates that are added to a qPCR follows a Poisson distribution: with decreasing mean, there is an unavoidable increase in the standard deviation (Fig. 1).
Artifactual amplifications (e.g. primer dimers) occured sporadically in negative controls (after cycle 35) and could clearly be discerned by melting peak analyses. A lower primer concentration (300 nM) eliminated artifactual amplifications but also decreased reaction efficiencies.
Amplification of the actin gene of D. magna had a reaction efficiency of 96%. Linear regression of ct values against expected concentrations explained 99% of the variance down to 10−4 equivalents of a single animal in the PCR. At 10−5 and 10−6 equivalents, 1 of 4 and 5 of 6 samples respectively scored negative.
Comparison of qPCR to light microscopy
Using qPCR, we detected Or. colligata in all 31 samples. In contrast, we detected the parasite in 71% (23/31) of the samples when we used light microscopy. It should be noted that the remaining 8 samples were those that scored lowest in qPCR. We observed a strong linear relationship between the two methods using linear regression (Fig. 2; n=23, r2=0·91, log10[spore count+1]=0·74+0·86×qPCR reading). Thus, the two methods were in accordance and both are valid approaches for parasite quantification. However, the resolution attained using qPCR was more than an order of magnitude higher.

Fig. 2. Ordospora colligata spore counts by light microscopy plotted against qPCR readings of 31 samples. Linear regression was performed with data from samples that scored positive with both methods. Numbers are spores or spore equivalents in the whole sample.
Reproducibility of DNA extraction and qPCR
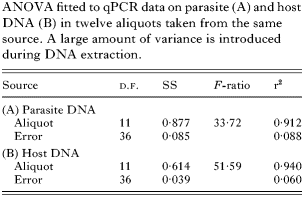
The quantity of parasite and host DNA differed significantly in extractions from aliquots of the same source material (Table 1). More than 90% of the variance was attributable to DNA extraction, while qPCR added less than 10%. Between aliquots, estimates of parasite and host DNA varied up to a factor of 2·9 and 2·4, respectively.
Readings of parasite and host DNA correlated across aliquots (Fig. 3, r2=0·78, P<0·001). The regression slope did not deviate significantly from one (intercept=5·91±0·28 S.E., slope=1·06±0·18 S.E., t-test for the slope being different from unity: t=0·33, D.F.=11, P=0·25). This indicates that aliquots varied primarily in total amount of DNA and the ratio of parasite to host DNA remained unchanged. When the ratio was used as a measure of infection intensity, estimates varied only up to a factor of 1·6 between aliquots.
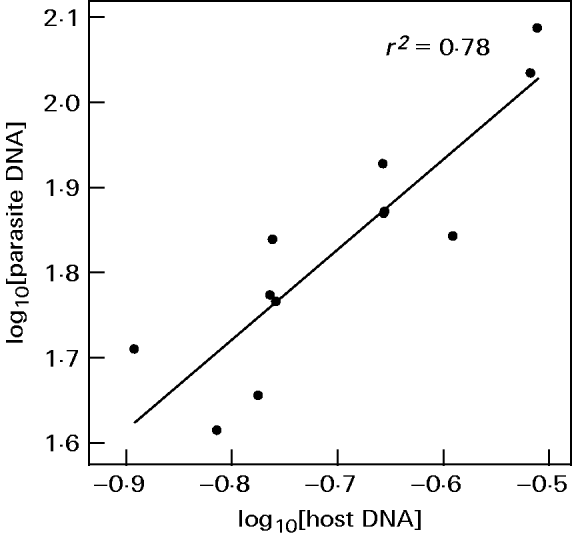
Fig. 3. qPCR readings of Ordospora colligata plotted against readings of Daphnia magna from DNA extractions of aliquots from infected host tissue. Data are averages of 4 readings.
Correcting variation in total DNA content
We took samples from 3 infected host genotypes and deliberately varied their volume. ANOVA on qPCR readings showed that this obscured differences in infection intensity between host genotypes. Host genotype explained only 79% of total variance in parasite DNA (Table 2). As the total amount of DNA in samples was varied, host DNA was also affected and host genotype explained 71% of the total variance in host DNA.
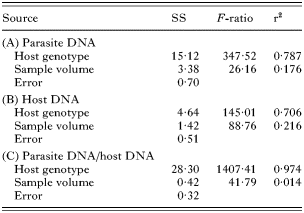
We calculated the ratio of parasite to host DNA from qPCR readings. We found that the use of this ratio reduced the variation arising from differences in total DNA content. After this correction, sample volume explained only 1% of total variation, while differences between host genotypes explained 97% (Fig. 4).

Fig. 4. Infection intensity measured by qPCR in samples from 3 different host genotypes infected with Ordospora colligata. Content of samples was deliberately varied to obscure differences between host genotypes. (A) Measurements of parasite DNA. (B) Ratio of parasite DNA against host DNA.
According to readings of parasite DNA alone, host genotype B had a higher infection intensity than genotype C (least square means contrast, P<0·001). However, samples from genotype C contained less total DNA as revealed by readings of host DNA (least square means contrast, P<0·001). Thus, after application of the ratio of parasite to host DNA, genotype C carried the highest parasite burden (least square means contrast, P<0·001).
DISCUSSION
We developed a method based on qPCR to detect, discriminate and quantify the microsporidian parasites Glugoides intestinalis, Octosporea bayeri and Ordospora colligata in their host, the planktonic freshwater crustacean Daphnia magna. This method can be readily applied to other invertebrate host-microparasite systems, e.g. Vavraia culicis in Aedes aegypti (Bedhomme et al. 2004) or Nosema whitei in Tribolium castaneum (Fischer and Schmid-Hempel, 2005).
Using this approach, we discriminated between prominent microsporidian parasites of D. magna. This method was developed to analyse individual and population samples from experiments where the parasite community is known, rather than environmental surveys. Although we tested specificity with a range of different parasites of both Daphnia as well as other co-occurring hosts, this cannot ensure complete specificity because knowledge of microsporidian parasites in freshwater hosts is limited.
Our ability to detect parasites was strongly increased by using qPCR compared to conventional light microscopy. In G. intestinalis and Or. colligata, we detected unambiguously parasite DNA equivalent to a single spore. We detected Oc. bayeri in DNA equivalents as low as 10 spores but not at lower concentrations. Possible reasons are a low copy number of the rRNA genes in this parasite or a less efficient DNA extraction. Furthermore, this is an expected shortcoming of any quantification method that analyses only a part of a sample. Based on theoretical considerations, we expect that the number of target sequences in the PCR is Poisson distributed. If a 95% probability for successful detection is required, less than 3 target sequences cannot be detected reliably. If 1% of the DNA extraction is subjected to qPCR, the threshold for reliable detection lies at 3×100=300 target sequences. Using light microscopic detection, we typically examine 0·08‰ of a sample which sets the threshold to 3×1250=3750 spores. This conforms with the results of the two methods, where we found that sensitivity of qPCR was more than an order of magnitude more sensitive than light microscopy.
Parasites were quantified relative to a standard of unknown concentration (genomic DNA from an infected animal). We did not use sequences cloned into plasmids due to concerns about laboratory contamination. In addition, our approach is simpler and requires less laboratory equipment and capabilities. DNA extractions from infected animals are easily obtained and are in all respects similar to samples. If absolute numbers are required, standards can be calibrated with DNA from a suspension of spores. Infection intensity is then expressed in spore equivalents, which will approximate the real number of parasites.
Ploidy levels of microsporidia can change during their life-cycle and DNA extracted from sporal and presporal stages may contribute differently to total infection intensity. Although meiosis has not been observed in G. intestinalis and Or. colligata (Larsson et al. 1996, 1997, no data are available on Oc. bayeri), this may bias estimates of infection intensity. This shortcoming of the method cannot be circumvented, yet other approaches, such as light microscopy have their own limitations.
We found that DNA extraction added a substantial amount of variation to the total amount of DNA in a sample. Initially equal samples differed up to 3-fold after DNA extraction. Variance component analysis revealed that 90% of the variation in aliquots from the same source was due to DNA extraction whereas only 10% were introduced during PCR. Several factors contribute to this variation: differences in proteinase activity between samples, differences in the amount of DNA that is retained in the columns of the extraction kit and pipetting errors. The latter cannot be the only reason as the observed variation is much too big to arise by pipetting errors alone. Pipetted volumes were generally bigger than 200 μl and precision of pipettes has a standard deviation of 0·2 μl (Finnpipette datasheet, Thermo Electron, Waltham, MA, USA). All these sources are likely to occur during routine work in the laboratory and will limit the resolution of qPCR.
A substantial amount (78%) of the variation introduced during DNA extraction affected the total amount of DNA in the samples. Thus the ratio of parasite to host DNA remained largely unchanged. This variation can be removed if this ratio is used as a measure of infection intensity. The ratio provides a more robust measure than parasite DNA alone and greatly improves the resolution of qPCR. This approach is similar to the use of total RNA concentration to normalise quantification of mRNA transcripts in RT qPCR (Bustin, 2000). The decision to apply this measure can be made a posteriori: if treatment effects do not overcome residual variation in the data, host DNA can be measured subsequently. No extra extraction is required and additional costs and work time are minimal. Simultaneous amplifications could be done (e.g. by using TaqMan probes) but competition between amplification products may interfere with quantification (Candotti et al. 2004).
In some cases, it is imperative to correct samples for total DNA content; epidemiological studies may require the assessment of infection intensities in several host populations (e.g. Pulkkinen and Ebert, 2004). In the case of D. magna and other small hosts, fractions of every population can be sampled, homogenized and DNA extraction and quantification is then done with an ‘averaged’ individual. Because populations will differ in age and size structure, samples will contain different amounts of total DNA. The ratio of host to parasite DNA standardizes them and allows their comparison. Average infection intensity per individual in a population can be assessed without the screening of individual hosts. One drawback is that differences in prevalence between populations cannot be detected. The method may also correct for differences in sample quality, e.g. degraded or aged samples, where a part of the DNA has been destroyed.
We tested the applicability of our method to correct for differences in sample volume. We assembled 12 samples each from 3 different host genotypes and deliberately varied their volume. Differences between host genotypes were obscured when parasite DNA was quantified to measure infection intensity. When we used the ratio of parasite to host DNA as the measure of infection intensity, variation between samples from the same host genotype was decreased and differences between host genotypes were accentuated. Moreover, infection intensities of 2 host genotypes were reversed after employing the ratio of parasite to host DNA as the measure of infection intensity.
Glugoides intestinalis and Or. colligata establish moderate infections, which are confined to the upper half of the gut epithelium. Here, it is appropriate to use the ratio of parasite to host DNA as a measure of infection intensity, because host biomass is not affected by the amount of parasites present. However, if this correction is to be applied to more virulent parasites, which substantially decrease host biomass (e.g. trematodes in snails, Lively and Dybdahl, 2000), it may be appropriate to use the ratio of parasite biomass to total (parasite and host) biomass. In such a case, DNA measurements of host and parasite must be transformed to comparable units of biomass. However, we expect that strong infections will not generally require a correction and that quantification of parasite DNA alone will be sufficient.
Comments by J. Jokela, S. Lass, A. Mathis and M. Zbinden improved this manuscript. M. Kölliker gave statistical advice. H. Ganz polished the English. Both authors were supported by the Swiss National Science Foundation.



