INTRODUCTION
Chagas' disease, caused by the protozoan Trypanosoma cruzi, represents a serious health problem in Latin America (Rassi et al. Reference Rassi, Rassi and Marin-Neto2010). This disease has been recognized as an opportunistic disease in human immunodeficiency virus (HIV)-infected individuals (Vaidian et al. 2004) and is emerging in non-endemic areas because of international immigration (Schmunis, Reference Schmunis2007). The life cycle of T. cruzi involves a haematophagous triatomine insect, a vertebrate host, and different parasitic forms. Briefly, a bloodstream trypomastigote ingested by the insect differentiates into an epimastigote, which proliferates and, in the posterior intestine, differentiates into the metacyclic form. This infective form invades the vertebrate cell and undergoes differentiation into an intracellular amastigote, which proliferates and then transforms into a trypomastigote, the T. cruzi form that causes the infection.
T. cruzi and other trypanosomatids present several peculiar morphological and biochemical characteristics, including the presence of a single mitochondrion equipped with a branched electron-transport chain and the kinetoplast – a DNA-rich specialized region – which is a hallmark of kinetoplastid protozoa (Menna-Barreto et al. Reference Menna-Barreto, Goncalves, Costa, Silva, Pinto, Oliveira and de Castro2009a). Oxidative phosphorylation, which is localized in the inner membrane of this organelle, represents a key checkpoint in the redox balance since it is the main source of reactive oxygen species (ROS) in the parasite. The partial reduction of molecular oxygen to superoxide and its subsequent dismutation to hydrogen peroxide, which is toxic to the protozoa, indicates that this organelle is a promising target for drug intervention (Soeiro and de Castro, Reference Soeiro and de Castro2011).
The development of an efficient chemotherapeutic approach for Chagas' disease poses a critical challenge because the available drugs based on the nitro-derivatives – nifurtimox and benznidazole – are far from ideal. This is because they cause substantial secondary side effects, have limited efficacy against different parasite isolates, need to be used in long-term therapy, and show poor activity in the late chronic phase (Soeiro and de Castro, Reference Soeiro and de Castro2009; Urbina, Reference Urbina2010).
In the last decade, there has been a growing interest in the therapeutic use of natural products for the treatment of parasitic diseases (Coura and de Castro, Reference Coura and de Castro2002); in folk medicine, plants containing naphthoquinones are often used in the treatment of various diseases (Hazra et al. Reference Hazra, das Sarma and Sanyal2004). These bioactive quinones are present in plants belonging to several botanical families and structures are considered privileged in medicinal chemistry because of their biological activities and structural properties (Pinto and de Castro, Reference Pinto and de Castro2009; Salas et al. Reference Salas, Faúndez, Morello, Maya and Tapia2011). The fundamental feature of quinones is the ease with which they are reduced, which allows them to act as oxidizing or dehydrogenating agents, and thus to generate ROS in a variety of cells, including T. cruzi (Docampo et al. Reference Docampo, De Souza, Cruz, Roitman, Cover and Gutteridge1978; Menna-Barreto et al. Reference Menna-Barreto, Goncalves, Costa, Silva, Pinto, Oliveira and de Castro2009a).
The biological activity of the naphthoquinone lapachol extracted from the heartwood of trees of the genus Tabebuia (Bignoniaceae) and its cyclization product, β-lapachone, have been intensively studied (Pinto et al. Reference Pinto, Menna-Barreto, de Castro and Govil2007). Our laboratory has been involved in the investigation of naphthoquinones and semi-synthetic derivatives, being the potential of naphthoimidazoles derived from the reaction of naphthoquinones with amino-compounds as trypanocidal agents as described (Pinto et al. Reference Pinto, Pinto, Pinto, Rita, Pezzella and de Castro1997; Neves-Pinto et al. Reference Neves-Pinto, Dantas, De Moura, Emery, Polequevitch, Pinto, de Castro and Pinto2000; Moura et al. Reference Moura, Emery, Neves-Pinto, Pinto, Dantas, Salomão, de Castro and Pinto2001, Reference Moura, Salomão, Menna-Barreto, Emery, Pinto, Pinto and de Castro2004).
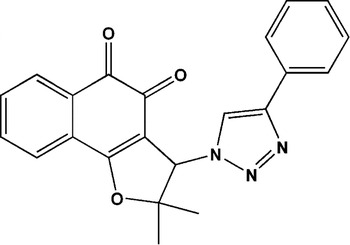
In our other studies on the chemical reactivity of quinones, we focused on the search of naphthofuranquinoid compounds (Silva et al. Reference Silva, Costa, Trindade, Teixeira, Pinto, Santos, Malta, de Simone, Pinto and de Castro2006; Silva Jr. et al. Reference Silva, Menna-Barreto, Pinto, Silva, Teixeira, Souza, de Simone, de Castro, Ferreira and Pinto2008a, Reference Silva, Souza, Fernandes, Menna-Barreto, Pinto, Lopes, Simone, Andrade, Pinto, Ferreira and de Castrob), and found that the most active compound against the infective trypomastigote form of T. cruzi was the triazole derivative TN (2,2-dimethyl-3-(4-phenyl-1H-1,2,3-triazol-1-yl)-2,3-dihydronaphtho[1,2-b]furan-4,5-dione) (Fig. 1). In the present work, we extended our investigation to the effect of TN activity on epimastigotes and amastigotes and the mechanism of action involved.
Chemical structure of the triazolic naphthoquinone TN obtained from nor-lapachol.

MATERIALS AND METHODS
Compound
TN (2,2-dimethyl-3-(4-phenyl-1H-1,2,3-triazol-1-yl)-2,3-dihydronaphtho[1,2-b]furan-4,5-dione) was synthesized by the reaction between 3-azido-nor-β-lapachone and ethynylbenzene catalysed by Cu. The key intermediate, azidoquinone, was generated by nucleophilic substitution from 3-bromo-β-nor-lapachone with sodium azide in dichloromethane, as previously described (Silva Jr. et al. Reference Silva, Souza, Fernandes, Menna-Barreto, Pinto, Lopes, Simone, Andrade, Pinto, Ferreira and de Castro2008b).
Parasite
All experiments were performed with the Y strain of T. cruzi. The epimastigote forms were maintained axenically at 28°C, with weekly transfers into liver infusion tryptose (LIT) medium and harvests during the exponential growth phase. Bloodstream trypomastigotes were obtained from infected albino Swiss mice at the peak of parasitaemia by differential centrifugation.
Direct effect of TN on T. cruzi
Bloodstream trypomastigotes were resuspended at a concentration of 10×106 cells/ml in Dulbecco's modified Eagle's medium (Sigma-Aldrich Chemical Co.) containing 10% fetal calf serum (DMES). This suspension (100 μl) was added to the same volume of TN, previously prepared at twice the desired final concentrations. The incubation was performed in 96-well microplates (Nunc Inc., Rochester, USA) at 4°C for 24 h. The effect of TN on the proliferation of epimastigotes in LIT medium was monitored during 4 days at 28°C using 24-well plates (Nunc Inc.). Cell counts were performed using the Neubauer chamber and the activity of the compounds was expressed as IC50, corresponding to the concentration that leads to 50% parasite lysis (trypomastigotes) or proliferation inhibition (amastigotes and epimastigotes).
Effects of TN on intracellular amastigotes
Mice peritoneal macrophages were obtained from Swiss mice and were plated into 24-well plates (Nunc Inc.) at a density of 106 cells/well in DMES and maintained at 37°C. After 1 day, the cultures were washed and infected with bloodstream trypomastigotes (10:1 parasites to host cells). After 3 h of interaction, the non-internalized parasites were removed by washing with PBS, and fresh DMES with or without TN was added to the cultures and changed every 2 days. At specific times, the percentage of infection and the number or parasites per 100 cells were quantified using a Zeiss Axioplan microscope (Oberkochen, Germany).
Toxicity to mammalian cells
Non-infected macrophages cultured on 96-well plates (Nunc Inc.) were treated with TN for 2 days, and the toxicity was evaluated by performing a dye-reduction assay (Mosmann, Reference Mosmann1983). Briefly, the cells were incubated with 0·5 mg/ml MTT (3-(4,5-dimethylthiazol-2-yl)-2,5-diphenyltetrazolium bromide) for 4 h at 37°C, after which DMSO was added to stop the reaction. The absorbance was read at 490 nm.
Transmission and scanning electron microscopy analysis
Epimastigotes (5×10⁶ cells/ml) were treated with 3–9 μ m TN for 24 h in LIT medium at 28°C. They were then fixed with 2·5% glutaraldehyde in 0·1 m Na-cacodylate buffer (pH 7·2) at room temperature (25°C) for 40 min and post-fixed with a solution of 1% OsO4, 0·8% potassium ferricyanide, and 2·5 mm CaCl2 in the same buffer for 20 min at 25°C. The cells were dehydrated in an ascending acetone series and embedded in PolyBed 812 resin. Ultrathin sections were stained with uranyl acetate and lead citrate; these sections were examined under a Jeol JEM1011 transmission electron microscope (Tokyo, Japan). Alternatively, the parasites were dried by the critical-point method with CO2, mounted on aluminum stubs, coated with a 20-nm-thick gold layer, and examined under a Jeol JSM6390LV scanning electron microscope.
Flow cytometry analysis
To assess the mitochondrial membrane potential (ΔΨm), epimastigotes treated with 1·5–9·0 μ m TN for 24 h were incubated with 50 nm tetramethylrhodamine (TMRE) (Molecular Probes, Carlsbad, USA) for 15 min. Alterations in TMRE fluorescence were quantified using an index of variation (IV) obtained by the equation (MT−MC)/MC, where MT is the median of fluorescence for treated parasites, and MC, that of control parasites. Negative IV values correspond to depolarization of the mitochondrial membrane. In the case of the negative control, 10 μ m carbonyl cyanide 4-(trifluoromethoxy)phenylhydrazone (FCCP) (Sigma-Aldrich Chemical Co.) is added, which dissipates the ΔΨm.
For cell cycle analysis, epimastigotes treated with 1·5–6·0 μ m TN for 24 h were permeabilized with 0·1% saponin for 30 min followed by staining with 30 μg/ml propidium iodide (PI) for 15 min, as previously described (Menna-Barreto et al. Reference Menna-Barreto, Corrêa, Pinto, Soares and de Castro2007). For the evaluation of ROS production, the parasites treated with 3·0–9·0 μ m TN for 24 h were labelled with 10 μ m dihydroethidium (DHE) or 5 μ m Mitosox Red (Molecular Probes) for 30 min; parasites treated with 22 μ m antimycin A (AA) (Sigma-Aldrich Chemical Co.) were used as positive control in all experiments. The material was kept on ice until analysis. Data acquisition and analysis were performed using a FACSCalibur flow cytometer (Becton Dickinson, CA, USA) equipped with the Cell Quest software (Joseph Trotter, Scripps Research Institute, La Jolla, USA). In total, 10 000 events were acquired in the region previously established as that of the parasites.
Fluorescence microscopy analysis
After treatment, the parasites were washed and incubated with 100 μ m monodansyl cadaverine (MDC) (Sigma-Aldrich) for 1 h at 28°C. After fixation in 4% paraformaldehyde (40 min/room temperature), the analysis was performed in a Zeiss AxioObserver M1 microscope (Oberkochen, Germany) to quantify the percentage of parasites that were MDC+.
Statistical analysis
The Mann-Whitney test was used to compare the control and treated groups. Differences with P⩽0·05 were considered as statistically significant.
RESULTS
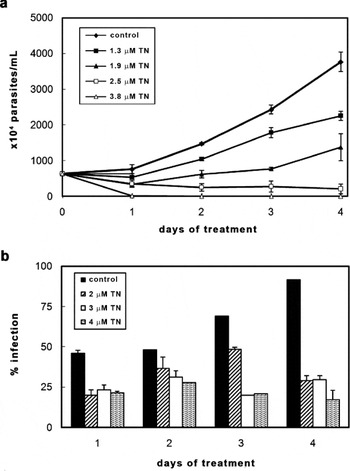
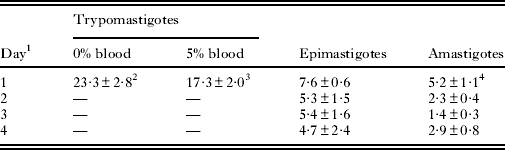
The treatment with TN was effective against bloodstream trypomastigotes, epimastigotes, and intracellular amastigotes, with IC50/1 day in the range of 3–25 μ m (Table 1). For trypomastigotes, IC50/24 h was 23·3±2·8 μ m in the absence of blood. The proliferative forms of T. cruzi were more susceptible to TN, having IC50/24 h values of 5·2±1·1 μ m and 7·6±0·6 μ m for amastigotes and epimastigotes, respectively (Table 1 and Fig. 2a,b). A dose-dependent inhibitory effect on epimastigotes (Fig. 2a) and a marked decrease of 81% in the number of infected peritoneal macrophages after 4 days of treatment (Fig. 2b) were observed. MTT experiments showed no damage to the host cells treated with 2 times the highest concentration of TN used in assays with infected cells (data not shown).
Effect of TN on the proliferation of Trypanosoma cruzi. (a) Epimastigotes; (b) intracellular amastigotes. The graphs show the mean and standard variation in 1 of 3 independent experiments, performed in duplicate.

IC50 values expressed in μ m for the effect of TN on different forms of Trypanosoma cruzi
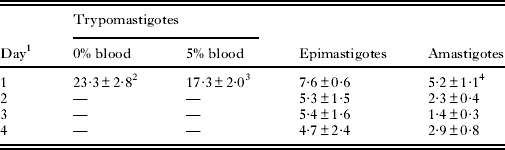
1 Days of treatment.
2 Mean±standard deviation of at least 3 independent experiments.
3 (Silva Jr. et al. Reference Silva, Menna-Barreto, Pinto, Silva, Teixeira, Souza, de Simone, de Castro, Ferreira and Pinto2008a).
4 Based on number of parasites per 100 macrophages.
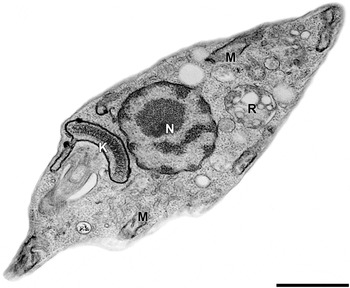
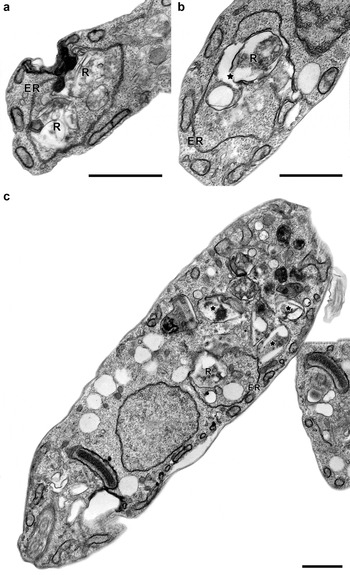
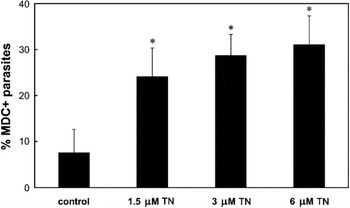
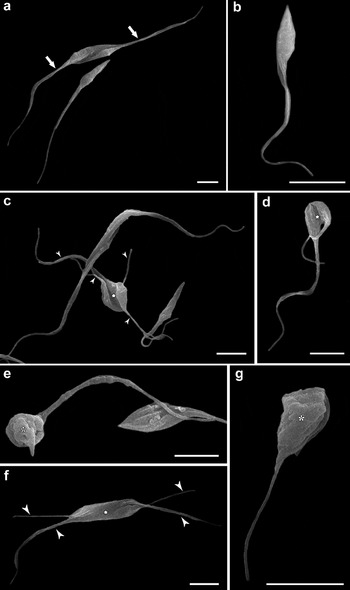
The ultrastructural effects of TN on epimastigotes after 24 h were analysed at concentrations below the IC50 value (Table 1). Transmission electron microscopy analysis revealed that untreated parasites showed normal ultrastructural morphology of organelles such as the mitochondrion, nucleus, kinetoplasts, and reservosomes (Fig. 3). The treatment of epimastigotes with 3 and 6 μ m TN (Figs 4 and 5) led to the appearance of well-developed endoplasmic reticulum profiles surrounding different subcellular structures, especially reservosomes. This finding suggests close contact between the membranes of both structures and also an intense disorganization in the reservosome morphology, including membrane disruption. Blebbing of the flagellar membrane, strong disorganization in the Golgi complex cisternae, and the presence of cytosolic concentric membrane structures were other frequent alterations induced by TN. Fluorescence microscopy revealed an increase of MDC-labelling in treated epimastigotes up to 30% MDC+ parasites (Fig. 6). Further, the mitochondria of treated parasites did not appear to be damaged (Figs 4 and 5). Treatment with a high concentration of 9 μ m TN led to severe morphological alterations in the protozoa, indicating the lysis of parasites (data not shown). Examination using scanning electron microscopy showed the typical elongated body morphology (Fig. 7a,b). TN (3 and 6 mm) induced remarkable alterations in epimastigotes characterized by the appearance of bizarre multiflagellar forms and abnormal morphology during parasite division (Fig. 7c–g). A semi-quantitative analysis was also performed, whereby approximately 80% of treated parasites were found to have aberrant morphology and around 40% presented bizarre multiple flagella (data not shown).
Transmission electron microscopy analysis of Trypanosoma cruzi epimastigotes. Untreated parasites present typical morphology of the mitochondrion (M), nucleus (N), kinetoplast (K), and reservosomes (R). Scale bar=1 μm.

Transmission electron microscopy analysis of Trypanosoma cruzi epimastigotes treated with 3 μ m TN. (a,b) Parasites showing well-developed endoplasmic reticulum (ER) profiles surrounding the reservosomes (R) (white arrowheads). The treatment also caused (c–e) intensive disorganization in the reservosome (R) morphology (black star) with loss of membrane integrity (black arrowheads), blebs in the flagellar membrane (black thick arrow), severe Golgi complex disruption (black arrows), and the formation of concentric membrane structures in the cytosol (asterisk). Scale bars=1 μm.

Transmission electron microscopy analysis of Trypanosoma cruzi epimastigotes treated with 6 μ m TN. (a–c) This dose of the naphthoquinone also led to the appearance of well-developed endoplasmic reticulum (ER) profiles surrounding the reservosomes (R), as well as a severe disruption of this organelle (black star). Scale bars=1 μm.

Fluorescence microscopy analysis of MDC labelling in TN-treated Trypanosoma cruzi epimastigotes. The treatment with TN induced an increase in the number of parasites containing autophagic vacuoles. The graphs show the mean and standard variation of 3 independent experiments. Asterisks represent the significant difference in relation to the control (P⩽0·009).

Scanning electron microscopy analysis of Trypanosoma cruzi epimastigotes treated with TN. (a,b) Control parasites presenting typical body morphology during mitosis (thick arrows). Treatment with (c–e) 3 μ m and (f,g) 6 μ m TN led to the appearance of bizarre epimastigotes with multiple flagella (arrowheads), abnormal parasite morphology during cytokinesis (stars), and strong alterations in shape (asterisks). Scale bars=5 μm.

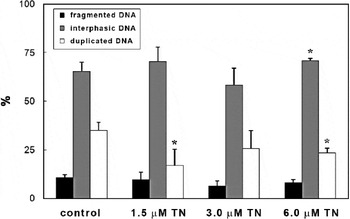
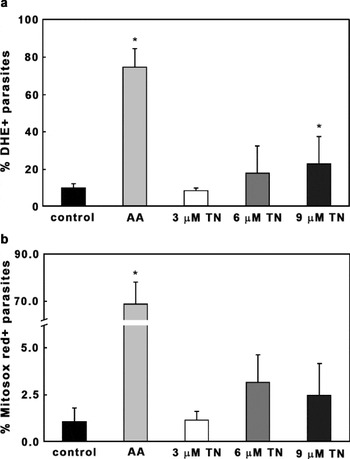
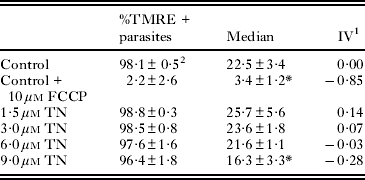
The ΔΨm was assessed by TMRE labelling monitored by flow cytometry. TN at concentrations ranging from 1·5 to 6 μ m induced no variation in fluorescence intensity, while at a concentration of 9 μ m, it produced a 28% decrease in the ΔΨm compared to the ΔΨm in control parasites. The percentage of epimastigotes labelled by this probe was similar in untreated and treated parasites (Table 2). Incubation of the cells with 10 μ m FCCP dissipated the ΔΨm and consequently decreased the extent of TMRE labelling. TN-treated epimastigotes were also labelled with PI for the evaluation of the cell cycle. This treatment led to a significant decrease in the percentage of parasites with duplicated DNA (Fig. 8), corresponding to an inhibition in the range of 27–52%. Further, at a concentration of 6 μ m, TN induced a 10% increase in the percentage of interphasic DNA. The percentage of epimastigotes with fragmented DNA was similar to that of control and treated parasites. ROS production was also measured by DHE or Mitosox Red labelling (Fig. 9). TN in the concentration range 3 to 9 μ m led to an increase in the percentage of DHE-positive and Mitosox Red-positive epimastigotes, reaching 23·1% (Fig. 9a) and 3·2% (Fig. 9b), respectively. The positive control with AA led to a strong increase in the labelling of both markers.
Flow cytometry analysis of the cell cycle in TN-treated Trypanosoma cruzi epimastigotes. The saponin-permeabilized parasites were labelled with PI for evaluation. Treatment with the quinone led to a decrease in the percentage of duplicated DNA epimastigotes. The graphs show the mean and standard variation of 3 independent experiments. Asterisks represent the significant difference in relation to the control (P ⩽0·05).

Flow cytometry analysis of ROS production in TN-treated Trypanosoma cruzi epimastigotes. ROS measurement was performed by (a) DHE and (b) Mitosox Red labelling. Treatment with TN induced an increase in the number of parasites producing ROS. As a positive control, 22 μ m AA was used. The graphs show the mean and standard variation in 1 of 3 independent experiments. Asterisks represent the significant difference in relation to the control (P⩽0·05).

Flow cytometry analysis of mitochondrial membrane potential in Trypanosoma cruzi epimastigotes by TMRE labelling
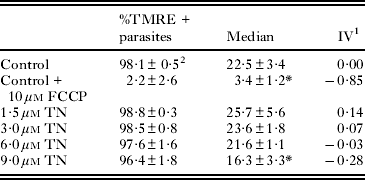
1 IV=(MT – MC)/MC, where MT corresponds to the median fluorescence for treated parasites, and MC corresponds to that of control parasites.
2 Mean±standard deviation of 3 independent experiments. Asterisks indicate significant differences in relation to the control group (P ⩽0·01).
DISCUSSION
Drugs (agents) containing a triazole nucleus or a cyclic dienone moiety have been reported to display a variety of independent biological activities, such as microbicidal, anti-viral, anti-cancer and anti-inflammatory (Holla et al. Reference Holla, Mahalinga, Karthikeyan, Poojary, Akberali and Kumari2005; Ferreira et al. Reference Ferreira, Costa, Boechat, Bezerra, Genestra, Canto-Cavalheiro, Kover and Ferreira2007; Abdel-Rahman et al. Reference Abdel-Rahman and Wada2009). The design of triazolic naphthofuranquinones (Silva Jr. et al. Reference Silva, Menna-Barreto, Pinto, Silva, Teixeira, Souza, de Simone, de Castro, Ferreira and Pinto2008a) was based on a molecular hybridization approach (Viegas-Jr. et al. Reference Viegas-Jr, Danuello, Bolzani, Barreiro and Fraga2007). In order to enhance the pharmacological activity of the naphthoquinoid compound, nor-β-lapachone-based 1,2,3-triazole was prepared by the insertion of the pharmacophoric group 1,2,3-triazole phenyl substituted in the C-ring of the quinone (Silva Jr. et al. Reference Silva, Souza, Fernandes, Menna-Barreto, Pinto, Lopes, Simone, Andrade, Pinto, Ferreira and de Castro2008b). Previous studies with T. cruzi trypomastigotes indicated that TN was the most active 1,2,3-triazolic naphthofuranquinone among a series of nor-β-lapachone derivatives, and such behaviour was attributed to its higher lipophilic character (Silva Jr. et al. Reference Silva, Menna-Barreto, Pinto, Silva, Teixeira, Souza, de Simone, de Castro, Ferreira and Pinto2008a). On comparing a high number of naphthoquinones, we observed that the presence of an aliphatic side chain leads to higher activity, possibly associated with an increase in lipophilicity and, consequently, better penetration of the compound through the plasma membrane of the parasite (Moura et al. Reference Moura, Emery, Neves-Pinto, Pinto, Dantas, Salomão, de Castro and Pinto2001).
Because of high TN activity against trypomastigote forms (IC50/24 h of 17·3±2·0 μ m at 4°C and in the presence of 5% mouse blood) (Silva Jr. et al. Reference Silva, Menna-Barreto, Pinto, Silva, Teixeira, Souza, de Simone, de Castro, Ferreira and Pinto2008a), this triazolic naphthofuranquinone was selected for further analysis. In the absence of blood (only in the culture medium), the IC50/24 h value was 23·3±2·8 μ m, suggesting a clear reduction in the trypanocidal effect induced by blood addition. Such a reduction has already been reported for β-lapachone and other naphthoquinones, and can be explained by the interaction of naphthoquinones with serum proteins, which reduces the amount of free compounds (Lopes et al. Reference Lopes, Cruz, Docampo, Vasconcellos, Sampaio, Pinto and Gilbert1978). TN showed higher activity against the proliferative forms of T. cruzi, with IC50/24 h values at 7·6±0·6 μ m and 5·2±1·1 μ m in epimastigotes and amastigotes, respectively. The most susceptible form of the parasite was the intracellular amastigote which indicates that the trypanocidal effect of naphthoquinone could be potentialized by the microbicidal properties of macrophages.
In order to identify potential targets of TN in T. cruzi, electron microscopy and flow cytometry analysis of treated epimastigotes were performed. Interestingly, there was no morphological damage in the mitochondrion or loss of ΔΨm after treatment with 3 and 6 μ m TN – concentrations below the IC50 value. Previous studies have reported this organelle to be the main target of β-lapachone and naphthoimidazole derivatives of this quinone and also of naphthofuranquinones derived from C-allyl lawsone (Docampo et al. Reference Docampo, De Souza, Cruz, Roitman, Cover and Gutteridge1978; Menna-Barreto et al. Reference Menna-Barreto, Henriques-Pons, Pinto, Morgado-Diaz, Soares and DeCastro2005, Reference Menna-Barreto, Corrêa, Pinto, Soares and de Castro2007, Reference Menna-Barreto, Goncalves, Costa, Silva, Pinto, Oliveira and de Castro2009a). The presence of the triazolic moiety led to an alteration in structural configuration and ROS production, thus reducing the availability of TN inside the mitochondrion and consequently leading to damage in other structures in the parasite. The treatment with TN also led to reservosome disruption, strong disorganization in Golgi cisternae, and the development of membrane blebs in the flagellum.
The most common phenotype observed in TN-treated epimastigotes was autophagy as demonstrated by the well-developed endoplasmic reticulum profiles surrounding reservosomes, close contact between the membranes of 2 organelles, and the presence of cytosolic concentric membrane structures. Autophagy involving the autophagosomal-lysosomal system is crucial for maintaining the metabolic balance by the recycling of cellular structures; however, its deregulation leads to death (Reggiori and Klionsky, Reference Reggiori and Klionsky2002). In T. cruzi, 2 ubiquitin-like conjugation systems were present, being the orthologues of the ATG8-ATG7-ATG3 system previously detected in T. cruzi (Brennand et al. 2011; Duszenko et al. Reference Duszenko, Ginger, Brennand, Gualdrón-López, Colombo, Coombs, Coppens, Jayabalasingham, Langsley, de Castro, Menna-Barreto, Mottram, Navarro, Rigden, Romano, Stoka, Turk and Michels2011).
Brennand and colleagues (2011) also suggested that differences in catabolic and biosynthetic capacities of the trypanosomatids occurred between life-cycle stages, leading to the morphological changes and metabolic adaptations. Such events depend on the increase in turnover of structural and enzymatic constituents of the parasites (Duszenko et al. Reference Duszenko, Ginger, Brennand, Gualdrón-López, Colombo, Coombs, Coppens, Jayabalasingham, Langsley, de Castro, Menna-Barreto, Mottram, Navarro, Rigden, Romano, Stoka, Turk and Michels2011). In T. brucei, ultrastructural studies pointed to the involvement of autophagy during differentiation of the parasites (Vickerman and Tetley, Reference Vickerman and Tetley1977). The importance of the autophagic process during differentiation was suggested in Leishmania species (Waller and McConville, Reference Waller and McConville2002) and T. cruzi, as demonstrated by the participation of reservosomes (Sant'anna et al. Reference Sant'Anna, Parussini, Lourenço, de Souza, Cazzulo and Cunha-e-Silva2008). The strong alterations observed in these organelles suggested the autophagic process as a part of the TN mechanism of action in epimastigotes. Several classes of drugs have been shown to induce autophagy in trypanosomatids, in particular naphthoquinones and derivatives in T. cruzi, in which an increase in the number of ATG transcripts and specific inhibition of the process were detected (Menna-Barreto et al. Reference Menna-Barreto, Salomão, Dantas, Santa-Rita, Soares, Barbosa and de Castro2009b, Reference Menna-Barreto, Corrêa, Cascabulho, Fernandes, Pinto, Soares and de Castroc; Duszenko et al. Reference Duszenko, Ginger, Brennand, Gualdrón-López, Colombo, Coombs, Coppens, Jayabalasingham, Langsley, de Castro, Menna-Barreto, Mottram, Navarro, Rigden, Romano, Stoka, Turk and Michels2011). Anti-microbial peptides and rapamycin induced autophagy in L. donovani and T. brucei (Bera et al. Reference Bera, Singh, Nagaraj and Vaidya2003; Denninger et al. Reference Denninger, Koopmann, Muhammad, Barth, Bassarak, Schönfeld, Kilunga and Duszenko2008), respectively, showing an increase in the number of autophagic vacuoles (MDC labelled) and the appearance of typical morphological characteristics, such as those observed after treatment with TN. The increase in the MDC fluorescence in treated epimastigotes also suggests the participation of autophagy in the TN mechanism of action. Our ultrastructural data suggested that the endoplasmic reticulum provided membrane for the formation of the pre-autophagosomal structure, as previously reported (Klionsky et al. Reference Klionsky, Cregg, Dunn, Emr, Sakai, Sandoval, Sibirny, Subramani, Thumm, Veenhuis and Ohsumi2003).
Scanning electron microscopy demonstrated that TN induced the appearance of multiflagellar epimastigotes; this suggests the blockage of mitosis by TN, which has already been described for epimastigotes after treatment with agents that affect the cytoskeleton (Jordan and Wilson, Reference Jordan and Wilson1999; Menna-Barreto et al. Reference Menna-Barreto, Salomão, Dantas, Santa-Rita, Soares, Barbosa and de Castro2009b). To confirm this hypothesis, flow cytometry assays of the cell cycle were performed in parasites after treatment with the same TN concentrations used in the ultrastructural analysis. TN induced a significant reduction in the percentage of epimastigotes with duplicated DNA; this indicates that the event triggered by this naphthoquinone occurs before the duplication of genetic material, and hence before the impairment of cytokinesis. In T. brucei, the compound dihydroxyacetone also led to cell cycle arrestment and to the appearance of morphological autophagic features (Uzcátegui et al. Reference Uzcátegui, Denninger, Merkel, Schoenfeld, Figarella and Duszenko2007). Indeed, further experiments must be performed in order to evaluate the cross-link between these two effects of TN.
The T. cruzi mitochondrion is an organelle implicated in both ATP synthesis and redox homeostasis, since it is the main source of ROS in the parasite. In trypanosomatids, the lack of detoxification of ROS and reactive nitrogen species makes this organelle an extraordinary drug target (Soeiro and de Castro, Reference Soeiro and de Castro2009). It is well established that the mechanism of action of naphthoquinones involves ROS generation in different models, including T. cruzi (Docampo et al. Reference Docampo, De Souza, Cruz, Roitman, Cover and Gutteridge1978; Menna-Barreto et al. Reference Menna-Barreto, Goncalves, Costa, Silva, Pinto, Oliveira and de Castro2009a). We evaluated ROS production in epimastigotes after treatment with TN by flow cytometry using the following 2 fluorescent probes: DHE, which is commonly employed in cardiovascular research for intracellular detection of ROS, (Dikalov et al. Reference Dikalov, Griendling and Harrison2007) and Mitosox Red, a specific marker of mitochondrial ROS, widely used to measure ROS production inside this organelle after oxidative stress stimuli (Robinson et al. Reference Robinson, Janes and Beckman2008). TN treatment induced a clear increase in the number of cells generating ROS, as shown by the results of flow cytometry performed using both probes. The ultrastructural analysis pointed to cytosolic but not mitochondrial damage, thus supporting the flow cytometry data. Previously, it was shown that both naphthopyran and naphthofuranquinones induced ROS production in T. cruzi and caused extensive morphological damage in the mitochondrion (Docampo et al. Reference Docampo, De Souza, Cruz, Roitman, Cover and Gutteridge1978; Menna-Barreto et al. Reference Menna-Barreto, Goncalves, Costa, Silva, Pinto, Oliveira and de Castro2009a). Interestingly, TN led to an increase in ROS levels through a mitochondrion-independent pathway, evidenced by the lack of morphological and ΔΨm alterations in this organelle after the treatment. Despite the high amounts of trypanothione in epimastigotes (Irigoin et al. Reference Irigoin, Cibils, Comini, Wilkinson, Flohe and Radi2008), the oxidative stress triggered by TN probably plays a role in the trypanocidal activity of this compound and must be further investigated.
Our data exclude the possibility of the mitochondrion being a TN target; this triazolic naphthofuranquinone displays a mechanism of action different from those of other studied naphthoquinones. The trypanocidal action of TN involves autophagy, especially of reservosomes, mitosis blockage, and ROS generation that culminates in parasite death. Finally, hybrid molecules obtained from quinones and triazoles lead to an increase in the redox properties of quinones and represent an excellent starting point for the development of new candidates for a chemotherapeutic approach for treating Chagas' disease.
ACKNOWLEDGMENTS
The authors thank Dr Marcus Oliveira for his critical reading of this work and Mr Marcos Meuser for his excellent technical work.
FINANCIAL SUPPORT
This work was supported by grants from CNPq, FAPERJ (PRONEX E-26/110.574/2010), and FIOCRUZ.