


Introduction
The objective of this study is to determine the origin of laminated, silt-rich debris bands found in the western terminus region of Matanuska Glacier, Alaska, U.S.A. Preliminary isotopic (3 H, δ18O, and δD) and sedimentological data are presented to assess mechanisms of formation. A new ice- bed process utilizing a pressurized and glaciohydraulically supercooled subglacial drainage system is proposed to explain the origins of these bands.
Several mechanisms have previously been proposed to explain debris band formation and its role in sediment transport. One is the “shear hypothesis” put forth by Reference GoldthwaitGoldthwait (1951). He hypothesized that “shear plane” transport could move debris from the base of the glacier along inclined planes to deposit subglacial material supraglacially (some as large as boulder-sized). Reference Grove and LewisGrove (1960) proposed that debris bands with a sediment load resembling coarse, angular supraglacial debris, form by the deposition of valley-wall materials on the ice surface in the accumulation area. These deposits are subsequently buried by snow that recrystallizes and is transported to the terminus, where the debris bands are exposed by ablation. A more recently proposed mechanism (Reference Hubbard and SharpHubbard and Sharp, 1995) suggests that open crevasses fill with wind-blown or water-transported debris and subsequently close by ice flow. Reference Clarke and BlakeClarke and Blake (1991) and Reference Hambrey, Dowdeswell, Murray and PorterHambrey and others (1996) describe debris bands at a surge-type glacier that originate by thrusting during the surge, with the grain-size distribution containing a coarse, basally derived component.
The role of debris bands in sediment transport has been hypothesized to be important in the deposition of large land- forms associated with deglaciation events (Reference BishopBishop, 1957; Reference Moran and GoldthwaitMoran, 1971; Reference Stewart, MacClintock and GoldthwaitStewart and MacClintock, 1971; Reference Koteff and CoatesKoteff, 1974; Reference Sugden and JohnSugden and John, 1976; Reference Evenson, Pasquini, Stewart, Stephens and SchluchterEvenson and others, 1979; Reference EhlersEhlers, 1981; Reference Koteff and PesslKoteff and Pessl, 1981; Reference MulhollandMulholland, 1982). However, the importance of debris bands in sediment transport and deposition has also been discounted by several authors (Reference WeertmanWeertman, 1961; Reference BoultonBoulton, 1970; Reference HookeHooke, 1973; Reference Evenson, Clinch, Kujansuu and SaarnistoEvenson and Clinch, 1987; Gustavason and Boothroyd, 1987).
Site Description
Matanuska Glacier is a 48 km long valley glacier that drains 647 km2 of the Chugach Mountains in south-central Alaska (Reference Williams and FerriansWilliams and Ferrians, 1961) and flows north into the upper Matanuska River valley (Fig. 1). The terminus is 5 km wide and is located 135 km northeast of Anchorage. Elevation decreases from 3500 m a.s.l. in the accumulation zone to 559 m at the terminus. The southwestern portion of the terminus has been the focus of previous and current research on subglacial hydrology (e.g. Reference LawsonLawson, 1986, 1993; Reference Ensminger, Evenson, Alley, Larson, Lawson, Strasser, Mickelson and AttigEnsminger and others, in press) and the growth and accretion of basal ice (Reference Lawson and KullaLawson and Kulla, 1978; Reference LawsonLawson, 1979a, Reference Lawsonb; Reference Strasser, Lawson, Evenson, Gosse and AlleyStrasser and others, 1992; Reference Lawson and HunterLawson and others, 1996; Reference Strasser, Lawson, Larson, Evenson and AlleyStrasser and others, 1996; Reference Alley, Lawson, Evenson, Strasser and LarsonAlley and others, 1998; Reference Lawson, Strasser, Evenson, Alley, Larson and ArconeLawson and others, 1998).
Matanuska Glacier (approx. 60° N, 148° W) flows north out of the Chugach Mountains and terminates in the upper Matanuska River Valley (arrow), 135km northeast of Anchorage.

Ice flows out of several overdeepened basins along the western portion of Matanuska Glacier’s terminus, as evidenced by the ice surface profile, crevasses, and ground-penetrating radar data (Reference Arcone, Lawson and DelaneyArcone and others, 1995). The down- glacier extent of one such overdeepening almost coincides with the current ice margin (Fig. 2). Supercooling can be caused by water flowing up the adverse slopes of such overdeepened basins, as the pressure-melting temperature can rise more rapidly than the water warms (Reference Hooke and PohjolaHooke and Pohjola, 1994; Reference Lawson and HunterLawson and others, 1996; Reference Alley, Lawson, Evenson, Strasser and LarsonAlley and others, 1998). Platy and dendritic frazil ice nucleates and grows in turbulent supercooled water (Reference ForestForest, 1994), like that of Matanuska Glacier’s subglacial discharge in overdeepened areas (Reference Lawson, Strasser, Evenson, Alley, Larson and ArconeLawson and others, 1998). Terraces of frazil ice grow at the ice margin in conduit orifices and vents during the melt season (Reference Strasser, Lawson, Larson, Evenson and AlleyStrasser and others, 1996; Reference Evenson, Lawson, Strasser, Larson, Alley, Ensminger, Mickelson and AttigEvenson and others, in press). Accretion of frazil ice to the base of the glacier is hypothesized to occur by processes similar to those known to produce ice terraces (Reference Alley, Lawson, Evenson, Strasser and LarsonAlley and others, 1998; Reference Lawson, Strasser, Evenson, Alley, Larson and ArconeLawson and others, 1998).
Map traced from aerial photograph (1:10000) of southwestern region of Matanuska Glacier’s terminus. Only a few debris bands are mappable at this scale. The adverse slopes responsible for glaciohydraulically supercooling the subglacial waters lie within the overdeepening Laminated, silt- rich debris bands are found only within or down-glacier of overdeepenings.

Fracturing of the ice occurred at the ice margin within the overdeepening during recent melt seasons. The open fractures connected the ice surface to the drainage system. Some fractures contained small upwellings of sediment-laden water, suggesting a subglacial water source. Platy ice grew within this water as it discharged from the fractures, even during July when overnight air temperatures were above freezing. A drop in discharge subsequently exposed this new platy ice growth along the walls of one such fracture (Fig. 3).
Platy frazil-ice crystals grow subaqueously, inward from a newly opened fracture’s walls. Frazil-ice growth occurs during periods of warm air temperature and high subglacial discharge. Ice crystals are exposed during periods of low discharge. A backpack is shown for scale.

Debris-Band Character
Laminated, sediment-rich debris bands are found within and down-glacier of overdeepened basins, near the ice margin where the subglacial drainage system is pressurized and supercooled. The debris bands are laterally extensive for hundreds of meters (Figs 2 and 4) and many trend in the same general southwest to northeast direction; however, other orientations are also observed. The debris bands usually have a steep to almost vertical up-glacier dip, but opposite dips do occur. Debris bands can often be traced laterally to where they contact one another, or a debris band may bifurcate in places along its length forming “lozenges” as it splits and rejoins (left of center, Fig. 4).
View northeast to icefall near the margin. Several laminated, silt-rich debris bands lie approximately parallel to one another. The widest debris band (center) appears to be lm wide. Note there are three prominent “splays” branching off this debris band that also bifurcates in places along its length.

The sediment is visibly concentrated in a centrally located seam or in several subparallel laminations just a few millimeters thick. The sediment in laminated debris bands appears to consist predominantly of silt to very fine sand (Fig. 5a). Commonly, adjacent to the fine-grained debris laminations are subparallel clear, clean ice layers that are in contact with the bubbly, clean ice of the englacial zone (Fig. 5b). In some cases, debris bands can also be traced to a contact with the stratified basal ice (Reference LawsonLawson, 1979b; Reference Hubbard and SharpHubbard and Sharp, 1995). Sediment released by ablation from the debris bands forms sediment flows on the ice surface (e.g. Reference LawsonLawson, 1982).
(a) Hand specimen broken from the surface of a laminated, silt-rich debris band. Note the exceptionally clean ice lacking bubbles between the laminations. There is no observable coarse-fraction in the sediment. (b) Looking up at the roof of an ice cave. The centrally located seam of sediment has clean, clear diffused englacial ice, symmetric about either side. The white ice is clean, bubbly diffused facies ice of the englacial zone. (Hand for scale).

Open annuli or “conduits” can be found within laminated debris bands (Fig. 6). Conduits vary in diameter from a few centimeters to tens of centimeters. It is not uncommon for several conduits to be found near one another. Annular ice growth is characteristic inside these conduits. The conduits resemble the “fossil moulin” of Reference HolmlundHolmlund (1988) and the “crystal quirke” of Reference StenborgStenborg (1968) and, therefore, are possibly indicative of water-filled crevasse closure in poly- thermal ice. They may equally be indicative of supercooled water flow through fractures that subsequently close by inward ice growth.
Two adjacent open conduits in a debris band. The one near the top of the photograph is 0.1m in diameter. Both conduits were open to a depth of approximately 2 m from the ice surface. The conduits may indicate crevasse closure in poly- thermal ice or flow of supercooled water into fractures with gradual closure by ice growth.

Methods
To test whether the ice of laminated, silt-rich debris bands is composed of “young” ice (post-1952) or “old” ice (pre-1952), samples of the debris bands and the surrounding ice were collected and tested for their 3H content.3H concentrations in precipitation were typically less than 25 TU (where 1TU =1 3 Hatom per 1018 1 H atoms) prior to 1952 when thermonuclear bomb testing began. Testing released anthropogenic 3H into the atmosphere (Reference LibbyLibby, 1955; Reference Gat, Fritz and FontesGat, 1980) at thousands of TU above the background level (Reference Leventhal and LibbyLeventhal and Libby, 1970). Because the estimated age of the englacial ice zone at Matanuska Glacier’s terminus is greater than 150 years, snow from which it metamorphosed would contain background 3H levels (<2 TU; Reference Strasser, Lawson, Larson, Evenson and AlleyStrasser and others, 1996).
Ice frozen from post-1952 water should contain elevated 3H concentrations. Water discharging from the subglacial conduits at the margin of the overdeepening contains 3H approximately equal to that of precipitation today (7-8 TU; Reference Strasser, Lawson, Larson, Evenson and AlleyStrasser and others, 1996). Ice of the stratified basal ice facies similarly contains higher quantities of 3H, but in varying amounts, and it is hypothesized that the 3H-rich ice originates by subglacial accretion (e.g. Reference Strasser, Lawson, Larson, Evenson and AlleyStrasser and others, 1996; Reference Lawson and HunterLawson and others, 1996, 1998).
If laminated debris bands are similarly formed, we anticipate 3H concentrations similar to the stratified facies (6.3-17.5 TU; Reference Strasser, Lawson, Larson, Evenson and AlleyStrasser and others, 1996). Ice-surface velocities of approximately 70 m a—1 have been measured within the ice-marginal overdeepening (Reference Ensminger, Evenson, Alley, Larson, Lawson, Strasser, Mickelson and AttigEnsminger and others, in press). Based on these flow velocities and the distance from the ice margin to the up-glacier limit of the overdeepening, the 3H values of any debris bands formed therein and up to about 3.4 km up-glacier of it should be similar to 3H values of modern waters. The stable isotopes δ18O and δD are similarly anticipated to reflect modern meteoric and meltwater sources (e.g. Reference Lawson and KullaLawson and Kulla, 1978).
Samples for a preliminary study of ice composition were collected during late August, 1996. Four different laminated bands located within the overdeepening (star symbol, Fig. 2) near the ice margin were sampled, as well as the clean, bubbly englacial ice adjacent to those debris bands. The clean, clear diffused facies ice of the englacial zone (Reference LawsonLawson, 1979b) adjacent to one of the debris bands was also sampled. Another of the debris bands split in two near the top of an ice ridge and samples were collected from both limbs, as well as from the clean englacial ice in between. A total of five samples was collected from laminated debris bands, and 10 samples were collected from the diffused facies of the englacial zone, including the one sample from the clear englacial ice.
Ice samples were collected from nearly vertical faces located meters to tens of meters above the stratified basal ice. Samples were collected after the top few centimeters of ice were chipped away to remove any superimposed component (Reference Lawson and KullaLawson and Kulla, 1978). After melting, a volume of 30 mL was subsampled for stable isotope analysis and a volume of 60 mL was subsampled for unenriched 3H analysis. Subsamples for debris content and sediment grain-size analyses were also collected. Sediment grain-size distributions were compared with those of different ice and water types described by Lawson (1979b).
Electrolytic enrichment and scintillation counting techniques (Reference KesslerKessler, 1988) were used to analyze samples for 3H content at the low-level H laboratory at Michigan State University. The analytical detection limit is 1 TU with a precision of ±1 TU. Coastal Scientific Laboratories, Austin, Texas, analyzed the δ18O and δD samples with reported accuracies of ±0.3%o for δ18O and ±5.0%o for δD. The isotopic values of laminated debris bands were later compared to well-established englacial and basal ice values (cf. Reference Lawson and KullaLawson and Kulla, 1978; Reference Strasser, Lawson, Larson, Evenson and AlleyStrasser and others, 1996).
Results
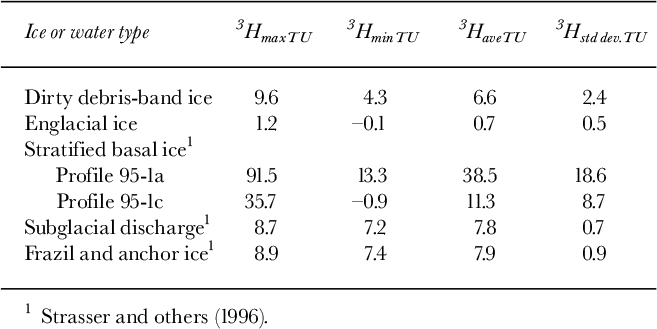
The laminated debris bands have elevated 3H concentrations relative to those of the clean englacial ice. The average 3H concentration is 6.6 TU in the debris bands, whereas it is < 1 TU in englacial ice (Table 1). t tests yield t = 4.91, and thus there is statistical evidence that the mean 3H compositions represent different populations at the 99% significance level. Isotopic fractionation of 3H during freezing is theoretically less than 4% and is therefore insignificant compared to natural variations of 3H concentrations in precipitation or subglacial discharge (Reference Strasser, Lawson, Larson, Evenson and AlleyStrasser and others, 1996). H data in this study have not been corrected to a reference date to account for the radioactive decay of 3H (t1/2 — 12.26 years), but the uncorrected values still compare favorably to established values of the basal ice and subglacially discharged waters (Table 1; Reference Strasser, Lawson, Larson, Evenson and AlleyStrasser and others, 1996). These data suggest that the laminated debris bands are sourced by modern waters. The 3H values of debris bands are less than half the recorded value of 26 TU for ground water (Reference Strasser, Lawson, Larson, Evenson and AlleyStrasser and others, 1996; Reference Lawson, Strasser, Evenson, Alley, Larson and ArconeLawson and others, 1998). This suggests debris- band construction is likely to occur during the melt season, rather than the winter when ground-water dominates the glacier’s basal hydrologic system.
Maximum, minimum, and average 3H values (TU) of dirty ice from within laminated debris bands and their surrounding englacial ice compared to different ice and water types at Matanuska Glacier.
Stable isotope values of the laminated debris bands are similar to the heavier englacial ice values and lighter subglacial ice values (Table 2) reported by Reference Lawson and KullaLawson and Kulla (1978), Reference Lawson, Strasser, Evenson, Alley, Larson and ArconeLawson and others (1998). Debris bands have δ18O values nearly identical to those of the subglacial discharge and frazil and anchor ice (Table 2) reported by Reference Strasser, Lawson, Larson, Evenson and AlleyStrasser and others (1996) and Reference Lawson, Strasser, Evenson, Alley, Larson and ArconeLawson and others (1998).
Maximum, minimum, and average stable-isotope values of dirty ice from within laminated debris bands and their surrounding englacial ice compared to different ice and water types at Matanuska Glacier.
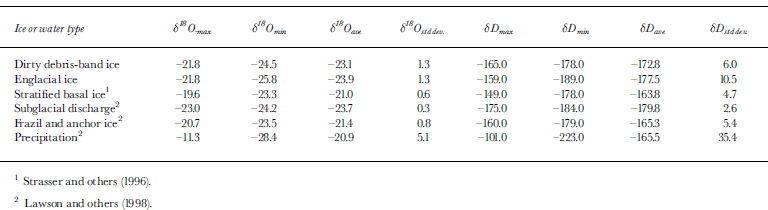
Less negative δ18O values in the laminae than those of the englacial ice and the lack of air bubbles in debris-band ice would suggest a possible accretionary origin (Reference Gow, Epstein and SheehyGow and others, 1979). However, the stable isotopes indicate that the ice of the laminated debris bands is forming within a closed water system. The δD values of debris bands are heavier than that of the subglacial discharge, but are nearly identical to values reported for frazil and anchor ice (Reference Strasser, Lawson, Larson, Evenson and AlleyStrasser and others, 1996). Two-tailed t tests yield t = 1.12 and 0.99 for δ180 and δD, respectively. Stable-isotopic measurements on the debris-band ice do not differentiate it from englacial, basal, or frazil ice with high confidence, although possible differences suggest that further study will be valuable.
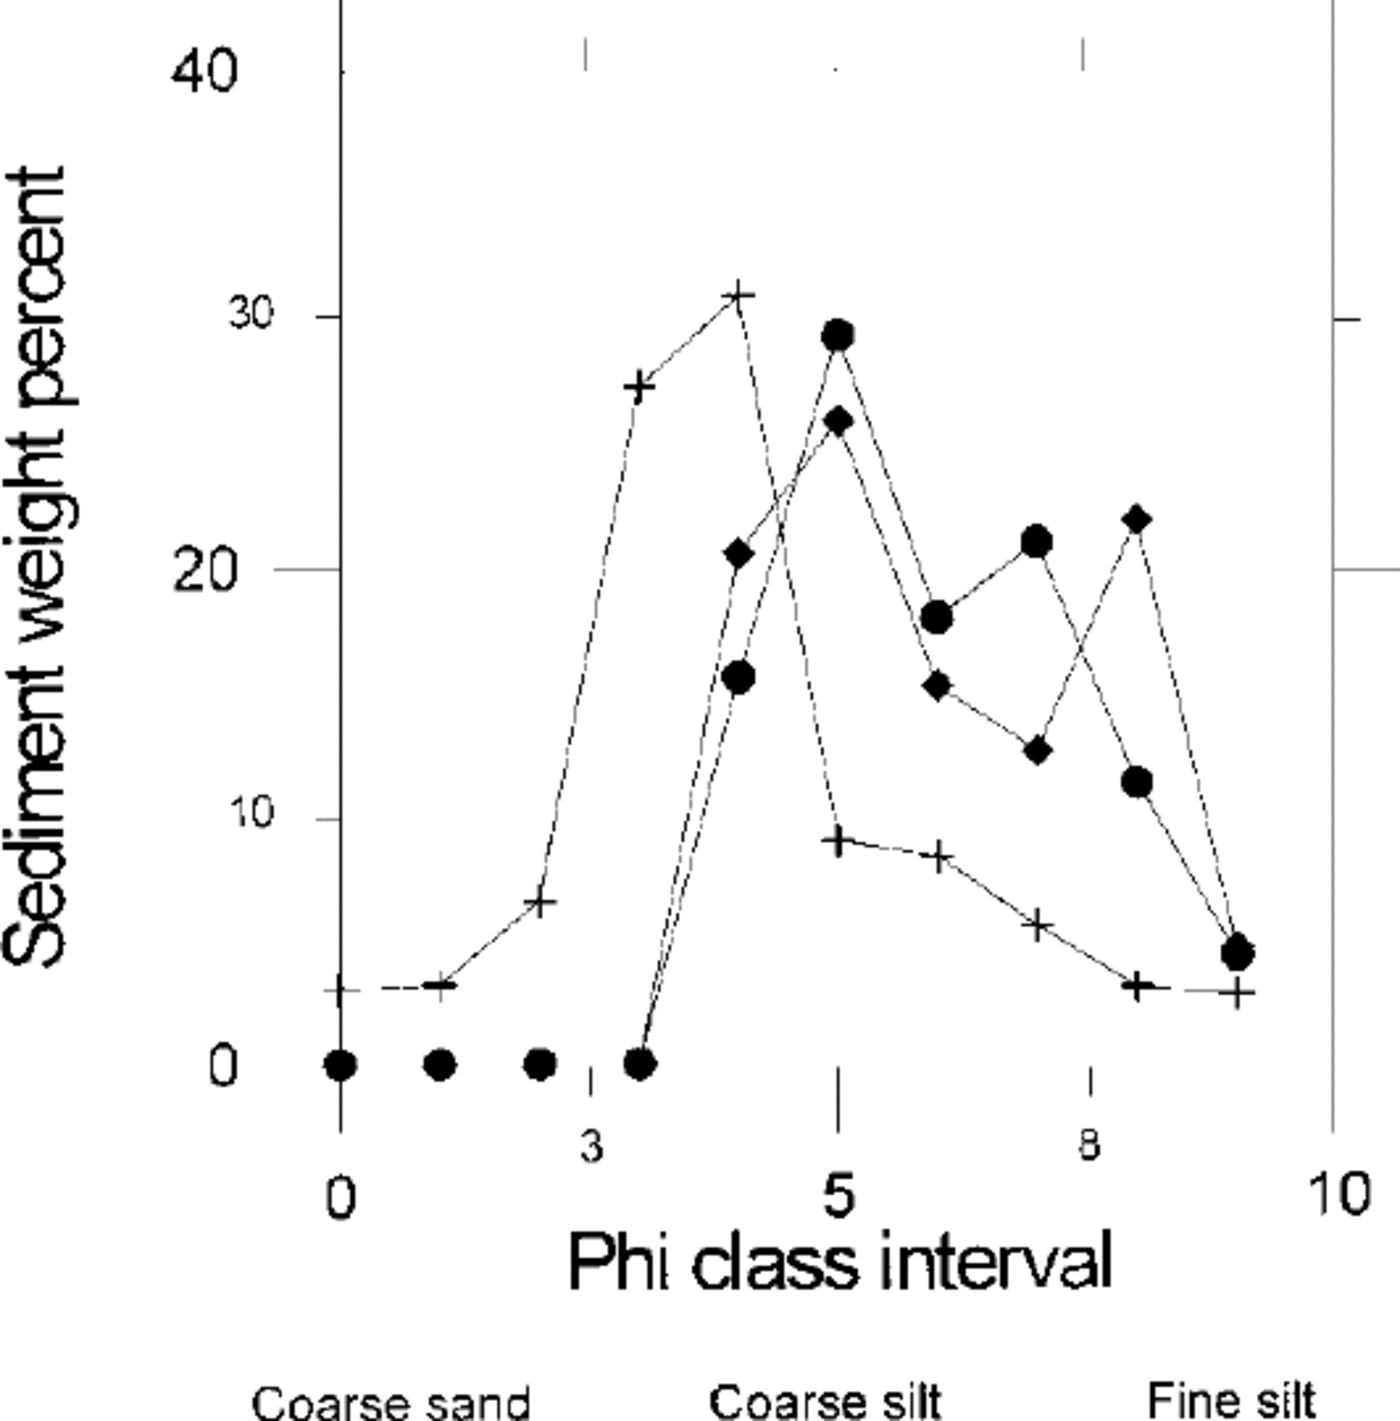
The average grain size of the sediment found within the debris band ice was 5? (coarse silt) and well sorted (σ— 1.54?, Fig. 7). This distribution closely resembles the average grain size of the suspended load of Matanuska Glacier’s subglacial discharge (Reference LawsonLawson, 1993).The grain-size distribution of the dirty ice in laminated debris bands does not at all resemble the supraglacial debris described by Reference LawsonLawson (1979b). Therefore, we hypothesize that the debris consists of only the fine fraction of subglacial sediments like that which is incorporated into the stratified basal ice (Reference LawsonLawson, 1979b). Previously proposed mechanisms of debris-band genesis suggest that the debris component should resemble either supraglacial or basal debris, including its coarse fraction.
Grain-size distribution of the dirty ice within laminated debris bands showing fine-grained and well-sorted sediments.
Discussion
Analytical data and field observations at Matanuska Glacier require an alternative to existing theories of debris-band formation. We propose that basal fractures open with strongly extensional flow (such as over an icefall or within the deepest part of an overdeepening). As ice flows out of the overdeepened basin, high basal water pressure may force dirty subglacial water into the englacial zone along the fractures or crevasses (Reference WeertmanWeertman, 1973; Reference HolmlundHolmlund, 1988; Reference Lawson and HunterLawson and Hunter, 1996). Reference Mickelson and BerksonMickelson and Berkson (1974) described a somewhat similar ice-bed process as a mechanism of basal- till entrainment.
In a glaciohydraulically-supercooled area of the drainage system, like the western terminus region of Matanuska Glacier, frazil ice may nucleate on and grow inward from the crevasse walls. Healing occurs as the fracture closes, trapping and concentrating sediment within the otherwise clean englacial ice. Ablation of the ice surface exposes the debris bands as they may be formed in either blind or open fractures. Continued ice flow and deformation give the laminated debris bands a “shear-plane” appearance. Repeated opening and closing of a fracture may be the mechanism by which the laminations form. However, there is no direct evidence yet to support this hypothesis.
The preliminary results of 3H levels and debris grain-size distribution support our hypothesis that the laminated, silt- rich debris bands form by a previously undescribed ice-bed process. We have not observed any laminated debris bands that contain coarse-grained sediment. Based on measured ice surface flow velocities in one of the overdeepened basins, the debris bands within and down-glacier of the icefall should contain elevated levels of 3H, which they do. The stable isotope data do not irrefutably support the proposed glaciohydraulic origin. Additional, more detailed sampling is required to conclusively prove our hypothesis.
Conclusions
Existing theories of debris-band origins do not adequately explain the characteristics of the prominent, laminated debris bands in Matanuska Glacier’s terminus region. Field observations have led us to formulate a new hypothesis of origin. We propose that this type of debris band forms in glaciohydraulically supercooled areas of a drainage system as the result of a previously undescribed ice-bed process involving basal fracturing or crevassing. As a preliminary test of our hypothesis, four laminated debris bands and their surrounding ice were analyzed in 1996 for their 3H concentrations, δ18O and δD contents, and debris grain-size distributions. The results of our preliminary study generally support glaciohydraulic supercooling and ice growth in basal fractures as the origin for the laminated, silt-rich debris bands.
Acknowledgements
The authors wish to thank the Cold Regions Research and Engineering Laboratory and U.S. National Science Foundation (grant DACA89-95-K-0007) for financial support. We would like to thank B. Stevenson and K. Stevenson of Glacier Park Resort, Alaska for their logistical support, without whose help this project would not have been possible or such an enjoyable experience. Students of Lehigh University, Pennsylvania, Augustana College, Illinois and Glacier View High School, Alaska provided field assistance. We thank B. Hubbard and an anonymous reviewer whose comments improved this manuscript.



