Today, the Big Five (Goldberg et al., Reference Goldberg, Goldberg and Goldberg1981) or its related five-factor model (FFM; McCrae & Costa, Reference McCrae and Costa1997) is one of the most prominent and widely accepted models of personality, which structures personality traits into five broad dimensions or traits denominated Openness to experience, Conscientiousness, Extraversion, Agreeableness and emotional Stability.
Numerous previous studies have validated FFM in a range of populations and countries (Allik & McCrae, Reference Allik, McCrae, McCrae and Allik2002), demonstrating that its factorial structure and psychometric properties are consistent across cultures and languages (McCrae & Costa, Reference McCrae, Costa, John, Robins and Pervin2008; Smederevac et al., Reference Smederevac, Mitrović, Sadiković, Riemann, Bratko, Prinz and Budimlija2020).
One major initial assumption of FFM was that dimensions were conceptually independent from each other. Later, it was proposed that these dimensions were rather associated and formed even broader super-factors, given that the rating scales or questionnaire scales from different Big-Five dimensions correlated with one another, therefore suggesting that they pointed to higher-level factors (Digman, Reference Digman1997).
Specifically, scholars found that Agreeableness, Conscientiousness, and emotional Stability formed one higher-order factor labelled Alpha (α), while Extraversion and Openness to Experience formed a second higher-order factor labelled Beta (β) (Digman, Reference Digman1997). DeYoung and colleagues (Reference DeYoung, Peterson and Higgins2002) further interpreted these higher-order factors, and named them Stability (super-factor α) and Plasticity (super-factor β). They speculated that Stability represented the individual’s disposition to comply with the normative rules and expectations of society, while in contrast Plasticity represented the disposition toward self-enhancement and the achievement of status and power. In other words, one could deduce that Stability stimulates conformity, while Plasticity does not stimulate conformity. However, the view that Alpha and Beta are substantive constructs at a higher order than the Big Five has been often challenged. Some authors argued that Alpha and Beta second-order factors might reflect artefactual (socially desirable response tendencies) rather than substantive factors (McCrae & Costa, Reference McCrae, Costa, John, Robins and Pervin2008).
More recently, Musek (Reference Musek2007) has suggested that if the scholars agreed on the Alpha/Stability and Beta/Plasticity second-order factors, obtained when oblique rather than orthogonal dimensions rotation is used, one could also postulate a third-order general higher factor occupying the apex in the organization of personality in a way similar to g, the general factor involved in the organization of cognitive abilities. The hypothesis on the existence of a General Factor of Personality (GFP) at the apex of a hierarchical structure of personality has determined an increasing body of research exploring its properties by several validation samples and different FFM-based personality measures (Rushton & Irwing, Reference Rushton and Irwing2009; Riemann & Kandler, Reference Riemann and Kandler2010; van der Linden et al., Reference van der Linden, Schermer, de Zeeuw, Dunkel, Pekaar, Bakker, Vernon and Petrides2018). Following Musek (Reference Musek2007), Rushton et al. (Reference Rushton, Bons and Hur2008) proposed that GFP exists, and exists for evolutionary reasons (therefore with a substantial degree of non-additive genetic determination), having emerged during human evolution because of social selection of humans who tolerate one another and behave cooperatively in an effective way in social groups. Consistently, the leading current interpretation of GFP is that it represents a general factor of social effectiveness, which reflects the individual’s disposition to be socially effective and advantaged, with higher levels of emotional intelligence or, on the opposite extreme, the individual’s disposition to be disadvantaged, emotionally instable and more likely to suffer or develop a personality disorder (Rushton & Irwing, Reference Rushton and Irwing2009; van der Linden et al., Reference van der Linden, Dunkel, Beaver and Louwen2015).
However, the GFP is a controversial construct that provokes numerous criticisms, which should also not be ignored (Revelle & Wilt, Reference Revelle and Wilt2013). One challenge to the status of the GFP as a valid substantive construct originates from the observation that the personality indicators of the GFP are all oriented in the socially desirable direction (Anusic et al., Reference Anusic, Schimmack, Pinkus and Lockwood2009; Ashton et al., Reference Ashton, Lee, Goldberg and de Vries2009; Bäckström et al., Reference Bäckström, Björklund and Larsson2009), suggesting that the common source of variance might be method-biased variance rather than trait variance. By the way, it should be noted that such criticism might be psychometrically, but not evolutionarily informed, given that a growing body of literature supports the observation that socially desirable verbal behavior is highly correlated to socially desirable nonverbal behavior (e.g., Fleming, Reference Fleming2012), which is at the base of the evolutionary explanation of the GFP existence.
Another interpretation is that the GFP above the Big Five model is an artefact caused by the high level inter-correlations among personality facets (which underlie the Big Five) (Ashton et al., Reference Ashton, Lee, Goldberg and de Vries2009). Moreover, the application of the multitrait-multimethod (MTMM) analysis in combination with modern structural equation modelling in twin studies did not support a general factor of personality (Riemann & Kandler, Reference Riemann and Kandler2010).
In the last decades, an extensive body of behavioral genetic research mainly based on twin studies was conducted to describe the genetic and environmental architecture of personality as theorized by the FFM. In general, these studies showed that genetic factors typically explain about 45–50% of phenotypic variance in personality traits measured by self-report questionnaires, with the rest explained by non-shared environmental factors (Riemann & Kandler, Reference Riemann and Kandler2010; Tucker-Drob et al., Reference Tucker-Drob, Briley, Engelhardt, Mann and Harden2016); shared environmental effects were mostly non-significant.
Concerning Alpha and Beta second-order factors, they have been alternatively interpreted as substantive heritable components of personality (Jang et al., Reference Jang, Livesley, Ando, Yamagata, Suzuki, Angleitner, Ostendorf, Riemann and Spinath2006) or as artefacts of evaluative bias with smaller heritability estimates (Riemann & Kandler, Reference Riemann and Kandler2010) or as components affected by both heritable and evaluative artefacts influences (McCrae et al., Reference McCrae, Yamagata, Jang, Riemann, Ando, Ono, Angleitner and Spinath2008).
The behavioral genetic research on the GFP yielded more numerous results, mostly proving the heritability of GFP and its substantial genetic features (Figueredo et al., Reference Figueredo, Vásquez, Brumbach and Schneider2004; Loehlin & Martin, Reference Loehlin and Martin2011; Rushton et al., Reference Rushton, Bons and Hur2008, Reference Rushton, Bons, Ando, Hur, Irwing, Vernon, Petrides and Barbaranelli2009; van der Linden et al., Reference van der Linden, Schermer, de Zeeuw, Dunkel, Pekaar, Bakker, Vernon and Petrides2018; Veselka, Schermer, Petrides, Cherkas, et al., Reference Veselka, Schermer, Petrides, Cherkas, Spector and Vernon2009;Veselka, Schermer, Petrides, & Vernon, Reference Veselka, Schermer, Petrides and Vernon2009). Rushton et al. (Reference Rushton, Bons and Hur2008), using two samples of 575 pairs of 2- to 9-year-old Korean twins and 322 pairs of 18- to 75-year-old English twins, respectively, concluded that GFP is a broad heritable factor and has an early age of onset with 50% of the variance attributable to non-additive genetic influence and 50% to unique, non-shared environmental influence. Figueredo and Rushton (Reference Figueredo and Rushton2009) deduced that the GFP may have been shaped by evolutionary selective processes, and this conclusion was based on the finding that a considerable proportion (50%) of the genetic variance in the GFP was non-additive. Other authors also found a proportion of the variance in the GFP attributable to non-additive genetic influence, but not so marked, so they suspended judgment on what the GFP really was until new evidence (Loehlin & Martin, Reference Loehlin and Martin2011).
To our knowledge, no previous research explored the genetic and environmental structure of both FFM dimensions and higher-order factors in a single twin study, except for just one study, which examined whether personality and subjective well-being (SWB) shared a common genetic structure (Weiss et al., Reference Weiss, Bates and Luciano2008). In that study, the authors found evidence for a single genetic higher-order factor contributing to variance in all five personality domains and to subjective well-being, which resulted genetically indistinct from personality traits, especially those reflecting emotional Stability (low Neuroticism), high Extraversion, and high Conscientiousness.
The present study aims to estimate genetic and environmental influences on the Big Five dimensions of personality and related second- and third-order factors, as assessed by a short adjective-based measure of the FFM of personality, the Short Adjectives Checklist of Big Five (SACBIF; Perugini & Leone, Reference Perugini and Leone1996), using a population-based sample of adult twins. Because support for the super factors, while compelling, is not unequivocal or settled, we primarily confirmed their structure both phenotypically and genetically using a confirmatory factor analysis. Then, we investigated the extent to which phenotypic correlations among the SACBIF dimensions and between Alpha and Beta super-factors are attributable to common genetic and/or environmental effects.
Method
Sample
This study used data from assessments conducted on a population-based sample of adult twins (see Tarnoki et al., Reference Tarnoki, Baracchini, Tarnoki, Lucatelli, Boatta, Zini, Fanelli, Molnar, Meneghetti, Stazi, Medda, Cotichini, Nisticò, Fagnani, Osztovits, Jermendy, Preda, Gabor, Metneki and Schillaci2012, for full details). Briefly, twins aged 18+, previously enrolled in the Italian Twin Register (ITR, Medda et al., Reference Medda, Toccaceli, Fagnani, Nisticò, Brescianini, Salemi, Ferri, D’Ippolito, Alviti, Arnofi and Stazi2019) and resident in the cities of Perugia, Rome or Padua, were contacted by mail and were invited to participate in the study. Out of 348 invited twins, 320 (92%) gave their consent to undergo clinical examination and to fill out psychological questionnaires, and 314 twins were considered for the analyses after exclusion criteria were applied; these criteria included pregnancy, severe cardiovascular diseases and pair unmatching. Participants underwent clinical and instrumental evaluations at the local university hospital, and also completed a self-report assessment of Big Five. Prior to the study, all participants (N = 314) signed a consent form and were informed on study procedures and aims. All twins at enrolment in the ITR filled out a questionnaire about physical similarity and how frequently they were confused by family members and strangers during childhood (Goldsmith & Rothbart, Reference Goldsmith, Rothbart, Strelau and Angleitner1991). Twin zygosity was assigned using an algorithm based on the responses given by each pair. About seventy percent of the participant twins also donated a saliva sample, and zygosity of 78 same-sex twin pairs was assigned using a set of nine tetranucleotide markers plus amelogenin for sex determination.
Psychological Measures
Assessment Tools
Personality traits were assessed by using 25 adjectives drawn from the Short Adjectives Checklist to measure Big Five (SACBIF; Perugini & Leone, Reference Perugini and Leone1996). Subjects answered to each adjective by rating themselves on each of them using a seven-point Likert scale, ranging from 0 (not at all) to 6 (absolutely). Reliabilities computed with McDonald omega were: .80 (Extraversion), .74 (emotional Stability), .77 (Openness to experience), .70 (Agreeableness), .70 (Conscientiousness).
Analytical Approach
Factor Analysis
We conducted a confirmatory factor analysis with the Mplus software (Muthén & Muthén, Reference Muthén and Muthén1998–2017) by using the observed scores on Agreeableness, emotional Stability and Conscientiousness as indicators of the Alpha factor, with Extraversion and Openness to experience posited as indicators of the Beta factor. According to the international standards (Schweizer, Reference Schweizer2010), the model showed a good fit to the data, χ 2(4) = 5.66, p = .14; CFI = .99; TLI = .98; RMSEA = .037, 95% CI [< .001, .10]. Completely standardized loadings on Alpha ranged from .69 (emotional Stability) to .76 (Agreeableness and Conscientiousness) with a mean of .74 (SD = .03). Completely standardized loadings on Beta were .91 (Extraversion) and .59 (Openness to experience). Alpha and Beta resulted moderately correlated (.55).
At this point, we specified an additional higher-order factor, loaded by Alpha and Beta, representing the GFP factor, by restricting the loadings Alpha and Beta to equality (their completely standardized loadings were thus both about .74). This model was statistically equivalent to the previous one and thus resulted in an identical fit. Finally, using this model we estimated individuals’ factor scores on Alpha, Beta and GFP, and used them in all subsequent analyses.
Sample Characteristics
Socio-demographic characteristics of the sample were described by means and standard deviations or by percentages when appropriate, using the Stata software (Release 16) (StataCorp, 2019). The final sample consisted of 314 apparently healthy twins.
Correlations
Correlation coefficients were estimated separately for Big Five and higher-order factors by the method of maximum likelihood using saturated models in the Mx program (Neale et al., Reference Neale, Boker, Xie and Maes2006), and considering age and sex as covariates.
At the individual-level analysis, phenotypic correlations were estimated to explore the strength of the relationship among the Big Five personality traits as well as between Alpha and Beta super-factors. When considering twin pairs, cross-twin/within-trait correlations (i.e., between twin and cotwin for the same trait) were calculated to assess monozygotic (MZ) and dizygotic (DZ) twin similarity. The twin design is based on the observation that MZ twins share their entire DNA and DZ twins share on average half of their DNA; therefore, a higher phenotypic similarity in MZ versus DZ twins indicates a genetic influence on the trait of interest, under the assumption that environmental factors relevant to the trait are shared by MZ and DZ twins to the same extent (‘Equal Environments Assumption’) (Neale & Cardon, Reference Neale and Cardon1992). To evaluate the sources of covariance of the studied phenotypes, cross-twin/cross-trait correlations (i.e., between one trait in a twin and another trait in the cotwin) were estimated separately for MZ and DZ twins; a higher such correlation in MZ compared to DZ twins points to genetic effects shared by the traits.
Genetic Modelling
Two separate multivariate genetic models (Cholesky decomposition models) were used to investigate the genetic and environmental sources of variance and covariance for the Big Five dimensions as well as for the Alpha and Beta super-factors, while only standardized variance components were estimated for GFP (single factor at the apex of the pyramidal model of personality).
Multivariate genetic models for multiple dimensions decompose the variance of each dimension and the covariance among them into additive genetic (A), either shared environmental (C) or non-additive genetic (D), and unshared (individual-specific) environmental (E) components. The A component represents the additive effects of all gene variants (i.e., alleles) that influence the trait, without interactive effects; the D component represents interactions between alleles at the same fixed chromosomal site (i.e., locus) (“dominance”) or at different loci (“epistasis”); C represents the effects of environmental factors that are shared by the twins within the family – particularly during childhood and adolescence (e.g., rearing environment, family socio-economic status, parental behaviors, etc.) – or that are shared in the womb (e.g., hormonal exposures); E represents the effects of environmental factors that are unique to an individual (e.g., lifestyles, relations with peers, infections, etc.), including measurement error (Neale & Cardon, Reference Neale and Cardon1992). These models also provide genetic and environmental correlations, which indicate to what extent two traits are likely to share the same genes or environmental effects. In both univariate and multivariate analysis, the AE and DE sub-models were tested against the full ADE model, and the best-fitting solution was selected on the basis of the lowest Akaike’s information criterion (AIC) value.
Models incorporating age and sex as covariates were applied by the method of maximum likelihood using the Mx program (Neale et al., Reference Neale, Boker, Xie and Maes2006).
Results
Sample Characteristics
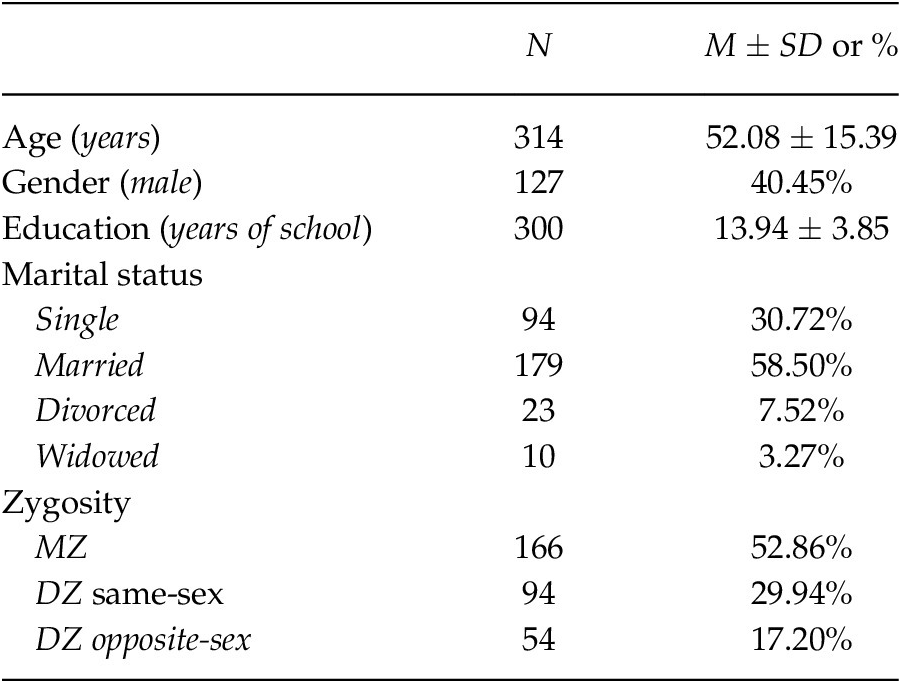
The basic characteristics of the study sample are summarized in Table 1. The mean age of subjects was 52 years, with 40% of them being males. The subjects accomplished 14 years of school on average, corresponding to the last stage of high school in the Italian educational system; about 60% of them were married, while one-third reported to be single. As regards zygosity distribution, MZ and DZ twins were almost equally represented, with a slight unbalance towards the MZ group.
Socio-Demographic Characteristics of the Twin Sample

Note. MZ = monozygotic; DZ = dizygotic; SD = standard deviation.
Correlations
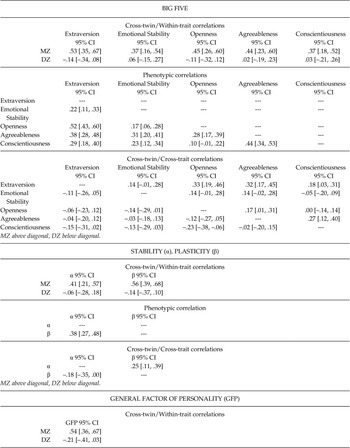
Table 2 shows the correlational structure of data, separately for the Big Five dimensions and higher-order factors.
Correlational Structure of Data

Note. MZ = monozygotic; DZ = dizygotic. All estimates are adjusted by age and sex.
For the big five dimensions, within-pair correlations in MZ twins were all significant and ranged from .37 (Stability and Conscientiousness) to .53 (Extraversion). These correlations largely exceeded the corresponding DZ estimates, which were all not significant and of low magnitude. The Big Five dimensions were in general moderately inter-correlated, with the highest phenotypic correlations observed for Extraversion and Openness (.52), for Agreeableness and Conscientiousness (.44), and for Extraversion and Agreeableness (.38). The lowest phenotypic correlation was that between Openness and Conscientiousness (.10), which was the only non-significant estimate. Cross-twin/cross-trait correlations in MZ pairs were in most cases substantially higher than those in DZ pairs. This was particularly true for the Big Five dimensions (mentioned above) with the highest phenotypic correlations; for these dimensions, confidence intervals of MZ and DZ estimates were also generally not overlapping.
A similar correlational pattern was observed for Alpha and Beta, with a cross-twin/within-trait and a cross-twin/cross-trait correlation in MZ pairs much higher than in DZ pairs, and a substantial phenotypic correlation between them.
As regards GFP, cross-twin/within-trait correlations in MZ and DZ pairs paralleled the estimates for the Big Five dimensions.
Genetic Modelling
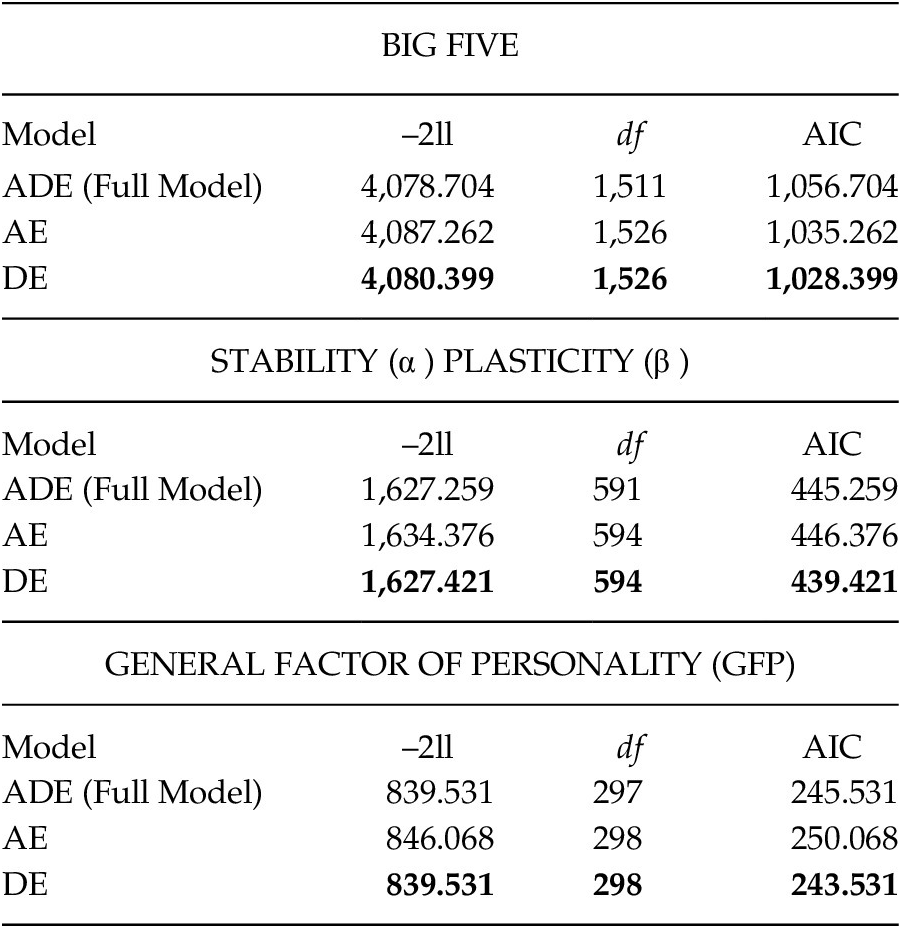
Model comparisons showed that, for the Big Five dimensions and higher-order factors, the most parsimonious model that best fitted the data was the one incorporating non-additive genetic and unshared environmental components, in line with MZ correlations largely exceeding DZ correlations (Table 3).
Model Comparisons

Note. A = additive genetic component; D = non-additive genetic component; E = unshared environmental component; –2ll = –2loglikelihood; df = degrees of freedom; AIC = Akaike Information Criterion (–2ll–2df)
Best-fitting models are denoted in boldface type.
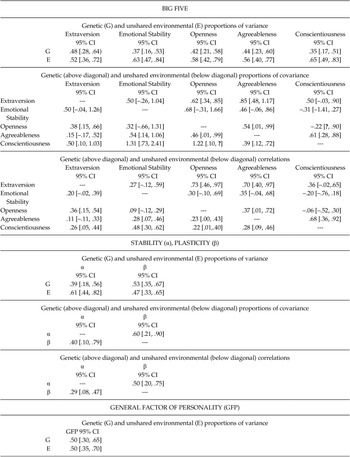
Under this model, heritability estimates for the Big Five dimensions ranged from .35 (Conscientiousness) to .48 (Extraversion), thus leaving 52% to 65% of the variance in the dimensions to individual-specific environments (Table 4). Genetic factors resulted to play a substantial role also in the covariance among the dimensions, with significant bivariate heritability estimates (i.e., genetic proportion of total covariance) for Extraversion and Openness (.62), for Agreeableness and Conscientiousness (.61), and for Extraversion and Agreeableness (.85). These dimensions appeared to share many of the same genes, as indicated by genetic correlations of about .70.
Genetic and Environmental Architecture under Best-Fitting Models

Note. Genetic estimates refer to non-additive effects under DE models. ? = estimation problems for the confidence limit. All estimates are adjusted by age and sex. The order in which the Big Five factors and the α and β super-factors are shown in table exactly matches the order in which the variables were entered in the Cholesky decompositions
Heritabilities of Alpha and Beta were .39 and .53 respectively, with genetic effects explaining 60% of their covariance, and overlapping to a moderate and significant extent (.50).
For GFP, genetic and environmental influences equally contributed to the total variance.
Discussion
In the current study, we used data on 314 adult Italian twins to examine the genetic and environmental underpinnings of the Big Five personality traits as measured by the SACBIF.
Our twin sample showed a MZ:DZ ratio of around 1:1, which is unbalanced as compared to the 1:2 ratio observed in the general population (Aston et al., Reference Aston, Peterson and Carrell2008). This situation is consistent with the fact that, although twin cohorts in the Italian Twin Registry (ITR) are identified by applying a population-based strategy within local municipalities (Medda et al., Reference Medda, Toccaceli, Fagnani, Nisticò, Brescianini, Salemi, Ferri, D’Ippolito, Alviti, Arnofi and Stazi2019), subjects’ participation in ITR studies still relies on a strong voluntary basis, and it has been previously reported that MZ twins are likely to be over-represented in volunteer samples (Kanazawa et al., Reference Kanazawa, Segal and de Meza2018; Rushton et al., Reference Rushton, Bons and Hur2008). In this respect, it may also be interesting to highlight that a MZ:DZ ratio close to 1:1 may even have, in some cases, beneficial effects on statistical power in the context of twin analyses (Visscher, Reference Visscher2004). Phenotypic correlations among dimensions revealed many significant inter-connections. Specifically, each dimension correlated positively with each other, except for Conscientiousness vs. Openness, which had a non-significant correlation. Previous studies assessing the five dimensions have reported some degree of phenotypic correlation among them (Lo et al., Reference Lo, Hinds, Tung, Franz, Fan, Wang, Smeland, Schork, Holland, Kauppi, Sanyal, Escott-Price, Smith, O’Donovan, Stefansson, Bjornsdottir, Thorgeirsson, Stefansson, McEvoy, Dale and Chen2017; McCrae & Costa, Reference McCrae, Costa, John, Robins and Pervin2008; Power & Plusses, Reference Power and Pluess2015). Besides, these results help to better establish the SACBIF place within the framework of the Big Five model.
The findings of vanishing within-pair correlations in DZ pairs indicate the substantial lack of shared environment contribution across any trait and suggest that personality traits are influenced by unique environmental experiences that act to make siblings different from one another. A large body of literature is highly consistent in indicating individual differences in personality as attributable to contributions of genes and unshared environments, with minimal contributions from the shared environment (Bouchard & Loehlin, Reference Bouchard and Loehlin2001; Briley & Tucker-Drob, Reference Briley and Tucker-Drob2014), although its influence might act in moderating (enhancing and diminishing) the impact of both genetic and environmental factors on personality, in specific circumstances (e.g., unusually high levels of conflict in family) in a developmental phase of personality (Krueger et al., Reference Krueger, South, Johnson and Iacono2008). Our correlation findings denoting little or no influence of familial shared environment, in a sample of individuals with a mean age over 50, appeared to be consistent with a large body of literature which suggests decreased influence of familial (genetic and shared environmental) influences on personality following emerging adulthood (Briley & Tucker-Drob, Reference Briley and Tucker-Drob2014).
Cross-twin/cross-trait correlation patterns were consistent with phenotypic correlations, and provided further insights into the genetic structure, suggesting shared genetic factors contributing to the observed interplay.
Results of multivariate modelling showed moderate to substantial non-additive genetic influence on the five dimensions, explaining 35 (Conscientiousness) to 48% (Extraversion) of total variance in the dimensions. Unshared environmental effects accounted for the majority of variance in all dimensions, ranging from 52 (Extraversion) to 65% (Conscientiousness). The shared environmental component was not tested because the correlation pattern indicated that this component was negligible for each of the Big Five traits. These estimates are comparable to those of various previous studies on Big Five personality traits, which showed that heritable components explain 40–60% of the variance, and shared environmental influences are negligible (Johnson et al., Reference Johnson, Vernon, Feiler, Boyle, Matthews and Saklofske2008; Vukasović & Bratko, Reference Vukasović and Bratko2015). Also, our findings are in keeping with other studies that detected non-additive genetic influences for the Big Five traits (Verweij et al., Reference Verweij, Mosing, Ullén and Madison2016) and other personality traits (Keller et al., Reference Keller, Coventry, Heath and Martin2005).
Multivariate models yielded some interesting findings on the sources of phenotypic correlations among the five dimensions. The phenotypic correlations between Extraversion and Openness, Extraversion and Agreeableness, Openness and Agreeableness, and Agreeableness and Conscientiousness were primarily due to shared genetic factors, with the greatest genetic overlap between Openness and Extraversion. It is likely that Openness and Extraversion overlap because they derive from similar underlying self-evaluation core processes, for example, self-enhancement or self-worth tendencies. Accordingly, the correlations between Openness and Extraversion measures in non-behavioral genetic studies typically exceed .30 (van der Linden et al., Reference van der Linden, te Nijenhuis and Bakker2010; it should be noted that correlations between facets of the same traits are typically around .60). Moreover, the substantial bivariate heritability observed between Openness and Extraversion suggests the involvement of a higher-order genetic factor such as Digman’s (Reference Digman1997) Beta (defined by the E and O domains). To our opinion, these results are also consistent with a study that used common pathways models to examine the common genetic and environmental effects of facets within each domain (Briley & Tucker-Drob, Reference Briley and Tucker-Drob2012). That study showed that the common pathways model fitted best for both Extraversion and Openness, providing evidence that these two dimensions captured all of the common variance of their own facets; in other words, common genetic and environmental effects of their facets acted in a more uniform manner than the common effects of Agreeableness, Conscientiousness, and Stability facets.
To our knowledge, only few previous studies tested for the genetic overlap among the Big Five personality traits (Jang et al., Reference Jang, Livesley, Riemann, Vernon, Hu, Angleitner, Ando, Ono and Hamer2001). For example, Jang and colleagues’ study (Reference Jang, Livesley, Riemann, Vernon, Hu, Angleitner, Ando, Ono and Hamer2001), which only focused on the domains of Neuroticism (the reverse of Stability) and Agreeableness, showed a substantial genetic correlation between these domains, explained in part, in the authors’ opinion, by variations in the serotonin transporter gene. In the last decade, several molecular genetic studies attempted to identify genetic variants associated with each of the five dimensions of personality; however, research on the genetic overlap among traits is still lacking, except for a study (Power & Plusses, Reference Power and Pluess2015), which suggested, not consistently with our findings, that Neuroticism and Openness to experiences may share a substantial portion of their heritability based on common genetic variants.
Our findings also showed that common unshared environmental factors contributed, though with lower magnitudes compared to genetic factors, to the correlations between Extraversion and Conscientiousness, Stability and Agreeableness, Stability and Conscientiousness, and Openness and Conscientiousness and, to a lesser extent, between Openness and Extraversion and between Agreeableness and Conscientiousness. These findings suggest that the observed interplay among the traits may be mediated by overlapping unshared environmental factors in addition to common genetic effects. As regards the genetic and environmental correlations between Openness and Extraversion and between Agreeableness and Conscientiousness, findings suggested that the genetic overlap among these personality traits might be larger than the unshared environmental overlap.
Findings from behavioral genetic analyses of higher-order constructs revealed that individual differences in the Alpha and Beta SACBIF super-factors were also attributable to non-additive genetic and unshared environmental factors. In this regard, super-factors behaved like other measures of personality in univariate behavioral genetic investigations (Jang et al., Reference Jang, Livesley, Ando, Yamagata, Suzuki, Angleitner, Ostendorf, Riemann and Spinath2006). Quite consistently with the Jang’s study (Reference Jang, Livesley, Ando, Yamagata, Suzuki, Angleitner, Ostendorf, Riemann and Spinath2006), which used the Revised NEO Personality Inventory (NEO-PI-R), our findings suggested that Alpha and Beta were moderately heritable, with genetic effects explaining 39% and 53% of the variance, respectively.
Similarly to Jang’s findings, the co-variation of Alpha and Beta is substantially genetic in origin. In fact, bivariate analysis for Alpha and Beta factors showed 50% common genetic factors explaining 60% of their covariance.
It should be noted, however, that, as previously touched upon, other authors argued that these factors might reflect artefacts of evaluative bias, with smaller heritability estimates, rather than substantive factors (Riemann & Kandler, Reference Riemann and Kandler2010). Our study does not allow testing for this potential bias. In any case, McCrae & Costa (Reference McCrae, Costa, John, Robins and Pervin2008), who used artefact multimethod (response tendencies) models on twin data to examine if these higher-order factors reflected a tendency to present oneself in a positive way rather than substance, found that artefact models fitted the data better than the substantive factor models, but at the same time they also remarked that models including both artefacts and substance fitted even better. Based on our findings, looking at the heritability indices, the non-additive genetic proportion of variance of Alpha was not especially marked (.39) as would be expected from a stable evolutionary-based and heritable super-factor. Since Alpha and Beta super-factors appear to reflect metatraits with a moderate non-additive contribution, we consider that the DeYoung’s interpretation of them (DeYoung et al., Reference DeYoung, Peterson and Higgins2002) as more basic predispositions (indeed re-labelled as Stability and Plasticity in place of Digman’s [1997] provisional labels Alpha and Beta, because Stability and Plasticity seemed to better describe the basic evolutionary-based patterns of behavior indicated by α and β) might be embraceable but with moderate confidence, at least as regards Stability, given that its genetic variance was not especially marked by the non-additivity expected from evolutionary selective processes.
With regard to GFP, our findings replicated previous studies in showing that individual differences were attributable to genetic and unshared environmental components (Figueredo & Rushton, Reference Figueredo and Rushton2009; Figueredo et al., Reference Figueredo, Vásquez, Brumbach and Schneider2004; Loehlin & Martin, Reference Loehlin and Martin2011; Rushton et al., Reference Rushton, Bons and Hur2008, Reference Rushton, Bons, Ando, Hur, Irwing, Vernon, Petrides and Barbaranelli2009; van der Linden et al., Reference van der Linden, Schermer, de Zeeuw, Dunkel, Pekaar, Bakker, Vernon and Petrides2018; Veselka, Schermer, Petrides, Cherkas, et al., Reference Veselka, Schermer, Petrides, Cherkas, Spector and Vernon2009; Veselka, Schermer, Petrides, & Vernon, Reference Veselka, Schermer, Petrides and Vernon2009), which in our sample accounted for equal portions of variance.
Therefore, we were able to extract a substantially heritable component from the data, consistently with previous behavioral genetic studies on this general factor, which estimated the GFP heritability at approximately 50%, or more (Figueredo & Rushton, Reference Figueredo and Rushton2009; Figueredo et al., Reference Figueredo, Vásquez, Brumbach and Schneider2004; Loehlin & Martin, Reference Loehlin and Martin2011; Rushton et al., Reference Rushton, Bons and Hur2008, Reference Rushton, Bons, Ando, Hur, Irwing, Vernon, Petrides and Barbaranelli2009; van der Linden et al., Reference van der Linden, Schermer, de Zeeuw, Dunkel, Pekaar, Bakker, Vernon and Petrides2018; Veselka, Schermer, Petrides, Cherkas, et al., Reference Veselka, Schermer, Petrides, Cherkas, Spector and Vernon2009; Veselka, Schermer, Petrides, & Vernon, Reference Veselka, Schermer, Petrides and Vernon2009). Moreover, our findings on the non-additive genetic component of GFP replicated those reported by other authors who used FFM scales (Figueredo & Rushton, Reference Figueredo and Rushton2009; Loehlin & Martin, Reference Loehlin and Martin2011; Rushton et al., Reference Rushton, Bons and Hur2008, Reference Rushton, Bons, Ando, Hur, Irwing, Vernon, Petrides and Barbaranelli2009; van der Linden et al., Reference van der Linden, Schermer, de Zeeuw, Dunkel, Pekaar, Bakker, Vernon and Petrides2018) or other personality scales (e.g., Bouchard & McGue, Reference Bouchard and McGue2003; Hur, Reference Hur2007; Johnson et al., Reference Johnson, Vernon, Feiler, Boyle, Matthews and Saklofske2008; Penke et al., Reference Penke, Denissen and Miller2007), although they partially deviated from some of them in the amount of explained variance. Smaller or less marked amounts of non-additive genetic variance were found, in fact, by Figueredo and Rushton (Reference Figueredo and Rushton2009) (14%), and Loehlin and Martin (Reference Loehlin and Martin2011) (32%).
Overall, our findings contributed to the increasing body of literature that considers GFP under recent natural selection processes, which tend to reduce additive genetic variation faster than non-additive genetic variation (Fisher, Reference Fisher1954), and its background is in line with evolutionary selective pressure for cooperative and social effective behavior (Figueredo & Rushton Reference Figueredo and Rushton2009; Rushton et al., Reference Rushton, Bons and Hur2008; van der Linden et al., Reference van der Linden, Schermer, de Zeeuw, Dunkel, Pekaar, Bakker, Vernon and Petrides2018).
In other words, our findings seem to be consistent with the theoretical evolutionary explanation of natural selection for the GFP, which thus evolved in a context of effective social participation (Figueredo & Rushton, Reference Figueredo and Rushton2009; Figueredo et al., Reference Figueredo, Vásquez, Brumbach and Schneider2004; Rushton et al., Reference Rushton, Bons and Hur2008). Rushton and colleagues (Reference Rushton, Bons and Hur2008) were the first to postulate this interesting theoretical proposal regarding the GFP evolutionary and genetic origin. That is, individuals with high GFP may have more often been chosen as a partner, collaborator, or leader (Figueredo & Rushton, Reference Figueredo and Rushton2009; Figueredo et al., Reference Figueredo, Vásquez, Brumbach and Schneider2004; Rushton et al., Reference Rushton, Bons and Hur2008) and such selection would have contributed to greater reproductive success of these individuals, thus allowing evolutionary selective mechanisms to act on the GFP. The Rushton’s view of selection of individuals who possessed more cooperative and pro-social personalities extended the viewpoint of Darwin (Reference Darwin1871).
At the same time, we should recognize that, based on genetic theory, it is considered unlikely that genetic influences on a specific trait will be entirely non-additive in origin, and that additive effects will not be involved (Risch et al., Reference Risch, Herrell, Lehner, Liang, Eaves, Hoh, Griem, Kovacs, Ott and Merikangas2009). It has been suggested that the situation in which the A component can be dropped from the ADE model may be due to a relatively low power (Risch, Reference Risch2000). In the present study, the sample size was rather limited, but it was also clear that in the ADE model, the additive component had a negligible magnitude, which makes power issues an unlikely explanation.
It has also been proposed that variance of the additive effects may come incorporated into the interaction effects, and therefore, although dropping the A component is statistically allowed, this may not reflect the true etiological situation (Neale & Cardon, Reference Neale and Cardon2013). An additional point to bear in mind while interpreting the low DZ correlations and the subsequent biometric models is that distributional issues may play a role when bounded outcomes such as Likert scales are analyzed. In these cases, a beta-binomial distribution may apply to the data, but its implementation is not easy to handle, especially in the multivariate setting. Proper transformations of the scores may also be a remedy, but they would impact on results’ interpretation. Nevertheless, despite the above mentioned points of debate, at a minimum, it seems safe to conclude that, in our sample, genetic effects are likely to hold a relevant non-additive component.
Some study limitations should be mentioned. First, a limited sample size conferred reduced power for genetic model selection. In this respect, a common strategy is to report parameters’ estimates under the full models, with no sub-model comparisons; however, as stated above and consistently with the pattern of correlations, these models showed vanishing additive genetic effects, with genetic variance basically entirely due to non-additive (possibly epistatic) effects. It’s noteworthy that a gender-stratified correlation analysis in MZ and DZ pairs, though with random fluctuations due to a relatively low number of pairs in each category, generally suggested the same genetic structure (i.e., low additive genetic effects and high non-additive genetic effects) in men and women; however, further studies on larger twin samples are needed to test for gender differences in the gene-environment architecture of Big Five dimensions and related super-factors. Furthermore, while our study was underpowered to test for moderate heritability (200 twin pairs would be needed to estimate a heritability of around 40% with a power of .80), our sample size conferred more than 80% power to estimate phenotypic correlations of moderate to substantial magnitude (around .30 and higher) such as those observed among most of the targeted psychological measures. Second, the study sample had a large age range with an average over 50. Though our findings are generally in line with previous studies, it should be noted that many examples of research in personality found evidence for age differences in the sources of variation, with genetic effects increasing with age and shared environmental effects typically decreasing (Briley & Tucker-Drob, Reference Briley and Tucker-Drob2012).
Third, the SACBIF is a relatively short measure of the Big Five personality traits, and therefore, it does not qualify as a high-quality measure of the Big Five personality traits and facets; however, in the present study some evidence emerged that it behaved like other measures of personality used in previous relevant studies, which provides support to its construct validity.
Fourth, the study is based on a self-reported evaluation; therefore, the genetic structure, compared to the environmental structure, provides more credible information on the true personality.
The current study extends previous research on the genetic and environmental structure of both FFM dimensions and their super-factors, presenting an additional result and providing some new insights into the underlying genetic architecture of personality. Specifically, we found that Big Five personality traits are moderately heritable, with some of them being closely genetically related to each other. Consistently, Alpha and Beta super-factors were also found to have a substantial genetic correlation.