Introduction
Many different elements make up the strength of a president, but a president with a majority in both houses of Congress works from a position of power. While a congressional majority does not guarantee that a president can pass his agenda (witness Jimmy Carter and the first two years of the Clinton presidency), a president that has majority in Congress will have natural allies instead of natural enemies when he works to enact his legislative agenda.
The importance of a congressional majority is clearly not lost on presidents themselves, as they have come to campaign extensively for congressional candidates from their own party. It is not clear, however, whether presidential campaigning can do much to help candidates. For many, a presidential visit will be superfluous. For either the wellestablished incumbent or the sacrificial lamb running against such an incumbent, a presidential campaign visit is probably useless. But for those locked in a competitive, hard-fought race, can a visit from the president make a difference?
This issue of presidential impact is subject to much commentary and speculation in the news media. In the usual case, the speculation is a mix of the positive and negative, with presidents earning marks more for effort than for result. But 2002 is a case of consensus: the president was highly effective in helping the election efforts of his partisans in Congress.
The New York Times account on the morning after the election is typical.
The Times wrote on page 1:
The result was a huge lift for Mr. Bush, who spent much of the past two weeks campaigning across the nation on behalf of Republican candidates for the House, the Senate and for governor. At the time, Democrats said that Mr. Bush was gambling his prestige on the outcome of the race. That was one bet that the president clearly appeared to have won last night (New York Times, November 6, 2002).
The
Washington Post offered a similar assessment on the following day:
There was plenty of evidence that Bush's popularity was a crucial, if not decisive, factor on Tuesday. Of the 23 House members for whom he campaigned, 21 were victorious or leading yesterday. Of the 16 Senate candidates he aided, 12 won or were leading. (His record for gubernatorial candidates, whose jobs are less directly tied to Bush, was 11 of 22.) (Washington Post, November 7, 2002)
Other news sources were more exuberant in claiming that the outcome was “historic” and that George W. Bush was personally responsible for it. Echoing the chairman of the Republican Congressional Campaign committee, (“We made history tonight…. It was a great win for the president of the United States” (New York Times November 6, 2002)), numerous news sources ran with the story that 2002 represented an historic breakthrough, the first time since 1934 that the party of the White House had gained seats in a first midterm election.1
Political scientists would have noticed that restricting the comparison to “first midterm” elections was strangely irrelevant. Otherwise the stories would have been left to say “This hasn't happened since…the last occasion on which a midterm election was held (1998).”
And George W. Bush was credited for the historic success of the Republican Party.
Even top Democrats seemed to agree. “I'm not sure what we did wrong,” Democratic National Committee Chairman Terence McAuliffe said in a television interview. “We faced a very popular president who campaigned more than any other president.” “The White House took a huge gamble; they rolled the dice, and it worked,” said Tony Coelho, who was Al Gore's 2000 campaign chairman (Washington Post, November 7, 2002).
If the media accounts are to be believed, the Bush campaign of 2002 is a high point of presidential influence in congressional elections. That makes it an interesting case for analysis. From this one case we cannot learn whether less influential attempts mattered or not. But if this claimed high water mark is not very high, then we cannot be confident that lesser successes have ever mattered at all. Thus we assess how well Bush did in securing his Republican majorities and, more generally, the likely effect of all presidents on midterm outcomes.
We ask, as directly as we can, how much difference did Bush's campaign visits have?2
Note our limited focus on direct campaign activities. Other actions, such as recruiting attractive candidates and helping them raise funds might have influenced the outcome. These are beyond our analysis.
And we ask it in several ways, for it turns out to be a more difficult question than the quick media consensus suggests. Here, we examine whether the empirical evidence tells the same story as the anecdotes. Along the way we will have to ask how presidential influence on elections should be assessed. And asking that question as political scientists will lead us down a different path from the election night analysis of journalists.
We begin with an outline of the races Bush visited, providing a description of the races that merited presidential intervention. We then test whether presidential visits had any impact on the outcome of the election.
The Visits
Presidents sometimes put their personal standing on the line and campaign for their partisans. And sometimes they sit quietly by and let events take their course. The Bush White House chose to use the president's standing—largely a residue of public support gained for decisive action against terrorism after the incidents of September 11th—for Republican gain. With party control of both houses of Congress in doubt going into the election season, the Bush political team decided to use—i.e., risk—the president's standing to solidify the Republican position. Bush criss-crossed the country in Air Force One on behalf of Republican candidates and made the campaigns a George W. Bush personality contest. Having risked his personal standing by making the election something of a referendum on his presidency, Bush himself would be tarred with failure or hailed for success.
We ask were these visits effective, did they change outcomes from what they might have been? As a first task we searched the Lexis-Nexis archives and determined exactly which Republican candidates received a presidential visit.3
We searched for stories in which both the president's name and the candidate's name appear during the election season of Labor Day to Election Day. To ensure appropriate regional coverage, we searched only the Associated Press wire stories for each state. The 22 House races we locate by this method accord well with the press accounts of 23, the source for which may well have been the White House.
We found that Bush made two types of campaign stops. The first was to appear at Republican rallies intended to support the entire Republican ticket in the state or region. In visits of this type, candidates would be mentioned in the presidential address at the rally. These represent relatively small commitments of presidential time and effort. In the second type of visit, President Bush would bring the full apparatus of the presidency, appearing with the candidate in the district and making an explicit endorsement. It is the effect of this latter type of visit that we investigate.
To understand how the presidential effort influenced outcomes we need to understand something about which candidates and districts were chosen for this special presidential treatment. We begin with races for the House of Representatives.
First Cut Evidence: The House of Representatives
First, we cover the raw numbers. Of 435 House races, 354 had candidates from the two major parties. Bush made campaign visits to 22 of these 354 House races.4
Subsequent comparisons use the 354 districts where both parties fielded a candidate.
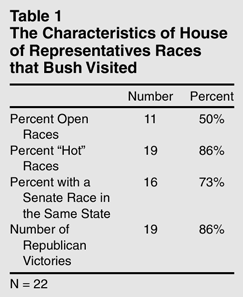
In
Table 1, we present some descriptive characteristics of the House races that Bush visited.
While one might imagine that races might have been chosen for convenience, to pay off personal debts, or for other reasons more or less unrelated to outcome, it is plain in studying these selections that they were clearly strategic. Bush's visits were clearly concentrated on competitive races. Half of the races were for the uncommon open seats and 86% were designated a “hot race” in advance of the Bush team decisions (spring 2002) by either Congressional Quarterly or the Cook Political Report. The influence of convenience can be seen in the slightly enhanced prospect of a visit in states that also featured a Senate race.
Most importantly, of the 22 districts that George W. Bush visited, 19 Republicans won. This frames the election night story: where Bush visited, Republicans usually won. The presidency looks like a priceless campaign resource in this telling.
Did George Bush personally change several outcomes so that instead of Republicans winning half of the races, they won 19 out of 22? To answer this question requires us to know more about how races were selected. By carefully selecting districts that his party would likely win in any case, a president, after all, could produce a near one hundred percent success rate.
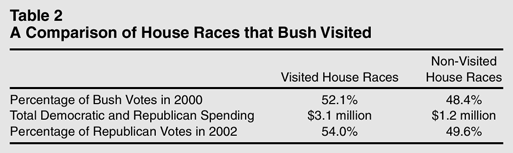
In Table 2, we compare the districts that received a presidential campaign visit to those that did not. The amount of spending in these races—double the average spent in other House races—is indicative of their competitive nature. These data clearly reveal why President Bush's efforts are credited with helping Republican candidates in 2002.
Now instead of examining the percentage of races the Republicans won, we can ask did Republicans who received presidential visits in 2002 do better than those who did not. By this standard the visits clearly helped. As evidenced in Table 2, the 22 beneficiaries did do better, by over four percentage points, than other Republican candidates.5
The comparison would not be so favorable if we included districts in which Republicans did not face Democratic contests. There is nothing like being unopposed for producing big victory margins.
But Table 2 also alerts us that the 22 visited districts are not quite a representative cross-section of the nation. The 22 visited districts were 2.4% (52.1% of the two-party vote) more favorable to George W. Bush in 2000 than his national showing (49.7%). Had the 2000 presidential election been contested in only these 22 districts, Bush would have registered a fairly decisive win. A 2.4% swing allocated evenly across states would have produced an Electoral College showing more on the order of George H. W. Bush's 1988 win—with early evening victory celebration—than the razor thin result and recount that did occur. Before we factor in the consequences of district selection, we turn to the Senate for a similar look at the numbers.
First Cut Evidence: The U.S. Senate
In 2002, 34 Senate seats were at stake, of which three were uncontested. Bush made at least one visit to 18 of the 31 contested Senate seats.
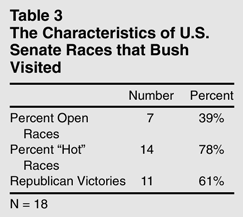
Table 3 describes the characteristics of the Senate races in which Bush became involved. Just as in the House races, Bush tended to visit races that were either open Senate seats or races that political observers thought were particularly competitive. And again, Republican candidates that Bush campaigned for tended to win. While the success rate here is not nearly as high as in the House, a majority of the candidates that Bush campaigned for won (11 of 18 Republican wins).
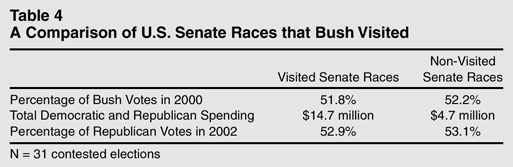
We compare the Senate races that received one or more Bush visits with those which did not in Table 4. Again, in Senate races where Bush visited campaign spending was substantial, with about three times as much spent in visited states as in non-visited contests. It is also worth noting that the Senate elections that Bush got involved in were again in states where he ran above his national average in the 2000 presidential election.6
Both those states visited and those not visited were unusually pro-Bush in 2000, a consequence of the fact that many of the states in which Al Gore had heavy majorities did not have Senate seats at stake in 2002.
The Bush team selected “hot” races, but they tended to be hot races with a Republican edge.
The data here suggest that Bush visited carefully selected races. He did not campaign for safe incumbents or for obvious losing causes. Bush appears to have visited races where the clout of the president could make a difference. By the standard of producing wins, Bush looks to have been an effective campaigner. But by our second standard, improving the Republican percentage margins over those races not visited, the evidence is trivial and in the wrong direction. Republicans running with presidential assistance did slightly worse (52.9% average margin) than those who lacked it (53.1%).
These simple benchmarks, although the basis for journalistic claims of Bush influence, clearly do not clinch the case. What they fail to capture is the net effect: how these candidates would have done without the president's involvement. To get at that we need to put aside the tools of first cut analysis and turn to thinking about how to measure presidential influence without bias. We now move on to that.
Modeling the Effect of a Presidential Visit
At the outset we need to think about how to model the outcome in order to observe the presidential effect and not some selection phenomenon. To do that we need to know not how well these visited candidates did, but how well they did relative to what would have been expected in lieu of a presidential visit. That requires us to know the seemingly impossible: how the candidates would have done if we could change history and eliminate the Bush visit.
But we can produce estimates of how well candidates were likely to do from information available before the Bush team decided which races to assist by campaign visits. Our general strategy is to produce an estimate of the pre-visit probable victory margin and then observe the difference between the expected and actual margin to observe the effect of presidential intervention.
To capture the expected outcome before presidential intervention in a campaign, we turn to the Cook Political Report. The August, 2002, edition features predictions of all House and Senate election outcomes. Set before the campaign and before presidential visits, this prognosis captures an expert view of likely outcomes—our best estimate of how things would have turned out in lieu of presidential involvement.
We do not get quite what we need, an exact prediction of final margin, from the Cook Report. Races instead are presented on a ordered scale of likely outcomes ranging between “solid” for one party through degrees of certainty down to “tossup.” Though a “solid” Republican race is easier to predict than a “toss up,” the scale is not precise enough for our needs.
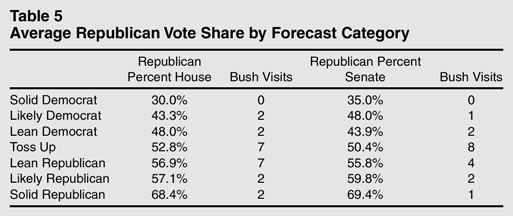
To quantify the Cook Report's competitive race scale, we assume that the Cook Report's classifications of the races are calibrated for an optimal prediction of real outcomes, and we then observe how each category of predicted outcome translated into actual margins of victory or defeat for all Republican candidates. That translation is given in Table 5, which shows the average Republican percentage of the vote share for each forecast category. Then we take those average outcomes as the best available point estimates of how each candidate should have done without intervention. That allows us to observe our ultimate dependent variable, actual vote margin minus expected margin.
Also in Table 5, we note the number of Bush campaign visits to the various types of districts. Again we see the pattern that visits do concentrate on the most contested districts, but have a GOP edge. In the House, for example, 11 visited districts were to varying degrees leaning Republican as compared to only four visits to leaning or likely Democratic districts. House districts receiving a visit had an expected Republican vote in August of 54.6% as opposed to 51.6% for those not visited. So doing better than average is an expected result of the visited districts because their August prospects were better than average.
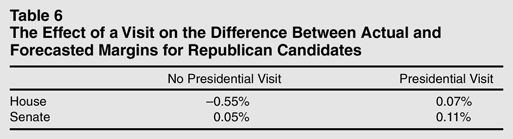
Now with this simple measure of outcome change we can propose yet another test of the Bush impact— whether the outcomes of those visited moved in the Republican direction, relative to those not visited. The answer in Table 6 is that they did not. The Cook predictions are quite accurate on average, leaving little net deviation to be explained.7
The one small anomaly is the strong Republican showing (52.8%) for the “tossup” category in the House. This picks up the late Republican surge that was evident on Election Day. But since it occurs for all Republicans, including the large number who did not receive campaign visits, it is not evidence for a presidential effect.
The House result, in which we have the most confidence due to sample size, shows that the net effect of a visit was in the wrong direction—those who received Bush help lost ground from August expectations, while others gained trivially. The small Senate sample shows both those visited and those not visited gained very minor increments, but with the latter performing better.
8 We do not report significance for these wrong signed results. But if we took seriously the wrong signed result, it would not be a reliable estimation.
This, however, cannot be our final conclusion, for we have yet to deal with selection issues. Perhaps the Bush team picked likely winners on which to invest the president's prestige, in which case we overestimate effects. Maybe even the reverse, with the president being more likely to aid candidates who were thought to be behind, thereby underestimating the effect. In either case we have to consider selection effects.
Selection Effects
Modeling the effect of a presidential visit, at first blush, would seem simple. One could, for example, regress the Republican vote share on a dummy indicator for a presidential visit along with a set of controls. However, such an approach ignores an underlying problem of selectivity. Presidential visits were not imposed randomly—Bush carefully chose certain races. We must, then, consider a model with selection effects.
The problem of selection effects, in general, is that we cannot assume ceteris paribus that those states or districts visited were alike in all respects to those not visited. The selection process is obviously far from the random assignment that we would need for confident inference. Thus, we turn to both Heckman selection models and propensity scores as solutions to the problem of selection.
Heckman Selection Models
The standard model for selectivity begins with Heckman (1979) and has been extended in a number of ways. One expansion of particular relevance, here, is in the area of treatment effects. Treatment effects represent exposure to conditions (e.g., district visit or not), which then, in conjunction with other factors, are presumed to affect outcomes.
Imagine for our case that we conceive Republican victory (or loss) margin as a function of how Republican the district is, how much effort was expended, and so forth. Call all those predictors X. Then, wishing to observe whether the presidential visit was effective on top of all those things, we entertain a model of the form:
In this setup the margin of victory is a function of
X (the normal predictors), with a parameter vector ß, and of our condition,
V=1 for districts with a presidential visit and
V=0 for those without. Then δ becomes our estimate of the visit effect. Or does it?
This is where selection matters. If the Bush team had drawn a set of districts randomly, then we could make a confident inference from this setup. But if selection reflected information about likely outcomes, as it surely did, then we cannot rule out that the selection might have generated a spurious treatment effect. The Bush team might have picked likely winners to spare presidential embarrassment, in which case the “treatment” would be a false reading of an effect. That is, likely winners would have won because they were likely winners, not because they received a visit. The result would be correlated errors due to the association of the selection factors with the variable being predicted.
This observation holds for estimates in any other setting where the assignment of the treatment is not random. The treatment effects model corrects for this. We do not go into a technical discussion here. However, the general structure of the solution is to proceed in two steps, first, modeling the probability of selection for treatment from what is known of the selection process and then modeling the dependent variable of interest using the first stage probability estimate to correct the correlated errors in the solution.9
The key difference between a treatment effects model and a classic Heckman model is that in a treatment effects model the treatment, here Vi is included as a covariate in the second stage regression, while in a Heckman model it would not be.
We briefly outline the specification of both the first stage (probit) selection model and the substantive regression model. The dependent variable is a comparison of how well a Republican candidate ran compared to our August forecast of that candidate's chances. The measure for presidential visits is a dummy variable with races receiving a visit scored “1.” To predict the outcome of the race, we use (in addition to the dummy) the percentage of votes Bush received in the 2000 election for each district or state, the amount of spending by the Republican candidate as reported to the F.E.C., and demographic controls.10
We have estimated models with and without the usual demographic data from the Census such as the percentage of the district or state that is urban, Black, Hispanic, collegeeducated, high school-educated, or its median income levels. Because the demographic variables uniformly fail to aid prediction we do not report them in the analysis below.
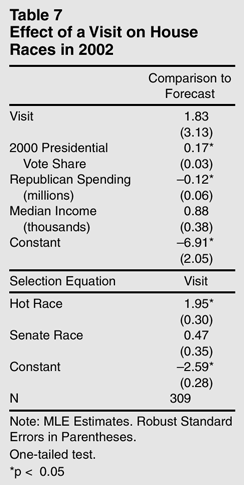
In the first stage (probit) selection model, the “visit” dummy variable becomes the dependent variable. To predict whether a district or state would receive a presidential visit, we first used two dummy variables—whether the race was open or not and whether either Congressional Quarterly or the Cook Political Report designated the race as “hot.” We also include the total combined spending of the Democratic and Republican candidates. For the House model, we include a dummy variable for whether there was a Senate race in that state. The results from the House model are reported in Table 7.
For Heckman models we need to evaluate both the selection model—determinants of the Bush decision to visit a state or district—and the second stage treatment effect—did the visit matter. The selection model for House race visits is driven by one variable—whether or not it was a hot race. To a lesser extent it appears that having a Senate race in the state was important for determining whether Bush visited a House district in the state.
The finding of substantive importance, however, is the treatment effect, which is none. The visit “treatment” is insignificant.11
Here we get an estimate of a positive visit effect, yet it is not statistically significant.
The second stage result is driven in large part by how well the president did in that district in 2000 and, to a much lesser extent, the amount of Republican spending in that race. So the effect of a presidential visit is marginal compared to the district's partisan leanings. The result, it would appear, is that Republicans for whom Bush campaigned did well because they were running in districts that were somewhat more Republican than average.
12 We also investigated the possibility that Republican spending and a visit were endogenous. In the propensity score framework it was easier to integrate a two-stage least squares estimation of the model to test for this possibility. However, such a parameterization did nothing to change the effects of a visit on our dependent variable.
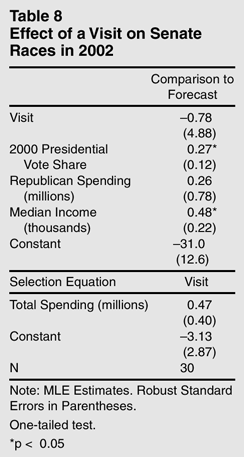
Senate elections (See Table 8) provide a second, but less robust test of the effect. The specification of the selection model, here, is limited to a single variable, because the open seat and hot race dummies are nearly perfectly collinear with the visit dependent variable. The spending variable, however, provides a well fitting probit model, correctly discriminating between visits and non-visits for 25 of 30 races, and thus we are confident that it still provides a correction for selection effects.
The key finding, from the treatment model, is again no finding. The visit “treatment” is estimated to have had an effect of trivial size in the wrong direction. Senate races with presidential involvement were worse for Republicans than without involvement, but the estimate is again insignificant. Despite a much smaller N, the pattern for Senate races fits that of the House analysis— namely, the visit variable is insignificant in the face of controlling for presidential vote share.
The conclusion that we draw here is that Bush was either fortunate or very strategic. Many of the close races occurred in states or districts that had strong natural inclinations to support him. Bush, by and large, ended up visiting races where the inclination to support a Republican candidate was higher than the national average.
Keeping score, we now see that Bush visits were effective by two first cut standards and were not by two more sophisticated analyses. To settle whether there was a Bush effect in 2002, we turn to propensity score analysis.
Propensity Scores
The treatment effects model is not the only means for correcting for non-random treatments. Propensity scores provide a second method for the correction of non-random treatments (Imai and van Dyk 2004). The propensity score method is similar in form to the treatment effects models that we used earlier. Again, we utilize a selection model that estimates the probability of whether a congressional district or state received a presidential visit. The predicted probability from this model then serves as a propensity score—the conditional probability of receiving a treatment—and is used to correct for the bias that occurs from non-random treatment effects.
Once the propensity score is estimated, the data are stratified into subgroups based on the score. The purpose here is to compare cases that are similar in all respects except for the administration of the treatment. Within the subgroups that have been stratified according to the propensity score, the outcome equation— the linear prediction of how well a Republican did compared to a forecast—is estimated. The propensity score itself is included as a covariate to further reduce bias in the second stage regression. One then reports the effect of the treatment within each subgroup as well as the average effect across all subgroups.
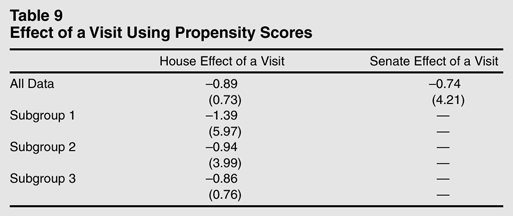
Given the limitations of our sample size, we stratified the data into three groups for the House and were unable to stratify the Senate data. Table 9 reports the effect of a presidential visit within the three House subgroups, as well as the average effect of a visit for all House and Senate races. Each cell in the table is the coefficient and standard error for the visit dummy variable. The second stage outcome regression had the same specification as our earlier models except for the inclusion of the propensity score.
The results from the propensity score analysis are similar to our previous analyses. Again we find that the effect of a visit is statistically indistinguishable from zero. What then is the truth? Did President Bush influence the 2002 outcome or not?