Introduction
Many species accumulate seeds in the soil. These seeds may survive for many years and germinate after a disturbance to form a new cohort of plants, thereby ensuring population persistence. The seeds of short-lived plants, among which many are weeds, often have the ability to bridge unsuitable periods and to germinate rapidly when disturbance creates a window in time suitable for recruitment (Harper, Reference Harper1977; Thompson et al., Reference Thompson, Bakker, Bekker and Hodgson1998; Baskin and Baskin, Reference Baskin and Baskin2001). In some species, for instance Papaver rhoeas, persistence in the seed bank is clearly the result of seed dormancy. The germination tendency of Papaver seeds cycles, as has been shown by taking seeds from the field to a suitable germination environment in the lab at different times of the year (Cirujeda et al., Reference Cirujeda, Recasens and Taberner2006). Other species require light for germination and seeds buried in the soil do not germinate. For a rather large group of species, however, it is mostly unknown which characters enable seeds to persist in the soil. Ripe seeds of Brassica species typically germinate 100% when placed under moist and warm conditions, even in complete darkness (Naeem et al., Reference Naeem, Liu, Raziuddin, Wan, Tang, Zhou and Gupta2009; but see Landbo and Jørgensen, Reference Landbo and Jørgensen1997). Yet many species in the Brassicaceae possess a long-term persistent seed bank (Tamis et al., Reference Tamis, van der Meijden, Runhaar, Bekker, Ozinga, Ode and Hoste2003) as is evident from the frequent occurrence of species like B. rapa, B. nigra and Sinapis arvensis along disturbed roadsides and on construction sites throughout western Europe, as well as from the occurrence of volunteers in B. napus crops. Without primary dormancy, what characters predispose species or genotypes to build up a long-term persistent seed bank in the soil?
This question is highly relevant for the environmental risk assessment (ERA) of genetically modified (GM) plants (EFSA, 2010). An ERA typically requires data on seed germination for a GM cultivar and its non-GM counterparts. Applicants need to argue whether a new GM cultivar is more or less likely to build up a long-term persistent seed bank in the soil.
Building up a persistent seed bank in the soil requires two things. First, seeds should forgo immediate germination. Mature non-dormant seeds may experience secondary dormancy after seed dispersal; that is, due to exposure to some environmental cue an initially non-dormant seed no longer germinates under conditions that were, at first, conducive for germination. Baskin and Baskin (Reference Baskin and Baskin2001) commented that they were unaware of any species whose initially non-dormant seeds were induced into dormancy. Adler et al. (Reference Adler, Wikler, Wyndham, Kinder and Schmitt1993) found that 4 weeks of cold stratification decreased subsequent germination of wild B. rapa seeds but not that of B. napus cultivars. This observation is in line with the assertion of Baskin and Baskin (Reference Baskin and Baskin2001) provided that the wild seeds have some primary dormancy and B. napus has not. Several authors (for instance, Pekrun et al., Reference Pekrun, Lutman and Baeumer1997, Gruber et al., Reference Gruber, Pekrun and Claupein2004; Schatzki et al., Reference Schatzki, Allam, Klöppel, Nagel, Börner and Möllers2013) showed that secondary dormancy can be induced in seeds of B. napus by keeping them in the dark for 2 weeks in a polyethylene glycol medium that imposes oxygen and water stress (osmotic potential of − 0.5 MPa, i.e. permanent wilting point). One can question, however, how often such stressful conditions occur in the agricultural field or in the fertile, disturbed habitats in which feral B. napus typically grows. Thus although it is certain that secondary dormancy can be induced under extreme conditions in seeds of B. napus, it is not known how often seeds are exposed to such conditions in the field and how efficient this mechanism is in preventing rapid germination. In our view, the role of secondary dormancy in soil seed-bank dynamics should not be taken for granted.
Delayed germination could also simply be due to suboptimal germination conditions. As pointed out by Thompson et al. (Reference Thompson, Cerlani, Bakker and Bekker2003) this should not be considered as dormancy, because seeds readily germinate when exposed to optimal conditions. Hence, the term dormancy is best reserved for those cases where seeds do not germinate upon transfer to optimal conditions. A higher temperature requirement for germination can also have the effect that fewer seeds germinate and remain in the seed bank.
Second, non-germinating seeds should be able to survive in the soil and resist the slow breakdown of the seed coat by micro-organisms and predation by micro-arthropods and earthworms. Gardarin et al. (Reference Gardarin, Durr, Mannino, Busset and Colbach2010) buried seeds of 13 weed species at a depth of 30 cm in the soil and examined survival over 2 years. Survival was positively correlated with thickness of the seed coat, and this character explained 52% of the variation in seed survival. Hendry et al. (Reference Hendry, Thompson, Edwards and Thorpe1994) compared 80 species of the British flora and found a positive correlation between the concentration of phenols and seed survival. They emphasized that phenols defend against microbes and predation, especially under relatively moist conditions. In a review of the subject, Wagner and Mitschunas (Reference Wagner and Mitschunas2008) concluded that fungicide treatment typically increases seed survival in the soil. Effects of glucosinolates, i.e. defence compounds mainly found in the Brassicaceae, on seed survival in the soil have not been studied. Yet glucosinolates could well have an effect. Concentrations in seeds are much higher than in the rest of the plant (Clossais-Besnard and Larher, Reference Clossais-Besnard and Larher1991) and Brassica crops are being used for biofumigation, which greatly reduces populations of soil arthropods and fungi (Kirkegard et al., Reference Kirkegard, Sarwar, Wong, Mead, Howe and Newell2000).
In this study we compare the seed characteristics of 20 accessions of the crop oilseed rape (B. napus) with nine accessions of wild B. rapa. The 20 accessions of B. napus include modern cultivars, old cultivars and feral populations. We address the following questions. (1) In which aspects does the crop B. napus differ from the closely related wild species B. rapa? We expect that seed banks are more prevalent in the wild species because domestication selects for 100% germination. The same question applies when comparing different B. napus accessions: in feral populations selection may have favoured genotypes with a seed bank (Adler et al., Reference Adler, Wikler, Wyndham, Kinder and Schmitt1993). (2) Which seed characters are correlated with seed survival in the soil? We buried fresh seeds of all 29 accessions at depth 10 cm and measured survival after 1 year in two habitats. The measured characters included thickness of the seed coat, the content of aliphatic and indole glucosinolates in the seed, seed size and germination percentage at low temperatures (5–15°C). (3) Using a subset of accessions, we then ask whether seeds exhibit primary dormancy and whether exposure to the typical field conditions that seeds experience after ripening increases seed dormancy. (4) Finally, we ask whether B. rapa and B. napus differ in their germination percentage and rate of germination at a temperature range from 15 to 25°C. We expect that for the wild B. rapa more seeds enter the seed bank than for the crop B. napus and, if this is related to temperature, fewer seeds of B. rapa should germinate at cold temperatures than seeds of B. napus.
Materials and methods
Species description and collection
B. napus (AACC) is the allotetraploid hybrid of B. rapa (AA) and B. oleracaea (CC) (U, 1935). Morphologically, B. rapa and B. napus are very similar but can be distinguished using both flow cytometry and diagnostic characters (Luijten and de Jong, Reference Luijten and de Jong2010). Originally, cultivars of B. napus contained high concentrations of bitter-tasting glucosinolates (GS) and erucic acid. For this reason, modern cultivation mainly uses canola (Gulden et al., Reference Gulden, Warwick and Thomas2008), which has been selected to contain very low levels of erucic acid and aliphatic GS (especially progoitrin), while retaining indole GS. Large amounts of canola are imported in The Netherlands and other countries of the European Union, and some of the seeds are spilt during transport and/or harvesting of the oilseed crop. B. napus seeds may also be introduced in the environment via flower mixtures, birdseed and rodent food. Yet, feral populations of B. napus are uncommon in The Netherlands and are mainly located in highly disturbed sites near transhipping locations or canola crops (Luijten and de Jong, Reference Luijten and de Jong2010). B. rapa is a ruderal species commonly found along disturbed roadsides, especially in the west of The Netherlands (Luijten and de Jong, Reference Luijten and de Jong2010).
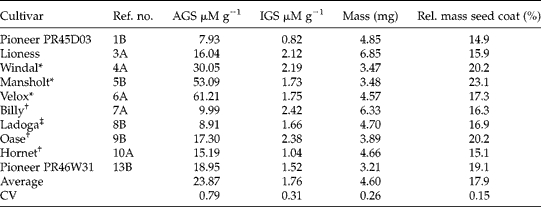
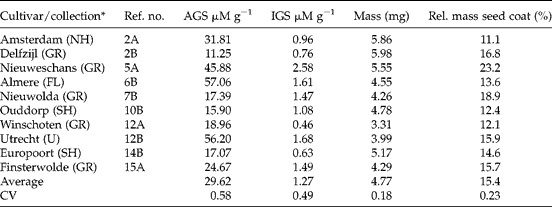
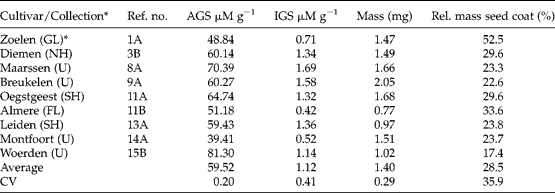
In this study we used seeds of 29 different Brassica accessions: ten cultivars of B. napus, ten feral B. napus populations and nine B. rapa populations. Seeds of modern cultivars were acquired from breeders (see Table 1), whereas seeds of old cultivars were obtained from the Centre for Genetic Resources in Wageningen, dating from 1899 (Mansholt's Hamburger), 1959 (Windal) and 1967 (Velox). Seeds of the Utrecht accession (Table 2) were collected from a population near the Cereol factory in Utrecht, which was operational from about 1900 to 2002, and specialized in importing and processing soy in its last decade of activity. It is thus likely that the Utrecht accession originates from a relatively old B. napus cultivar. The Almere population was located near a road construction site. Although B. napus may have been cropped near Almere in the past, at the time of seed collection no crop was located nearby. All other feral B. napus populations from which we collected seeds (Table 2) were located near crops or current transhipping locations. The B. rapa accessions (Table 3) were collected along roadsides across The Netherlands in the summer of 2009. All accessions were first grown for one generation in a common garden in Boskoop, starting in September 2009. In the garden, plants of each accession were grown in eight replicate 1 × 1 m plots that were placed in blocks. A buffer zone of 4 m separated blocks from one another, thereby minimizing outcrossing between different accessions flowering in 2010. We observed that the great majority of bee movements occurred within the 1 m2 plots, so it is likely that gene flow between accessions was limited. We checked this assumption by estimating the percentage of hybridization between B. rapa and B. napus. In particular, leaf material from a total of 130 individuals was analysed for chromosome number using flow cytometry. Although the species are known to hybridize easily (Anderson and de Vicente, Reference Anderson and de Vicente2010), we found only 3 hybrids in the 130 individuals examined, suggesting that gene flow between accessions does occur but is limited. Seeds were harvested in July 2010, dry stored at room temperature. Then in autumn 2011 these 1-year-old seeds were used for measurements of mass and glucosinolates (Tables 1–3) and a subset of eight accessions (1B, 5B, 10A, 13B, 5A, 10B, 12B and 15A in Tables 1 and 2) was used to examine the effect of temperature on germination rate.
Summary of the Brassica napus cultivars used and properties of the seeds (glucosinolate content, mass per seed and fraction dry mass in seed coat)

AGS, Aliphatic glucosinolates; IGS, indole glucosinolates; CV, coefficient of variation.
* Old cultivars obtained from the Centre for Genetic Resources in Wageningen.
† Cultivars from the German company Eurograss.
‡ Cultivar from Limagrain.
Summary of the feral Brassica napus accessions sampled in the field and properties of the seeds

AGS, Aliphatic glucosinolates; IGS, indole glucosinolates; CV, coefficient of variation.
* The province in The Netherlands is given in parentheses: FL, Flevoland; GR, Groningen; NH, North Holland; SH, South Holland; U, Utrecht.
Summary of the wild Brassica rapa accessions sampled in the wild and properties of the seeds

AGS, Aliphatic glucosinolates; IGS, indole glucosinolates; CV, coefficient of variation.
* The province in The Netherlands is given in parentheses: FL, Flevopolder; GL, Gelderland; NH, North Holland; SH, South Holland; U, Utrecht.
We measured the fresh mass of ten seeds in milligrams. Relative mass of the seed coat was determined by soaking ten seeds in water and then splitting them with a scalpel. After drying at 70°C, the mass of embryos and seed coats was determined separately. Percentage seed coat was calculated as: 100 × dry mass seed coat/(dry mass seed coat+dry mass embryo).
Indole and aliphatic glucosinolates (GS) were determined using high performance liquid chromatography (HPLC) by the Ecogenomics group at the University of Nijmegen (Professr N.M. van Dam) with sinigrin as a reference and extraction in 70% methanol (van Dam et al., Reference van Dam, Witjes and Svatos2004). Seeds contained no aromatic GS.
Temperature was manipulated using a thermogradient table manufactured by Flohr instruments (http://www.flohr-instruments.com). Thirty seeds were placed on Whatman 597 filter paper under every bell dome, thereby ensuring seeds made close contact with the table. Ten domes (8.5 × 8.5 cm with an 8-mm ventilation opening on top) were placed at approximately equal distances on the table, which was abundantly supplied with water throughout the experiment. Temperature was checked with a Eurolec thermometer that was adjusted with a flat metal sensor for improved contact. Over a period of 8 d germinated seeds were counted daily and removed from the table. The eight cultivars were placed simultaneously on the germination table (15–25°C) along with fresh seeds of a control (B. napus, collected in July 2011 from a crop grown in Goor, The Netherlands) that was also used in other experiments. This was repeated once, yielding two Petri dishes with in total 60 seeds per line for each temperature. The experiment was repeated in the same way with a gradient from 5 to 15°C. In other experiments reported in this paper we used fresh seeds.
Seed survival in the field
To establish experimental soil seed banks, 50 fresh seeds per accession (Tables 2 and 3) collected at various locations in The Netherlands in the summer of 2009, were mixed with 25 cm3 of local soil and enclosed within nylon mesh bags. For the cultivars (Table 1) we used seeds that were commercially available. Seeds of some cultivars (reference numbers 1B, 3A, 8B, 9B, 10A and 13B, Table 1) had a protective coating against fungal pathogens. The mesh size (0.5 mm2) of the seed bags was small enough for seeds not to get lost through water percolation or soil perturbation, but large enough for the smaller soil fauna to enter. For each accession, four seed bags were buried at 10 cm depth in September 2009 in two habitats (Boskoop and Swifterband). The fate of seeds was monitored by exhuming the seed bags after 1 year of burial, leading to a maximum number of 200 seeds per population per site at 100% retrieval efficacy. The outside of the seed bags was washed and cleaned of any soil or seeds, after which the content was washed on to sieves of different mesh sizes, thereby removing both coarse and fine soil material, roots and vegetative parts. The number of remaining seeds within each bag after 1 year in the soil was quantified. The viability of these seeds was tested by recording their germination ability after transferring them to moistened filter paper in Petri dishes placed in a growth cabinet providing 16 h light at 24°C. After 30 d the germination test was terminated and the seeds that did not germinate were scarred and placed at 28°C. Just a few seeds germinated at this second treatment, after which all non-germinating seeds were soft and could easily be squeezed. These seeds were clearly dead and decaying. The fraction survival in the field was calculated as the number of seedlings from bags brought to the lab after 1 year that germinated in Petri dishes divided by the number of seeds at the start of the experiment.
Primary dormancy
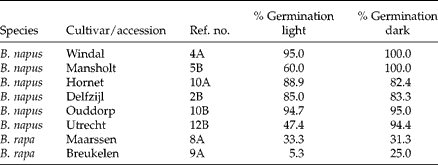
Before starting this experiment we tested whether darkness affected germination of 20 fresh seeds of six B. napus and two B. rapa accessions, and found that darkness had no inhibiting effect on % germination (Table 4, paired sample Wilcoxon test, P= 0.31). Based on this result, all germination experiments were carried out using fluorescent lighting. Primary dormancy was tested for three accessions: B. napus seeds originating from an agricultural field cropped with a cultivar of unknown origin in Goor (The Netherlands); B. rapa seeds collected at two different locations in Maarssen along the River Vecht, The Netherlands, at the same location as mentioned in Table 3. Fresh seeds were collected in July 2011 when fruits were fully ripe (brown), were kept at room temperature and then used for the primary and secondary dormancy experiments that started in October 2011. To see whether freshly collected seeds germinate under optimal conditions, seeds were placed in Petri dishes with abundant water at 28°C and 16 h fluorescent light. This constant temperature was chosen simply because it produced very high germination percentages for both Brassica species. In another study on primary germination of B. rapa (Lando and Jørgensen, Reference Landbo and Jørgensen1997) seeds were first exposed for 4 d at constant 20°C, then 3 d at 16 h 20°C/8 h 30°C and finally 4 d at 16 h 20°C/8 h 30°C with 0.2% KNO3. These authors emphasized that changing temperatures promoted germination, so our method could have underestimated the % germinating seeds under the most suitable conditions. We tested for viability by scarring the non-germinated seeds and returning them to favourable conditions for germination. All remaining non-germinating seeds were clearly dead at the end of the experiment, which was assessed by squeezing the seeds. For each accession we used three Petri dishes containing 20 seeds each.
Percentage germination* of eight selected cultivars under light and dark conditions at 20°C

* Germination of viable seeds, excluding the seeds that turned out to be dead after scarring and a second germination opportunity.
Secondary dormancy
We used the same fresh seeds (July 2011) as in the primary dormancy experiment and applied the treatments in October 2011. The following four treatments reflect the natural conditions seeds are exposed to in the soil during the summer to winter transition. After seed ripening in June and July, seeds are exposed to high summer temperatures, they then land on the ground amongst the vegetation. Seeds are gradually buried in the soil, after which they experience winter cold. In the first treatment, seeds were kept dry for 4 weeks at 30°C (heat treatment). In the second, seeds were kept for 4 weeks under moist conditions under a thick cover of green leaves in the field (shade treatment). In the third, seeds were kept for 4 weeks in complete darkness in the field under moist conditions (dark treatment). In the last treatment, seeds were kept for 4 weeks under moist conditions in a refrigerator (5°C). All seeds that were kept under moist conditions were treated afterwards with a 25% chlorine solution that effectively stopped fungal growth. Control seeds were stored in paper envelopes and kept in the lab for the same period of time. All seeds were then exposed to constant temperature ranging from 15 to 25°C on the thermogradient table under fluorescent light. Constant temperatures are the simplest way to quantify and compare germination behaviour of seeds but changing temperatures would also be possible and more natural. In each run we compared nine columns and these always included the three control columns with untreated seeds (B. napus, B. rapa Maarssen 1 and 2) and the remaining six columns with one specific treatment each. Results on average germination fraction of 30 seeds per dome were statistically analysed.
Comparative germination of B. napus and B. rapa
Germination of fresh seeds of B. napus and B. rapa was compared using the controls of the secondary dormancy experiment. However, we did not use the data from the controls belonging to the heat treatment, because germination was low in both treatment and control, probably due to water shortage. In total we pooled data from three temperature columns so that for each temperature, the germination fraction is based on three Petri dishes, yielding 90 seeds in total.
Statistics
We calculated Spearman rank correlations when variables were not normally distributed. In the secondary dormancy experiment we examined effects of treatment (tmt) of the seeds on % germination at different temperatures (T) and for two different accessions (ac). We used the procedure linear model lm (formula: %germ = T*tmt*ac) from the statistical package R (http://www.r-project.org/) to examine results, which generates a table of effects of the factors tmt and ac and of the covarariate T on the dependent variable % germination and of all interactions. When the interactions were not significant we ran the model again without the interactions and present the latter output. All residuals of these models fitted a normal distribution. Similarly, in the species comparison paragraph we tested for effect of ac and T on % germination in the linear model %germ = T*ac.
Results
Comparison of seed characters between species and accessions
Seeds of the old cultivars Windal, Mansholt and Velox typically had high levels of aliphatic GS (ranging from 30.05 to 61.21 μM g− 1) while the new cultivars had lower levels and a smaller range (between 7.93 and 18.95 μM g− 1, Table 1). This result was expected given the domestication history. There were no consistent differences between old and new cultivars in either indole GS or morphological seed characters. Five out of the ten feral B. napus accessions had higher aliphatic GS concentrations than any of the new cultivars (Table 2), suggesting they might be derived from old cultivars. Morphologically, seeds of feral B. napus are similar to those of cultivated B. napus. B. rapa had high concentrations of aliphatic GS (between 39.41 and 81.30 μM g− 1, Table 3). The average seed mass of the B. rapa accessions was less (1.40 mg) than that of cultivated (4.60 mg) or feral (4.77 mg) B. napus accessions. Seeds of B. rapa had a relatively thicker seed coat. All these differences were highly significant in a Kruskal–Wallis non-parametric one-way ANOVA (all P values < 0.01), and can account for between-species differences. The level of indole GS differed significantly between the three groups (Kruskal–Wallis P= 0.025), being marginally lower in B. rapa.
Seed characters that allow survival in the soil
Because seed survival was not normally distributed, data were analysed using non-parametric tests (medians given below). Seed survival was much higher in the dry habitat compared to the wet habitat (cultivated B. napus= 0.29 and 0.005; feral B. napus =0.11 and 0.085; wild B. rapa =0.60 and 0.45 in Swifterbant and Boskoop, respectively). Differences between the three groups were significant in both habitats (Kruskal–Wallis test: P= 0.0088 and P= 0.005 in Swifterbant and Boskoop, respectively), with seed survival being high for B. rapa and low for both the cultivated and feral B. napus lines.
If we take all 29 cultivars and accessions of the two species together, there is a positive correlation in seed survival in Boskoop and in Swifterbant (Spearman rank correlation: τ = 0.44, P= 0.017, n= 29). However, this mainly reflects that B. rapa seeds survive better than B. napus seeds in both habitats. When analysing each species on its own, we found no correlation between survival in Boskoop and survival in Swifterband (τ = 0.19, P= 0.62 for the 9 B. rapa accessions and τ = 0.00, P= 0.99 for the 20 B. napus cultivars and accessions).
Using the whole dataset (n =29), survival in Swifterbant correlated significantly with aliphatic GS content (τ = 0.46; two-sided P= 0.01), fractional seed coat biomass (τ = 0.49; P= 0.07) and seed mass (τ = − 0.46; P= 0.012). In Boskoop, survival of seeds correlated significantly with aliphatic GS (τ = 0.49; P= 0.007, n =29), fractional seed coat biomass (τ = 0.41; P= 0.028) and seed mass (τ = − 0.75; P< 0.001). All correlations were in the expected direction. However, large between-species differences in all measured characters confound these correlations (i.e. B. rapa seeds have higher levels of aliphatic GS, a thicker seed coat and smaller seed mass). When examining B. napus and B. rapa separately, only two correlations were significant in Boskoop: in B. napus, seed mass correlated negatively with survival (τ = − 0.49; P= 0.029), whereas in B. rapa fractional seed coat biomass correlated negatively with survival (τ = − 0.78; P= 0.013). However, after Bonferroni correction none of these correlations was significant at α = 0.05, so they should be discarded.
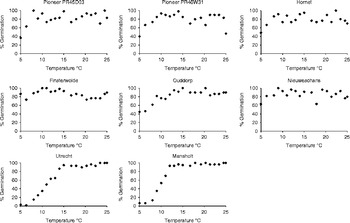
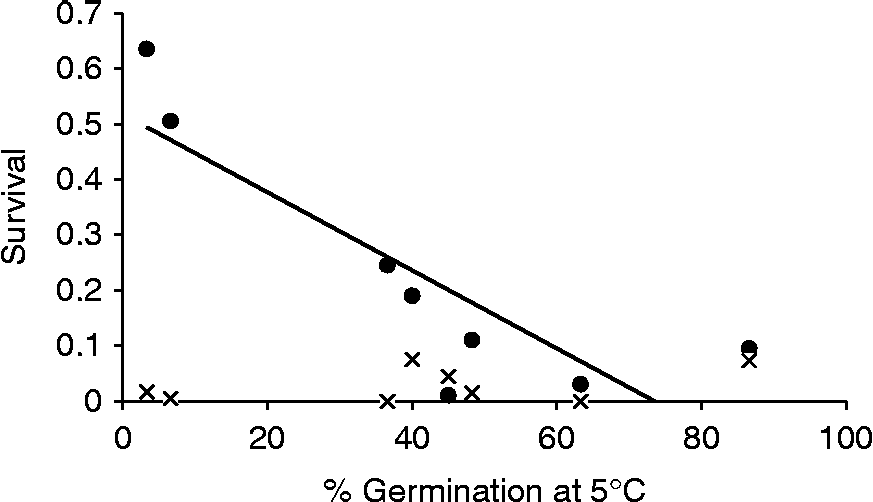
For a subset of eight B. napus accessions, both cultivated and feral, we determined seed germination of 1-year-old seeds at low temperatures. We expect a higher percentage of the seeds to be lost from the soil seed bank when seeds are able to germinate at a wide range of temperatures. While six B. napus accessions invariably show high germination percentages at temperatures of 5°C or higher, two accessions show a strong decline in germination percentage when temperatures drop below 13°C (Fig. 1): feral B. napus from Utrecht and the old cultivar Mansholt both had high seed survival in Swifterbant (63.5 and 50.5%, respectively). The Spearman rank correlation between average germination over 5–15°C and survival in Swifterbant was τ = − 0.60 (P= 0.12). The rank correlation was significant when solely looking at germination at 5°C (τ = − 0.83; P= 0.01). There were no significant correlations between germination at 5–15°C and seed survival in Boskoop, which is not surprising given that all B. napus seeds survived very poorly in wet Boskoop soil (Fig. 2).
Temperature-dependent germination of 1-year-old seeds of various Brassica napus accessions: top, three modern cultivars; middle, three feral accessions; bottom, feral accession from Utrecht and the old crop Mansholt's Hamburger.

Correlation between germination percentage at low temperature (5°C) of 1-year-old Brassica napus seeds and fraction survival of seeds in the soil in a dry habitat (Swifterbant, closed dots) and in a wet habitat (Boskoop, crosses).

Primary dormancy
Out of the 60 fresh seeds of B. napus examined, one was dead and 59 germinated immediately at 28°C. Of the 120 B. rapa seeds, 114 germinated immediately. After scarring, five additional seeds germinated while one seed was dead. A small fraction of the B. rapa seeds (5/119 = 4.2%) apparently delays germination even when conditions are favourable, and thus has primary dormancy.
Secondary dormancy
Germination of fresh seeds of B. napus was not affected by any of the imposed treatments, seeds typically had very high germination rates between 90 and 100%.
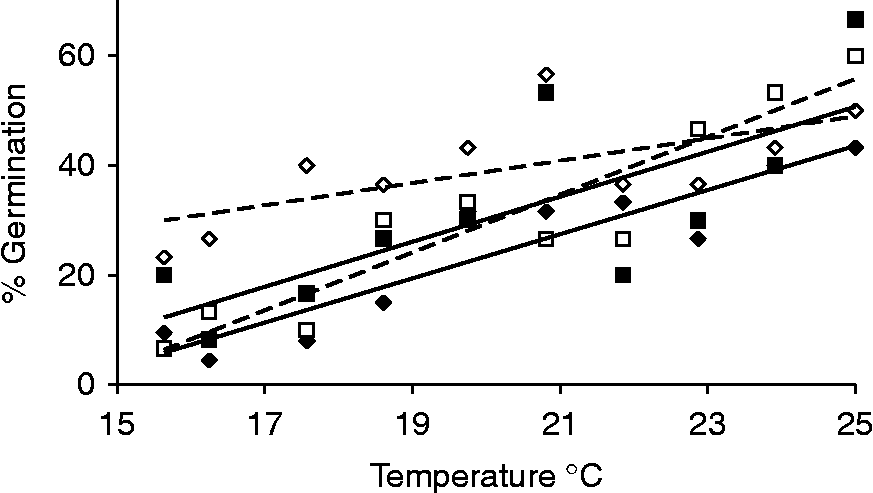
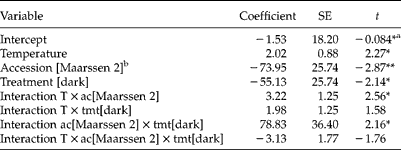
In B. rapa heat had no significant effect on germination of fresh seeds (results not shown). Dark storage was the only treatment that reduced seed % germination (P= 0.04), and the extent of the effect differed between the two B. rapa accessions (significant treatment × accession interaction term: P= 0.04; Fig. 3, Table 5). In particular, dark storage decreased germination in one accession (average germination Maarssen 1 over whole temperature range: control = 39.3% and dark = 24.3%), but not in the other (average germination Maarssen 2: control = 30.6% and dark storage = 31.1%).
Dark storage for 4 weeks in the field reduced percentage germination of fresh seeds of the B. rapa accession Maarssen 1 (open diamonds and broken regression line = control, closed diamonds and solid line = dark), but had no effect on Maarssen 2 (open squares and broken line = control, closed squares and solid regression line = dark).

Output of a linear model that predicts % germination (75% explained variance) of Brassica rapa from temperature (T), treatment (tmt, control or dark storage) and accession (ac, Maarssen 1 and Maarssen 2) and their interactions

a Statistical significance (two-sided): *, P< 0.05; **, P< 0.01.
b Notation means that for accession Maarssen 2 − 73.95 needs to be added in the linear equation (see Material and methods) that predicts % germination, while the default value for Maarssen 1 is 0.
Cold storage strongly increased germination percentage (P< 0.0001), irrespective of the accession and germination temperature used (none of the interactions significant, table not shown). Averaged over all temperatures (15–25°C), cold storage for 4 weeks increased germination from 39.9 to 68.8%. At 25°C only one of the 120 seeds of the two accessions did not germinate.
Covering seeds with leaves similarly increased subsequent germination percentage (P= 0.002, table not shown), but the extent depended on the accession (significant treatment × accession interaction term: P= 0.03) and germination temperature used (accession × temperature interaction term: P= 0.01).
In summary, germination behaviour of B. rapa seeds is affected by many factors in a complex way. Dark storage had no effect in one accession but decreased % germination in another accession. Dark storage is the only factor that slightly increased seed dormancy. Cold and covering with leaves both increased germination fractions, which could simply be due to deterioration of the seed coat or leakage of inhibiting hormones from the seed. Germination of B. napus seeds was not affected by treatment.
Species comparison
Fresh B. napus seeds (collected from a field in Goor) germinated to nearly 100% across the whole temperature gradient (Fig. 4). In contrast, seed germination of fresh B. rapa seeds was lower, and differed between the two Maarssen accessions (linear model %germ = ac+t, P< 0.0001). Interestingly, between-species differences declined with increased temperature. Days until germination at 20°C was typically 1.4 d for B. napus, and 1.9 or 2.4 d for B. rapa (Maarssen 1 and 2, respectively). Low temperature slowed down germination, in particular in B. rapa. The data were fitted by linear regression for each of the three lines (see Table 6).
Comparison of temperature-dependent germination of fresh seeds of Brassica napus (closed dots) and two Brassica rapa accessions collected near Maarssen (1, open diamonds; 2, open squares).

Linear regression of days until germination (D) as a function of temperature (T in °C)

CL, confidence limits.
Discussion
Species comparison
We found wild B. rapa to differ markedly from the closely related crop species B. napus: seeds of B. rapa were smaller, had a thicker seed coat, a higher content of aliphatic glucosinolates and lower germination percentages at moderate temperatures. In addition, a small fraction (4.2%) of B. rapa seeds displayed primary dormancy, whereas B. napus seeds all germinated under optimal conditions. The germination fraction of B. rapa can be modified by environmental factors, but not that of B. napus. Moreover, B. rapa seeds had a higher survival fraction in the soil seed bank than those of B. napus. These differences are congruent with expectations for wild crop species comparisons and are in agreement with findings of other studies. For instance, Hails et al. (Reference Hails, Rees, Kohn and Crawley1997) found 1.5% survival of B. napus seeds at 10 cm in the soil after 1 year, whereas seeds of the ruderal Sinapis arvensis had 60% survival under the same conditions. Adler et al. (Reference Adler, Wikler, Wyndham, Kinder and Schmitt1993) found that germination of modern domesticated B. rapa cultivars was always 100%, whereas wild B. rapa accessions had lower germination percentages that were affected by many interacting environmental factors. As Adler et al. (Reference Adler, Wikler, Wyndham, Kinder and Schmitt1993) argued, variable germination responses could aid seeds to germinate at different moments in time, thereby increasing persistence in natural environments.
Other comparisons
Although old cultivars of B. napus did not differ with respect to their seed morphology, they did contain high levels of aliphatic GS compared to modern cultivars. Interestingly, we found evidence for genetic variation in B. napus with respect to germination at low temperature; the old accessions Mansholt's Hamburger (1899) and Utrecht (feral) displayed low or no germination at 5°C. Consistently, Marshall and Squire (Reference Marshall and Squire1996) found, at 4.8°C, relatively high germination percentages in a new double zero line (Rocket; c. 90%) compared to an old line (Martina; 60%).
Seeds collected in feral populations of B. napus did not differ from cultivars with respect to either their morphological characters or temperature-dependent germination response. This suggests that rapid natural selection for weedy characters that allow the formation of a long-term persistent seed bank is lacking.
Dark dormancy
In the Swifterbant habitat, considerable fractions of the B. rapa seeds (between 13.5 and 79.5%) and B. napus seeds (between 0 an 63.5%) survived 1 year in the soil. Primary dormancy was so low in our accessions that it cannot explain seeds not germinating during a year in the soil. Our results indicate that foregoing germination at low temperatures increases seed survival. However, temperatures in June–September at 10 cm depth typically vary between 15.3 and 18.1°C (www.knmi.nl), falling well within the temperature range at which all the examined B. napus lines germinated 100%, and it is therefore likely that a single rain shower is enough to induce germination.
Alternatively, seeds may develop dark dormancy when buried in the soil, i.e. seeds lose the ability to germinate even under otherwise optimal soil conditions if they remain in the dark (Pons, Reference Pons1991). When exposed to a single light flash, seeds germinate again, so that it is essential to keep seeds always in the dark in such experiments. Instead, in this paper we always tested seeds under fluorescent light after treatment for 4 weeks in darkness. Pekrun et al. (Reference Pekrun, Hewitt and Lutman1998) exposed B. napus seeds to a 0–4-week period of darkness and then tested germination in the dark. They found that the percentage of non-germinating seeds increased from 1.6% (no dark storage) to 37.2% (4 weeks in darkness). Studies on the effect of management on seed bank persistence and volunteer emergence found that without tillage the seed bank of B. napus is essentially zero (Pekrun et al., Reference Pekrun, Hewitt and Lutman1998; Lutman et al., Reference Lutman, Freeman and Pekrun2003, Reference Lutman, Berry, Payne, Simpson, Sweet, Champion, May, Wightman, Walker and Lainsbury2005), indicating that seeds cannot develop secondary dormancy when dispersed on top of the soil. B. napus seeds are known to survive for up to a period of 10 years when foregoing germination (D'Hertefeldt et al., Reference D'Hertefeldt, Jørgensen and Pettersson2008). Although these findings suggest that dark dormancy could be important for the soil seed bank, several aspects require further investigation. Buried seeds may need several weeks to acquire dark dormancy (Pekrun et al., Reference Pekrun, Hewitt and Lutman1998) and during that period they could easily germinate. Not germinating at low temperature, as we found for the Utrecht and Mansholt accessions, may allow more seeds to acquire dark dormancy. In a recent paper, Schatzki et al. (Reference Schatzki, Allam, Klöppel, Nagel, Börner and Möllers2013) demonstrated genetic variation in the ability of B. napus cultivars to develop dark dormancy in polyethylene glycol, under darkness and osmotic stress. A mutant without secondary dormancy would potentially solve the seed bank problem for GM canola and the problem of emerging volunteers in canola cropping.
Evaluation of seed banks in environmental risk assessment
EFSA (2010) guidance requires applicants to specify in the ERA persistence and invasiveness of a crop species. Developing a long-lasting seed bank is a weedy character and information on this is relevant for the ERA. Besides observations on the occurrence of volunteers in subsequent crops, EFSA (2010, p. 45) suggests including information on seed germination and seed burial experiments. In current ERAs applicants typically perform germination experiments at room temperature and with light. However, when all seeds germinate (no primary dormancy) this is no guarantee that the species in question cannot develop a persistent soil seed bank in the field. Testing fresh seeds in the dark makes no difference for B. napus because they will rapidly germinate. An interesting option would be to induce secondary dormancy in the seeds using the polyethylene glycol methods of Schatzki et al. (Reference Schatzki, Allam, Klöppel, Nagel, Börner and Möllers2013) and others. It seems reasonable to expect that the fewer seeds can be induced into secondary dormancy, the smaller the persistence in the soil seed bank. Gruber et al. (Reference Gruber, Pekrun and Claupein2004) validated the polyethylene glycol method, showing a positive correlation (0.61–0.80) between the fraction of seeds induced into secondary dormancy and seed survival in burial experiments in the field. In addition, we suggest that it could also be informative to perform germination tests at cold and cool temperatures. The ability not to germinate at low temperatures could also be a proxy for developing a persistent seed bank for B. napus. The longer the period of foregoing germination, the higher the chance a seed can acquire secondary dormancy and then persist for a very long period in the dark in the soil.
We found that the cultivars and accessions for which the seeds survived best in Boskoop were not the ones that survived best in Swifterbant. A problem with using the seed burial experiments in the ERA may therefore be that results for one habitat cannot easily be extrapolated to another.
Acknowledgements
We thank the Netherlands Organization for Scientific Research (NWO) for subsidizing this project through the ERGO (Ecology Regarding Genetically modified Organisms) project 838.06.112.