


Water plays a central role in every settlement process; this is a universal paradigm, and it was no different in the urbanization of the then deserted Azores islands (Portugal), which occurred from the middle of the fifteenth century onwards. Existing springs and surface water played an essential role in the successful human settlement in the archipelago, providing drinking water for humans and livestock, irrigation, power to propel water wheels for mills and water to supply transatlantic ships during the age of sail as they routinely made Angra a stopping supply station. Concurrently, streams had to be controlled in order to prevent flooding and mitigate associated risks, such as damage to the built environment. From the very beginning of the Angra do HeroísmoFootnote 1 (Terceira Island – Azores) settlement, in the late fifteenth century, various flash floods caused by intense rainfall events were reported, for example by António Cordeiro,Footnote 2 a seventeenth-century local historian. Significantly, present-day flooding events in Angra offer a pertinent window into the past to analyse the importance of water during the early settlement process. For instance, recent intense rainfall events and consequent flash floods reported in the town centre in September 2015 and October 2017 caused significant damage and once again drew attention to this recurrent problem. Despite present-day flooding events suggesting that past floods affected urbanization patterns, rarely are water management approaches correlated with Angra's urban history. Here we suggest that integrating these two approaches opens new possibilities to analyse the past through the interactions between water and its recurrent flooding events and actual settlement patterns and urban growth. In particular, this approach casts new light on the evolution of the town plan showing how it was conditioned by the natural environment, especially water-related events.
Moreover, since Angra is one of the first examples of Portuguese overseas settlement, and probably the first city to be conceived and settled outside its European territory,Footnote 3 this study fits into a wider literature on early Portuguese colonial urban history. Thus, from the analysis of Angra as a case-study, we can generate other comparisons that help us understand how urban landscapes were first created during the early days of Portuguese expansion. As such, this study allows for the replication of our interdisciplinary approach to other Atlantic spaces and colonial settlements across the former Portuguese empire.
In particular, in terms of urban planning in the sixteenth century, the islands were noteworthy as a unique example of town foundation by Portugal over a long period of time. Kings Afonso III (1238–53) and Dinis (1279–1325) devoted substantial efforts to the foundation of new towns. Such dynamism in urban development in mainland Portugal slowed considerably during the following reignsFootnote 4 – though most existing towns had expanded, such as Lisbon, where the Bairro Alto neighbourhood was built just outside the medieval walls between 1513 and 1550.Footnote 5 In terms of urban and land planning practices as well as the development of regulations on colonization and settlement processes, the islands were also a very important precedent for the urbanization of the Portuguese Atlantic world,Footnote 6 especially the occupation of Brazil, to which the same administrative model and settlement regulations were transferred in 1534.Footnote 7 Thus, the main objective of this study is to shed new light on Angra's original town plan and its morphological genesis, focusing on its territorial relations and landscape integration. In short, this study aims at answering the following question: If we take the original water course and correlated flood events into account, how might Angra's urbanization process have begun?
The study territory: the Azores, Terceira Island and Angra
The Azores archipelago, comprising nine islands, is located in the North Atlantic about 1,360 km west of mainland Portugal and about 1,925 km south-east of Newfoundland in North America. It was uninhabited when discovered in 1427 and settled by the Portuguese from the first half of the fifteenth century onward. A distinctive dynamic emerged after 1474 when the archipelago was finally divided into eight donatorial captaincies, and new captains were nominated to lead the settlement process in each of them.Footnote 8 From that year onwards, new towns were founded as the centre of the newly created captaincies while, through a land reclamation scheme already implemented but improved by new legislation during this period, the territory was extensively divided and distributed among settlers using land grant donations.Footnote 9 Land reclamation is the process by which people bring ‘unused’ or ‘waste’ land into productive use. In the Portuguese case, it was first applied through a medieval law, the 1375 Law of Sesmarias,Footnote 10 which was intended to promote the occupation of abandoned rural and urban land, giving it to new settlers.
In the case of Terceira Island, in 1474, the territory was divided into two captaincies after a first failed attempt at administration and colonization of the island as a single captaincy, starting in 1450.Footnote 11 Both new jurisdictions, the Angra and Praia captaincies, were named after the still small settlements that had been established during the first attempts at settling the island.
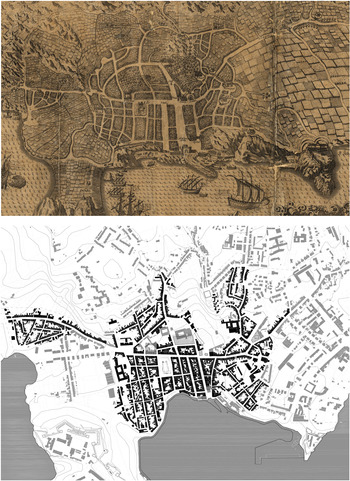
Located on the south coast of Terceira Island, taking advantage of the existing natural harbour, Angra – which literally means ‘port’ – soon became the most important Azorean urban centre and one of the main ports of the Portuguese Atlantic world during the sixteenth century.Footnote 12 Despite the lack of historical sources for how many people moved to Angra during those flourishing years, by the end of the sixteenth century, 100 years after the settlement began, Angra had already grown to 8,400 inhabitants. This number was exceeded only by Lisbon, Porto and Évora in continental Portugal and by Funchal on the island of Madeira.Footnote 13 Even earlier, in 1499 – illustrating its rapid urban growth and increasing importance – Angra's Customs House was chosen as the main location for customs in the Azores islands, due to the excellence and progressive development of the port. In fact, in the same year, on the return voyage from his first trip to India, Vasco da Gama and his crew landed in Angra. Another indicator of its rapid increase in importance was that in 1522 it was nominated to be the base for the Provedoria da Armada, the institution responsible for patrolling the seas and ensuring safe passage for the Indian Route through the North Atlantic return voyage to Lisbon, its final destination.Footnote 14 Moreover, as early as 1534, King D. João III recognized Angra as a city and established there new Atlantic dioceses and a bishopric for the Azores. This opened the way to reinvigorating existing urban development as expressed in its urban layout, particularly in the construction of a new cathedral (1570), a building that precipitated the reorganization of the urban fabric, which was already undergoing consolidation of its centre.Footnote 15 This urban layout is precisely the town landscape represented by van Linschoten's perspective view of 1596 (Figure 1a), an image where the cathedral is actually shown under construction.Footnote 16
Representation of Angra's urban plan: (a) public copy: http://purl.pt/3563/3/ Angra in 1596 (detail of van Linschoten, 1596); (b) overlay of van Linschoten (1596) detail over current Angra's urban features

Angra's origins through history and historiography
For many years, only two main historical sources were available, and all the facts about flash flooding were disregarded. Basing analysis on uncritical direct observations of the consolidated present urban form led to a poorly supported interpretation of the origins of urban planning in Angra. The two sources are van Linschoten's perspective view, mentioned above, which contains the oldest illustration of Angra, first published in 1596Footnote 17 (Figure 1a), and the account of Angra written by Gaspar Frutuoso,Footnote 18 the oldest historical chronicler of the islands, also from the last quarter of the sixteenth century.
Jan Huygen van Linschoten,Footnote 19 who lived in Angra for more than two years (between 1589 and 1592), depicted the city in perspective drawn with exceptional precision and detail, specifying all the streets and houses and naming the public spaces as well as all the outstanding buildings, such as forts, monasteries, churches and the port. In fact, we can still identify most of it in today's urban plan (as represented in Figure 1b), proving it to be a very reliable historical source.
Together, both documents offer a very realistic description of Angra in the late sixteenth century. When we read Frutuoso's book describing the established city, certainly far from what the plan was in its original form, it is evident that it was an exact written explanation of the van Linschoten drawing:
This city is situated in a round, or almost round, low valley surrounded by hills…It is all very well situated, with many broad streets opening wide onto the sea, appearing very graceful, with a very wide street crossing them all from one end of the city to the other. It has large houses, some with two floors, all well-built and in fine order.Footnote 20
Despite the fact that these are very rich and important historical sources for the study of Angra, it is critical to underline that both belong to the last quarter of the sixteenth century, when Angra's urban fabric was already consolidated. Therefore, these two historical sources are based on an already developed urban plan – with a clearly identified morphological unit corresponding to a planned area. This area's layout was quite distinct. In contrast with other urban areas in Angra, it exhibited a regular urban fabric organized on a pattern of parallel and perpendicular streets forming rectangular blocks.
Assuming that the plan described by van Linschoten and Frutuoso fully corresponds to the original foundational town layout, this first theory states that Angra's original plan was structured from the crossroads between Rua Direita and Rua da Sé with a square placed in the intersection of these two streetsFootnote 21 at the lower level of the water catchment,Footnote 22 where, in fact, the city centre later turned out to be based. However, this theory overlooks the fact that from its foundation, c. 1474, until the late sixteenth century when these historical sources were produced and the town plan was finally consolidated, different phases of urban formation can be identified within the regular urban fabric. These phases can be defined as follows: Phase 0: before settlement; Phase 1: from c. 1474 until c. 1500; Phase 2: after c. 1500.
Simplistic analyses based on the above-mentioned theory led to misinterpretations of the chronological process of Angra's urban development. They also paved the way for misleading interpretations, not only about the chronology of the town plan and different strata of urban history, but also regarding the urban plan's orthogonality, which seemed more regular and coherent than was usual for the period according to what was, at the time, a still undeveloped discipline of Portuguese urban planning history. For many years, these analyses maintained a foundational urban layer hidden within the urban plan and, as a result, Angra was incorrectly called the first Portuguese Renaissance urban plan.Footnote 23 This idea was adopted by many urban historical analysesFootnote 24 and was even used, among other reasons, as an argument for Angra's inclusion in UNESCO's World Heritage List.Footnote 25
Although we lack written sources that directly concern water events, a recent research projectFootnote 26 has demonstrated that it is very unlikely that settlement in Angra's foundational urban fabric, dating from the last quarter of the fifteenth century (c. 1474), began in the flood-prone catchment area. Moreover, based on flood modelling analyses and other written sources, we argue that this area would often have been flooded, which suggests a different chronological sequence for Angra's urban development. The study by LeiteFootnote 27 and the flood modelling analysis show that the downtown area was built much later, when Phase 2 of the expansion of the urban fabric was already under way. Moreover, historical reports from the seventeenth century show that the square at the intersection of Rua Direita and Rua da Sé was in fact designed and constructed only in 1611.Footnote 28 Additionally, in 1637, when construction was begun on the Jesuit church near the square in the north part of the catchment, the groundwater level was still high and the ground unstable, reportedly requiring complex construction works on the building foundations. Manuel Maldonado, a seventeenth-century author says that:
the foundations of the Church were opened in the year 1637…those on the eastern side facing Marquis Street [following Rua Direita, or Main Street] were so unsafe that they perceived it to be composed of debris from the rivers that used to flow from the heights around the city, and that they had struck what used to be the valley floor, and the old tradition says that the place where Angra's square now lies, contiguous with the Jesuits’ house, was then a lagoon.Footnote 29
On this basis, one can argue empirically that since the town centre was naturally flood-prone, it could not have been chosen as the best location to build a new town. This option would not have been viable without applying human and material resources which, during the initial period of occupation, were simply not available. It should be remembered that during the early settlement period, the island had yet to be populated, and decision-making about where to establish human settlements could not be made without considering the natural environment and its resources. Given their insular isolation, most likely the main concerns of the first few inhabitants were for their immediate survival and sustainability. These concerns quickly translated into decisions about where to place the emerging settlement and how to organize its population into efficient living quarters, which included the distribution of urban lots in an equitable manner and the allocation of enough land for agriculture to sustain and reproduce a growing population.
Even if we do not have documentary sources that could directly attest to the increasing volume of construction work that was aimed at drying-up and channelling the streams that used to bring water to Angra so freely, we do know that great construction works were executed during the sixteenth century in order to qualify Angra as a city (in 1534) and as a base for the Indian Route (in 1527). Moreover, as explained above, from c. 1500 onwards the town's growth was exponential, bringing to Angra the knowledge, material and human resources needed to execute such works.Footnote 30 We also know that the streams were channelled in order to distribute water to public fountains and even to private houses, as represented in van Linschoten's perspectiveFootnote 31 and also described by Frutuoso:
Aside from the Telhal stream, which flows from the east, near the Conception parish, another great water course runs through the middle of the city that serves twelve mills in the city…[the water goes to a] closed reservoir, from which water flows to the city by pipes and is divided amongst four main fountains, besides another that goes out near the quay, where all the navigators and floats are provided for; and in addition, it is divided amongst all the monasteries and some stately houses, with which the city is newly and freely provided; so that there are, in all, twelve fountains.Footnote 32
However, when taking into consideration the initial restrictions, a reinterpretation of archival sources triangulated with historical landscape reconstruction and urban morphological analysis reveals former historical inaccuracies about Angra's first settlement which, over time, historians have been blindly reproducing without taking into account the natural environment.
This novel methodology has made it possible to propose a more accurate interpretation of the first town plan implemented in the area. Rather than breaking with the traditional method of town foundation employed on Portugal's mainland, as suggested by earlier studies, the foundation of Angra actually appears compatible with the same medieval strategy documented in many medieval new towns founded in Portugal in previous centuries.Footnote 33
Sources and methods
Historical written sources
Historical written sources, such as the historical iconography and cartography of Angra's foundation period, are relatively unknown, mainly because the process was poorly recorded and most documents have not survived. Nevertheless, it was indirectly documented by chroniclers in subsequent periods, such as Frutuoso's description mentioned above,Footnote 34 in the sixteenth century, or das ChagasFootnote 35 and the previously mentioned Cordeiro,Footnote 36 in the seventeenth. Due to the limited number of available sources, it is not difficult to enumerate those that directly pertain to the origins of the urban plan, namely, the charts of donation of the captaincies in Terceira Island dated from 1474Footnote 37 and the few – until now – identified letters of donation of new urban plots in Angra, dating from 1501Footnote 38 and 1504.Footnote 39 In this inventory, there is another document, dated to 1509, referring to a plot already occupied with houses being used as a payment for land sold in another part of the island.Footnote 40 One can infer from these 1509 documents that this plot had been previously bought from another owner, which provides indirect evidence of an existing urban block that had already been consolidated during the early urban phase. Further evidence derived from urban regulations of the period includes a by-law requiring urban lots to be occupied with houses for up to five years before the beneficiary resident could gain full ownership of the property, including the right to alienate or sell to others. Thus, based on this document, one can infer that this plot had already been occupied with houses since at least 1504, dating back to the donation of 1499, or most likely even earlier.
In addition, limited historical information is available about the natural stream that originally flowed through Angra's town centre. In fact, only the documents from 1474, donating the captaincies,Footnote 41 and the chroniclers Gaspar Frutuoso, Diogo das Chagas and António Cordeiro refer to it. However, none of them describes the water stream in detail. They refer to it as having economic value (possessing the power to move water wheels, for example), and as an important asset for the town. For instance, in the late seventeenth century, the historian António Cordeiro describes in great detail how one of the reasons for Angra's uniqueness is that
It is provided with so much water, that when the City wishes, it causes such a flow that when it enters the wide streets via its pavements it runs between the tiles, leaving them dry, and it drains into the sea, and the same also happens when it rains heavily.Footnote 42
Moreover, Cordeiro also states that, unlike most other places, in Angra no one would throw waste on the streets, since all the houses had gardens behind them, and most of them even had access to plumbed running water inside.Footnote 43 In Angra, in pre-industrial times, the stream was seen as a blessing and never as a hazard or potential natural disaster even if, on occasion, it did flood the town.
The study presented in this article also relies on analysis of the current urban fabric, which, itself, must be considered as a document. As demonstrated already by urban morphological studies,Footnote 44 the built layout constitutes the primary evidence for a town's spatial development. In order to achieve an accurate result, it is essential that the studies be based on accurate cartography, such as the updated digital cartography provided for this study by the Municipality of Angra.
Reverse historical analysis and historical landscape reconstruction
Reverse historical analysis, or reverse design,Footnote 45 consists of progressively detaching urban elements from current digital cartography, following a backward chronology. Then, by mapping dated stages of the continuous urban development process, reverse historical analysis allows us to generate relatively accurate interpretations of the historical landscape for specific time periods. In addition to making possible an interpretation of the temporal sequence of urban formation, reverse historical analysis of the urban plan also provides a way to assimilate and integrate other information about a town's past that can be derived from archaeological and historical sources. It is essential that all steps of the process be informed and validated by historical sources and documents, such as those mentioned above, and corroborated by observation of the town plan layout. When considering the water stream in the discussion on the initial stages of Angra's development, it is crucial to consider not only the documentary historical sources, but also the territory and its topographical representation. The evaluation of hydraulic behaviour during the initial period of the settlement process is as accurate as possible, as presented in the next section.
Urban morphology studies allow us to reconstruct the built environment of the past and the structure of the town, for example at the beginning of the foundational process, in order to show its historical and spatial evolution.Footnote 46 Afterwards, in order to infer the earlier stages of Angra's urban development, a reverse historical analysis was conducted to place different data sets in conversation with one another. Three principles were used. First, overlaying the earliest known mapping source, the van Linschoten portrait printed in 1596, on the most updated digital cartography, so that it shows only those morphological features that we can date from the late sixteenth century with maximum historical confidence (Figure 1b). Second, identifying those urban planning features that are most likely to be of medieval date, namely streets, plots and buildings (‘plan elements’ collected from the historical sources). Finally, using the variations in built form shown by patterns of streets and urban plots to identify morphological planning units, each of which nominally represents a stage in the evolution of a town's plan.
Geographical data and flood modelling
Geographic Information Systems (GIS) provide spatial analysis tools that can be used in decision support processes. They can provide different information and improve our understanding of various historical and geographic geo-phenomena. GIS applications are diverse and cover various domains, including history, architecture and engineering. In the more specific domain of overland flow modelling and flood risk assessment, GIS play an important role in: (1) storing the different input data in a format compatible with urban flood simulation models; (2) pre-processing the data to clean up data artefacts; (3) visualizing the flood modelling results; and (4) assessing flood risk.
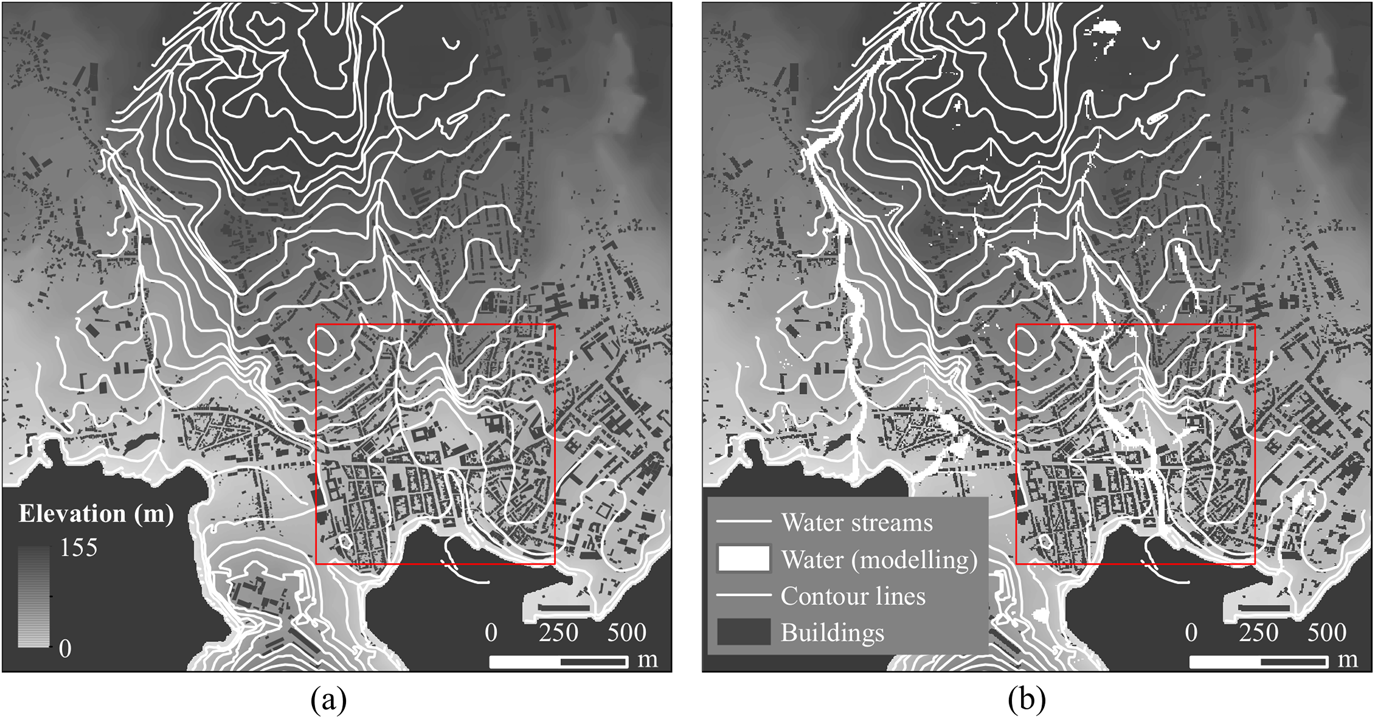
Digital Elevation Models (DEMs) represent the terrain surface and are one of the main geographic data sets involved in flood modelling, as the terrain morphology plays an important role in how water is distributed over the catchment (Figure 2a). Other data sets used to model flood scenarios are buildings that can divert flow into the catchment area to limit the simulation domain. In this study, a five-metre horizontal resolution DEM with polygons representing the existing buildings in different stages (Phase 1 and Phase 2) of Angra's urban development were used to conduct the flood simulations. The building data were used to increase the elevation in the building locations.
Catchment contributing with surface runoff to the initial settlement area (the red square shows the inset of Figure 4): (a) streams represented in the existing cartography (CM Angra do Heroísmo, 2004); (b) flood modelling results for the two-year design rainfall

Flood models can be used for several purposes, such as design, evaluation of the hydraulic behaviour and real-time operation of drainage systems, including flood forecasting. This study is the first time flood models have been used to support urban history theories in the Azores. Guidolin et al. Footnote 47 proposed the flood model used in this study; the results of the model are presented in the form of two-dimensional maps of maximum water depth distribution. In Figure 2b, one can see that the results (i.e. water depth) match the water streams delineated in the cartography very well (Figure 2a).
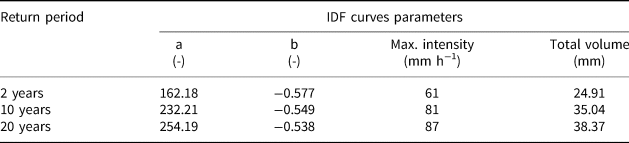
In order to simulate the hydrological conditions of the catchment that would have affected Angra's historical centre, three design rainfall eventsFootnote 48 with a total duration of one hour and with different intensities (and consequently different return periods)Footnote 49 were considered (Table 1). The different rainfall intensities correspond to return periodsFootnote 50 of 2, 10 and 20 years. The design rainfall events were built based on the Alternating Block MethodFootnote 51 using the Intensity-Duration-Frequency (IDF) curve parameters proposed by the Ministério das Obras Públicas, Transportes e Comunicações.Footnote 52
IDF curves parameters used to generate the design rainfall events

Results
Mapping the original town plan
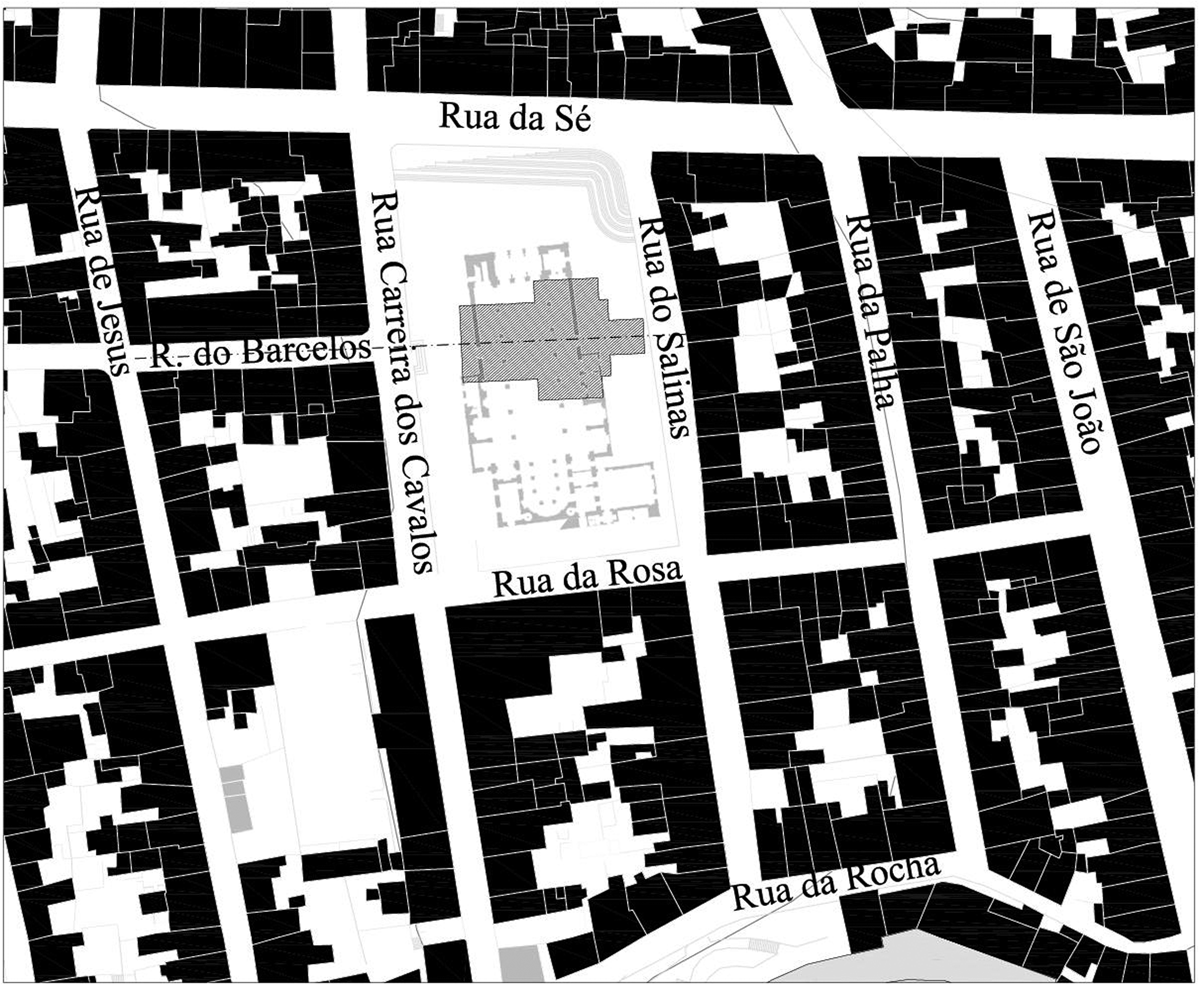
As mentioned earlier, a limited set of documents is available on plots related to the foundational process of Angra, but some include a few relevant elements for analysis. The documents allow for the identification of two donated urban plots (dated 1501 and 1504), plus a third property already occupied by houses in 1509, that was passed to a third owner. These documents allow for the identification of other urban elements that are referred to in the historical sources describing the precise location of the granted plots. In particular, these documents on early property ownership reveal the position of the Santo Salvador church, which was replaced by the new cathedral that was built over it in the late sixteenth century, as mentioned above (Figure 3). Moreover, it reveals the old churchyard and church front door position as well as the main chapel orientation, the location of which left its mark in the urban fabric by causing a misalignment in the street behind it. It also allows the streets where the plots were located to be identified.Footnote 53
Proposal for the location of the disappeared Santo Salvador church and current urban fabric

By analysing the few available historical documents, such as the van Linschoten perspective view (Figure 1), and by analysis of the current urban fabric (Figure 3), it is possible to identify the morphological unit corresponding to Phase 1 (the blocks delimited by Rua do Salinas, Rua da Sé, Rua de São João and Rua da Rocha). In the van Linschoten perspective view, it can be seen that Rua da Palha is the only element that connects this morphological unit to the hinterland. Also, as can be seen today, the blocks of this unit are narrower than the neighbouring ones (which correspond to Phase 2 of the urban development).
By the beginning of the sixteenth century, new urban plots were being donated in the areas of expansion shown in the plan, namely above Santo Salvador church, to the north-west, and around Rua Direita on the south-east side of what we call the first phase. Rua Direita must originally have been Angra´s main street, as it is so named in the documents donating a plot there.Footnote 54 Together with Rua de São João, they form a new morphological unit very much connected with the port and related activities. This is indicated by streets that are much wider than the others in Angra's plan. Their morphology clearly shows that they belong to a different period of the town plan, giving form and space to host a new kind of urban life that ensured the development of Angra as an important Atlantic port of the sixteenth century.
Mapping water in Angra's urban settlement
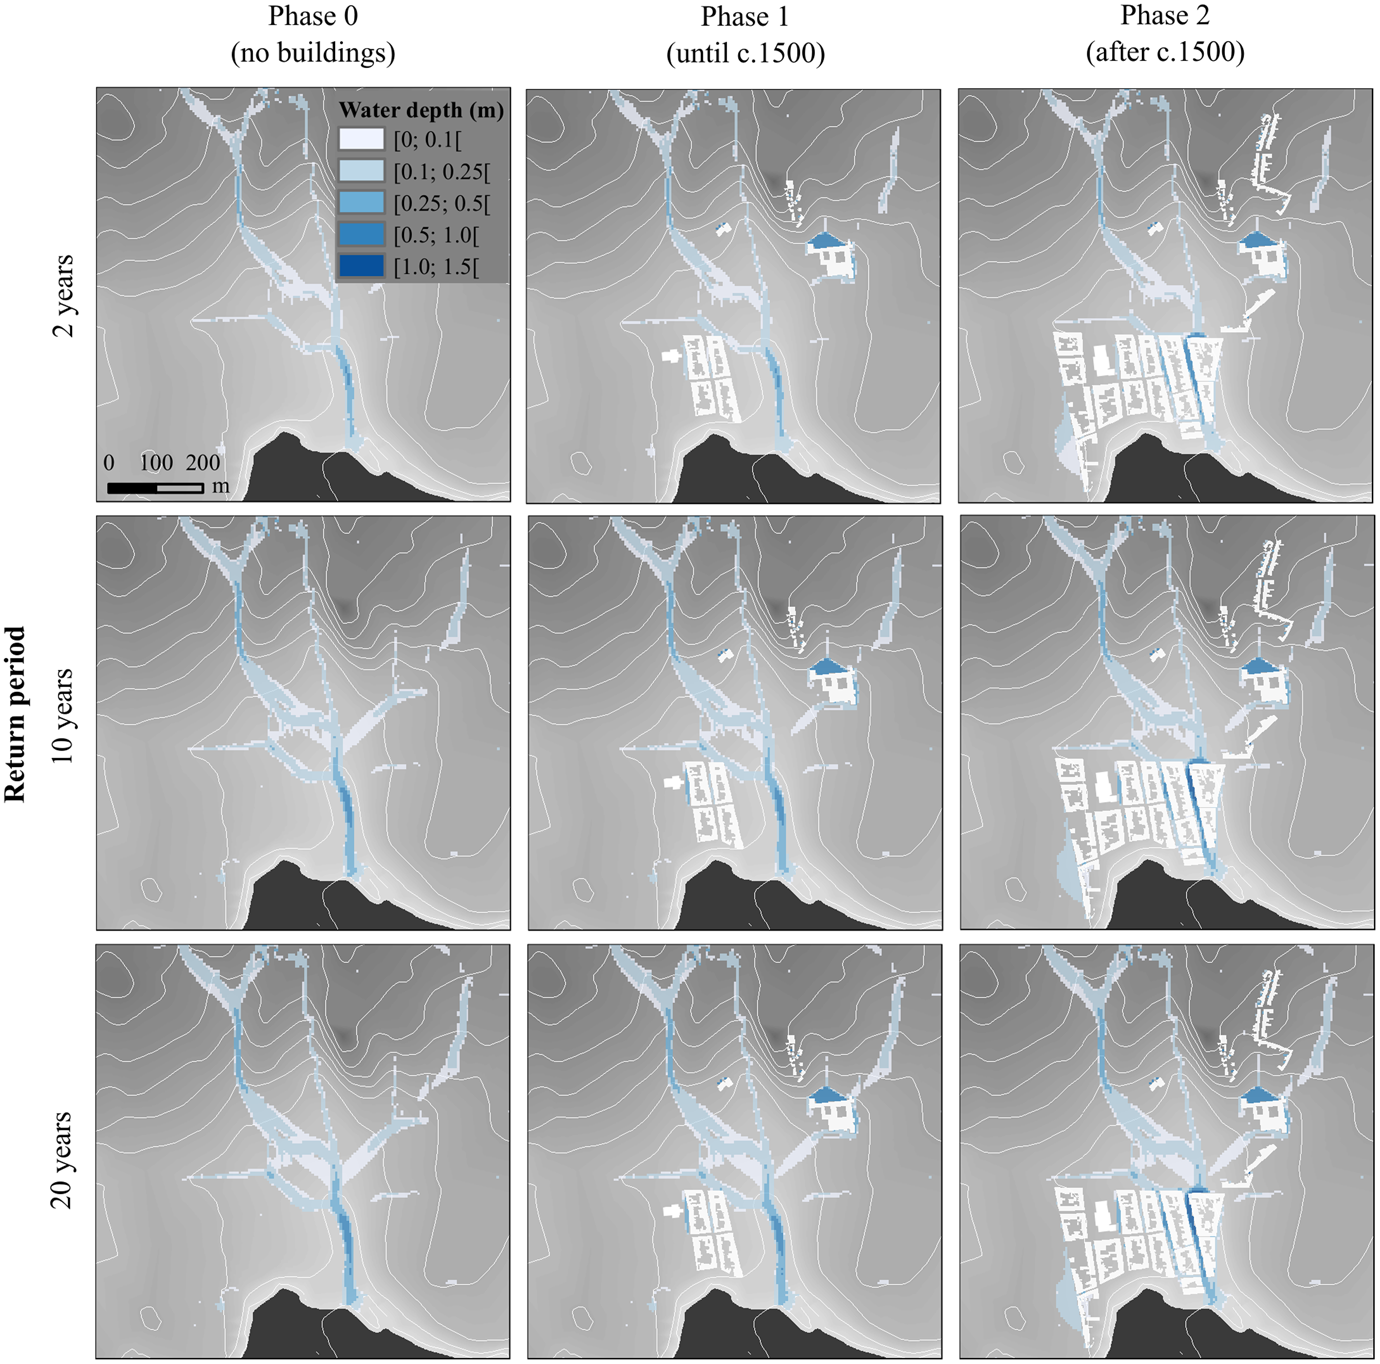
All the water depth maps (Figure 4) resulting from the hydraulic simulations conducted in this study show that Angra's present-day town centre is flood-prone (even during low-intensity rainfall events), as empirically presented earlier in this study. Therefore, due to the scarcity of human and material resources available on the island at the beginning of the occupation process, this area could not have been the place chosen on which to begin building a new town. Furthermore, these results also coincide with our theory, proposed via historical analysis of the town plan's origins. As demonstrated, in its first phase the town plan included four blocks and a church located on the right shore of the catchment area, bordered on the north side by a secondary water stream and on the south side by the line of the coast. This layout makes best use of the geographic and topographical conditions by locating the rectangular blocks so that the streets could run along the longer side of the block at the same ground level, while the secondary streets, connecting the first ones, would run perpendicular to them, helping water drainage to follow the natural slope of the terrain.
Maximum water depth maps resulting from the flood simulations (three different return periods and three urban development phases)

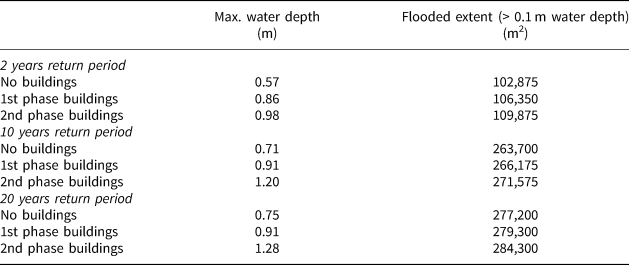
In Table 2, a summary of the flood modelling results is presented for the three design rainfall events and the three occupation phases (Phase 0: no buildings, Phase 1 and Phase 2). The results clearly show that without substantial drainage works the area now occupied by Praça Velha and Rua Direita (Angra's present centre) would have been frequently flooded (statistically, once every two years). Also, the flooded area is significant, ranging from approximately 100,000 km2 to almost 300,000 km2 for design rainfall events of between 2 and 20 years. This underlines the fact that it is unlikely that Angra's settlement began in this specific flood-prone area.
Summary of the flood simulation results for the three different design rainfall events and the three settlement phases

In Figure 4, the flood maps for the three rainfall events and the three occupation phases are presented. From all nine maps, it can be seen that Praça Velha and Rua Direita are located right on top of the catchment's most relevant water line which, due to the steep topography of Angra, creates the conditions for flash flood events. Angra's drainage system (underground storm water sewer system) has normally been able to deal with these small but frequent flood events; however, for larger rainfall events, flooding has recently been reported, for example in 2015 and 2017.
Conclusions
The main objective of this study was to reveal Angra´s initial urban planning, as well as to understand its foundational urban planning along with its environmental and territorial characteristics. Moreover, the study intended to rethink and provide new and more plausible explanations for how urban landscapes were newly created in the earliest days of the Portuguese expansion. In so doing, we were also able to evaluate the extent to which these newly formed Atlantic settlements were in continuity with the medieval urban settlement patterns followed in mainland Portugal. Furthermore, as one of the first Atlantic settlements built in the age of maritime expansion, Angra could be considered a model for the creation of other urban settlements that later emerged along the Atlantic.
This study shows that Angra followed the urban programme used to settle medieval Portugal. The programme included, when and if necessary, a defence structure such as a wall or castle and, as a norm, a limited number of rectangular blocks (more easily adaptable to local topographies than square blocks) and a church – always located off-centre to the house layout. This less rigid foundational strategy, based on a more organic model that adjusted and changed through time, allowed a flexible use of the elements, resulting in various configurations and townscapes.Footnote 55 As far as the relation between the position of the house blocks and the church is concerned, Angra's foundational urban layout finds parallels with, for example, Miranda do Douro, Sines or Viana do Castelo, in mainland Portugal,Footnote 56 as well as with Praia, the already mentioned new town founded on the other captaincy of Terceira Island.Footnote 57 This clearly indicates that, instead of relying on theoretical models of dubious applicability in order to face the uncertainties of a new world, the Portuguese option was to rely on known strategies that had been tried before with success.
As demonstrated in this study, flood models can also be successfully used to support historical investigations of urban development. The flood model applied on Angra's territory proved that the town centre (Rua Direita and Praça Velha) is prone to flooding, showing that this area could hardly be viable as a permanent place for settlement without making huge investments of material and human effort. This confirms the results obtained from the historical data previously collected and analysed, demonstrating that the lower catchment area was only urbanized during a second phase (Phase 2) of town building, indicating a very different chronology from that informing most historical studies.Footnote 58 The analyses also allowed us to identify a more precise definition of the morphological town units corresponding to each phase of the urban layout, as well as to confirm the position of other plan elements, such as the two urban plots donated to the settlers and the Santo Salvador church which had already been demolished.
From all the analyses presented in this article it was possible to propose a more accurate basis for Angra's foundational plan, very different from that considered in previous studies, and which for many years informed Portuguese urban history. The novel theory for the urban development of Angra presented in this study and supported by various historical and flood modelling analyses can become a new milestone for interdisciplinary collaboration studies that has the potential to reveal determining factors in urban planning history which are too often overlooked.