1 Introduction
Human decision making does not only use a systematic logical approach; emotions and mood both inform the decision that is made (Hertel et al., Reference Hertel, Neuhof, Theuer and Kerr2000; Schwarz, Reference Schwarz2000). The distinction that psychology makes between emotions and mood is that emotions are short-term feelings that are directed towards a particular object or person (Levenson, Reference Levenson1994). In contrast, mood is a long-term feeling without a focus on a particular individual or object (Gray et al., Reference Gray, Watson, Payne and Cooper2001). We recognize that emotions and mood both have a psychological and physiological effect on humans (Keltner & Gross, Reference Keltner and Gross1999; Gibson, Reference Gibson2006), however, we will be focussing on the functional aspect that mood and emotion play in the decision-making process.
Previous work has shown that simulating emotions within agents (we refer to these agents as emotional agents throughout the paper) can influence the evolution of cooperation within the Prisoner’s Dilemma game (Lloyd-Kelly et al., Reference Lloyd-Kelly, Atkinson and Bench-Capon2012a, Reference Lloyd-Kelly, Atkinson and Bench-Capon2012b), with initial work on showing how adding mobility can affect which strategies are the most successful (Collenette et al., Reference Collenette, Atkinson, Bloembergen and Tuyls2016b, Reference Collenette, Atkinson, Bloembergen and Tuyls2016c). A simulated model of mood has been proposed, which was developed with a grounding in psychology, and which has been shown to increase the level of cooperation in the Prisoner’s Dilemma game when added to simulated emotions (Collenette et al., Reference Collenette, Atkinson, Bloembergen and Tuyls2016a). Ranjbar-Sahraei et al. (Reference Ranjbar-Sahraei, Groothuis, Tuyls and Weiss2014b) have shown that with agents without emotions, the environment type influences the evolution of cooperation in a social dilemma situation.
We aim in this paper to gain a deeper understanding of how different environments affect the evolution of cooperation within emotional agents and emotional agents with mood. We consider four types of environment: regular, small-world, random, and an empty environment. We have also scaled the environments so that they all have the same amount of floor space for the agents to move around in. The construction of the environments will be discussed later in the paper. We continue to explore the developed mood model in practice to further understand how cooperation flourishes within a society of agents. The resilience of cooperation growth achieved is tested by the addition of defectors, indicating the stability of the cooperation strategy that uses our model. In this work, we combine previous efforts by giving simulated emotional agents the opportunity to move around in the environment, and therefore allowing them to interact with many other agents over time. We examine whether the environment structure has the same effect on emotional agents as it does on non-emotional agents. By giving our agents mobility we aim to give a more accurate description of the evolution of cooperation in a multi-agent setting.
We use a simulated environment with our agents being modelled as e-pucks, which are small disc-shaped robots. They are simulated within the player/stage application (Gerkey et al., Reference Gerkey, Vaughan and Howard2003). We have selected a simulation rather than mathematical models of graph-based interactions as this naturally allows us to emulate a number of interesting properties such as asynchronous interactions, dynamic neighbourhoods, and differing rates of interaction between agents.
We start by giving the background to this work including an introduction to the Prisoner’s Dilemma game. We then explain the implementation of simulated emotions along with the background of previous work that has used this implementation. Following on from this we describe the implementation of the simulated model of mood and the justification of this implementation. We explain our experiments that we have conducted along with the methods we use for a comparative analysis of our results. We then discuss our main contribution, which is a deeper analysis of the mood model showing that the emotional characteristics do not make a large difference against identical strategies. However, we show that they do make a difference when faced with pure defectors. We also give a deeper analysis of the differences between different environments, showing that the shape of the environment does have an effect. Then we conclude this work by summarizing the contributions in more detail.
2 Background
There are a number of ways in which researchers have implemented emotions into a computational setting using a number of different frameworks. The frameworks can vary from a logic-based implementation (Steunebrink et al., Reference Steunebrink, Dastani and Meyer2007) to applications in human–computer interaction (André et al., Reference André, Klesen, Gebhard, Allen and Rist2000). A significant proportion uses the OCC (Ortony, Clore, and Collins) psychological model of emotions as their basis (Ortony et al., Reference Ortony, Clore and Collins1990). There are other psychological models of emotion such as circumplex model of affect (Posner et al., Reference Posner, Peterson and Russell2005). We have chosen to use the OCC model due to its accepted use in agent-based systems as well as the flexibility in implementation. Moreover, this allows us to compare our work with the work of Lloyd-Kelly et al. (Reference Lloyd-Kelly, Atkinson and Bench-Capon2012b) and Collenette et al. (Reference Collenette, Atkinson, Bloembergen and Tuyls2016a, Reference Collenette, Atkinson, Bloembergen and Tuyls2016b, Reference Collenette, Atkinson, Bloembergen and Tuyls2016c) to see the effect mobility has on which emotional strategy becomes most dominant through replication.
Ranjbar-Sahraei et al. (Reference Ranjbar-Sahraei, Groothuis, Tuyls and Weiss2014b) show how cooperation evolves within a society of mobile agents. The authors simulate robots in two types of environments, regular and small-world. However, in their work they do not consider the effect of emotions. We base our simulation model on the work of Ranjbar-Sahraei et al. (Reference Ranjbar-Sahraei, Groothuis, Tuyls and Weiss2014b) while incorporating the emotional characters of Lloyd-Kelly et al. (Reference Lloyd-Kelly, Atkinson and Bench-Capon2012b) and Collenette et al. (Reference Collenette, Atkinson, Bloembergen and Tuyls2016a, Reference Collenette, Atkinson, Bloembergen and Tuyls2016b, Reference Collenette, Atkinson, Bloembergen and Tuyls2016c), allowing to compare our results directly to theirs while simultaneously being able to isolate the effect of both emotions and mobility. Additionally we consider two further environments; random and empty. We take into account the differing levels of floor space that these environments introduce by adjusting the floor space in each environment to be equal such that the only difference in environment makeup is the shape of the environment.
There is a large body of related work within the evolution of cooperation in (social) networks, particularly the scenarios where cooperation is costly but ultimately beneficial for all. This is often modelled as a classical Prisoner’s Dilemma (Axelrod & Hamilton, Reference Axelrod and Hamilton1981). There has been work focussing on structural network properties and interaction mechanisms, and on determining if cooperation is sustainable in varying situations (Hofmann et al., Reference Hofmann, Chakraborty and Sycara2011; Ranjbar-Sahraei et al., Reference Ranjbar-Sahraei, Bou Ammar, Bloembergen, Tuyls and Weiss2014a). There has been a focus on developing strategies to support cooperation in the Prisoner’s Dilemma, these are often built from the ground up to support this property (Santos et al., Reference Santos, Santos and Pacheco2008; Hilbe et al., Reference Hilbe, Traulsen and Sigmund2015). There is work closely related to ours that extensively studies ‘Tit-for-Tat’-based strategies (Van Veelen et al., Reference Van Veelen, Garca, Rand and Nowak2012), although our emotional characters are highly related; Van Veelen et al. do not link their strategies to psychological character traits as we do here, nor do they consider mobility.
2.1 Prisoner’s Dilemma
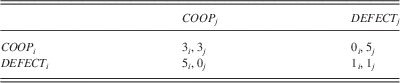
The Prisoner’s Dilemma is a social dilemma where two players are given the choice of cooperation or defection. This choice is made simultaneously with no communication prior to the decision made. Each player then will get a payoff according to the choices made by both players. The payoffs for the game are 3 for each agent when they both cooperate, 1 for each agent when they both defect, and 5 for the agent which defects in a non-mutual outcome and 0 for the cooperative agent. The game matrix is shown in Table 1, with player one choosing a row, player two choosing a column, and both players receiving the payoff indicated in each cell.
Payoff matrix of the Prisoner’s Dilemma

When looking at the Prisoner’s Dilemma outcomes, it seems in the best interest of both players to both play cooperatively since this would lead to the largest total payoff for the group as a whole. However, there is a temptation to defect as this can lead to a higher individual payoff. When both players reason this way, this then leads to the Nash equilibrium of (DEFECT, DEFECT), which gives the worst outcome for the group as a whole, highlighting the dilemma of the game. Investigating methods by which self-interested agents can be incentivized to cooperate in the Prisoner’s Dilemma has been an active area of research in the past decades, with a particular focus on the evolution of cooperation within groups of agents (Axelrod & Hamilton, Reference Axelrod and Hamilton1981; Santos et al., Reference Santos, Santos and Pacheco2008; Bloembergen et al., Reference Bloembergen, Ranjbar-Sahraei, Bou Ammar, Tuyls and Weiss2014). It is for this reason that we adopt this model of interaction in the current work as well.
2.2 Emotion implementation
The simulated emotions that will be implemented in our agents are based on the Ortony, Clore, and Collins model of emotions, known as the OCC model (Ortony et al., Reference Ortony, Clore and Collins1990). The model was developed through psychology research and has been used throughout the artificial intelligence community (André et al., Reference André, Klesen, Gebhard, Allen and Rist2000; Lloyd-Kelly et al., Reference Lloyd-Kelly, Atkinson and Bench-Capon2014; Popescu et al., Reference Popescu, Broekens and van Someren2014; Collenette et al., Reference Collenette, Atkinson, Bloembergen and Tuyls2016b). The OCC model takes a functional view of emotions, in which emotions influence changes in behaviour. The action taken is a result of the emotional makeup of the person, which is a result of all the previous outcomes. This functional view lends itself to being a good platform for implementing emotions as the descriptions are of the outward effects of the emotions rather than how emotions are processed internally. Of the 22 emotions defined in the OCC model we will be modelling anger, gratitude, and admiration, so we can compare to previous work (Lloyd-Kelly et al., Reference Lloyd-Kelly, Atkinson and Bench-Capon2012b; Collenette et al., Reference Collenette, Atkinson, Bloembergen and Tuyls2016a, Reference Collenette, Atkinson, Bloembergen and Tuyls2016b, Reference Collenette, Atkinson, Bloembergen and Tuyls2016c). Moreover, anger and gratitude intuitively make sense in the context of defection and cooperation. We have included this subset not only for its intuitive application and for comparison, but also to ensure that each emotion is faithfully modelled. This small subset also allows us to identify with greater ease, what is causing the difference between the agents, regarding mobility, environment structure, or emotions.
Our implementation of these emotions is similar to previous work by Lloyd-Kelly et al. (Reference Lloyd-Kelly, Atkinson and Bench-Capon2012a). This allows us to compare the differences caused by mobility and environment structure rather than implementation. Each emotion has a threshold, and when that threshold is reached it triggers a change in the agent’s behaviour. Specifically, when the anger threshold is reached the agent changes to defection, and when the gratitude threshold is reached the agent changes to cooperation. Admiration, when triggered, will cause the agent to take on the emotional characteristics of the agent that triggered the admiration threshold.
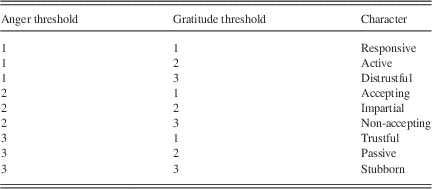
There are a number of emotional characters which have differing thresholds for these emotions. The full set of characters is shown in Table 2, and are intended to show a range of characteristics that could reflect a simple simulation of personality differences.
Emotional characters, as used in this work and previous work (Lloyd-Kelly et al., Reference Lloyd-Kelly, Atkinson and Bench-Capon2012a); character names added by us
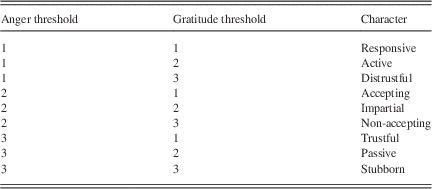
An agent’s anger increases by one when its opponent defects; gratitude increases when the opponent cooperates. For example, take the two characteristics Responsive and Active. If Responsive chooses to cooperate, Active’s gratitude increases to 1. If Active chose to defect, then Responsive’s anger increases to 1. Responsive’s anger level is at the anger threshold, so in the next game with that agent, Responsive will choose to defect and the anger level will return to 0.
Admiration thresholds can similarly be rated as high (3), medium (2), or low (1). These are not listed in the table as they are independent from the emotional character. Admiration increases when the agent believes that its opponent is performing better than itself. When a threshold is reached, the agent’s behaviour changes as described above and the value is then reset back to 0. In the work of Lloyd-Kelly et al. (Reference Lloyd-Kelly, Atkinson and Bench-Capon2012a), the admiration threshold increases when an agent compares its total payoff against each of its neighbours every five games. For our agents, the neighbours are not as well defined because they will be moving constantly, which changes who they are near to at a particular time. We will instead use a modified version of the trigger for admiration as used in previous work with mobility (Collenette et al., Reference Collenette, Atkinson, Bloembergen and Tuyls2016a, Reference Collenette, Atkinson, Bloembergen and Tuyls2016b, Reference Collenette, Atkinson, Bloembergen and Tuyls2016c).
The modified version is when a mobile agent completes five games of the Prisoner’s Dilemma. After that, the mobile agent will request the average payoff per game of its next opponent, before the game has started, and compares this value to its own average payoff. The agent will increase its admiration value towards whoever has the highest average, this will be either itself or its opponent. We are using average payoff, rather than total payoff which was used by Lloyd-Kelly et al. (Reference Lloyd-Kelly, Atkinson and Bench-Capon2012a), because we cannot be sure that each mobile agent has engaged in the same number of games as its opponent. When the admiration threshold has been reached, the agent takes on the emotional characteristics of the agent that triggered the threshold, which may be itself, so the agent will then respond to other opponents in the same way as the agent who triggered the admiration threshold. Then the admiration threshold is reset to 0. Finally, the agent plays the game with its opponent.
2.3 Mood implementation
We implement the mood model as described in Collenette et al. (Reference Collenette, Atkinson, Bloembergen and Tuyls2016a) and for completeness, we re-iterate the construction of the model with its psychology grounding. The mood model is split into three main groups; positive, neutral, and negative.
Negative moods lead to a more logical outcome as people tend to think more thoroughly about the action they will take (Hertel et al., Reference Hertel, Neuhof, Theuer and Kerr2000; Schwarz, Reference Schwarz2000). In our experiments we use low moods to lead to defection, as this is the Nash equilibrium and can be considered the more rational decision. Very low mood levels will lead to defection regardless of the emotional state of the agents.
Positive moods tend towards an ideal outcome even if that affects the person negatively (Hertel et al., Reference Hertel, Neuhof, Theuer and Kerr2000). In our experiment the riskiest behaviour is cooperation as it can lead to the worst outcome for the individual agent. Cooperation is the ideal outcome as it gives the highest payoff for the group as a whole.
The mood model will only affect the decision-making process when an agent has no emotional attachment to the opponent, that is, the agent has not interacted with the agent previously. The mood levels will only override the current emotional decision when they are either extremely high or low. We have done this to represent that mood levels in humans do not necessarily reflect cooperation within the group, but affect the choice an individual makes (Lount, Reference Lount2010).
Mood is represented as a number between 0 and 100, with the grouping as follows: a mood of below 10 is characterized as extremely low, below 30 as low, higher than 70 as high and above 90 as extremely high, and between 30 and 70 as neutral. Definition (1) shows how the agent chooses an action based on our mood model with the simulated emotions.
Definition 1.
Let
 $$Ag_{{i,j}}^{t} $$
return the action i takes against j where Ag is the set of all agents, with i and j∈Ag, and t denotes time. Let
 $$m_{i}^{t} $$
return the mood of agent i at time t where
 $$m_{i}^{t} $$
is ]0, 100[. Let η
i,j
return the number of interactions agent i has had with agent j. Let I
i return the initial action of agent i. Let
 $$E_{{i,j}}^{t} $$
return the action that agent i would take against agent j based on their simulated emotions.
 $$Ac_{{i,j}}^{t} {\,\equals\,}\left\{ {\matrix{ {COOP,} \hfill & {If\,m_{i}^{t} \,\gt\,90\,or\left( {m_{i}^{t} \,\gt\,70\,and\,\eta _{{i,j}} {\equals}0} \right)} \hfill \cr {DEFECT,} \hfill & {If\,m_{i}^{t} \,\lt\,10\,or\left( {m_{i}^{t} \,\lt\,30\,and\,\eta _{{i,j}} {\equals}0} \right)} \hfill \cr {E_{{i,j}}^{t} ,} \hfill & {If\left( {30\,\lt\,{\equals}m_{i}^{t} \,\gt\,{\equals}70\,and\,\eta _{{i,j}} \,\ne\,0} \right.} \hfill \cr {I_{i} ,} \hfill & {Otherwise} \hfill \cr } } \right.$$
Our representation of positive mood values comes from psychology literature showing how people take riskier behaviour to achieve a more ideal outcome (Hertel et al., Reference Hertel, Neuhof, Theuer and Kerr2000). However, if the mood is too positive, as it is when a person has mania, then the behaviour becomes extremely likely to hurt that person (Leahy, Reference Leahy2005). Schwarz (Reference Schwarz2000) and Hertel et al. (Reference Hertel, Neuhof, Theuer and Kerr2000) show that negative moods can be more likely to lead people to make a more logical and thought out choice. Research into human patients with depression shows that these people are more likely to choose defection in a Prisoner’s Dilemma game. The research also showed that depressed patients were more critical of themselves (Haley & Strickland, Reference Haley and Strickland1986). This provides us with grounding for our choice of defection as part of our implementation of the mood model in the Prisoner’s Dilemma, and validates how the mood values are more greatly affected when the mood is low.
The agent’s mood value will go up or down based on the difference between the payoff received and their average payoff, as this represents how well the agent thinks they have done in that game (Fehr & Schmidt, Reference Fehr and Schmidt1999). Then additionally the mood value will go up or down based on how the agent feels towards inequity between the average payoffs. We will be using the inequity aversion model Homo Egualis to represent inequity as a value (Fehr & Schmidt, Reference Fehr and Schmidt1999). In this model we need to find an α and β, where α represents how much an agent cares when inequity affects them negatively and β represents how much an agent cares when inequity affects their opponent negatively. We will represent an idealistic situation where agents care equally about themselves and their opponents. For this idealistic representation we will take α=β, representing that an agent cares about an opponent as much as it cares about itself.
The amount the agent cares is represented by applying the mood to our α value, such that higher moods give a lower α. This results in mood changes being larger when the mood is low. If the mood is low then the agent ‘thinks’ that it is doing poorly in the environment when compared to other agents. We do this to represent the property that humans care more about equality when doing poorly in society (Fehr & Schmidt, Reference Fehr and Schmidt1999).
Definition 2.
Let Ag be the set of all agents, with i and j∈Ag. Let t denote time. Let
 $$p_{i}^{t} $$
return the payoff of agent i at time t. Let
 $$m_{i}^{t} $$
return the mood of agent i at time t, in the range ]0, 100[. Let
 $$\mu _{i}^{t} $$
denote the average payoff for an agent up to time t. Let
 $$F_{i}^{t} $$
return the opponent of agent i at time t.
 $$\alpha _{i}^{t} {\,\equals\,}\left( {100{\minus}m_{i}^{{t{\minus}1}} } \right)\,/\,100$$
 $$\Omega _{{i,j}}^{t} {\,\equals\,}\mu _{i}^{t} {\minus}\alpha _{i}^{t} \cdot {\rm max}\left( {\mu _{j}^{t} {\minus}\mu _{i}^{t} ,0} \right){\minus}\alpha _{i}^{t} \cdot {\rm max}\left( {\mu _{i}^{t} {\minus}\mu _{j}^{t} ,0} \right)$$
 $$m_{i}^{t} {\,\equals\,}m_{i}^{{t{\minus}1}} {\plus}\left( {p_{i}^{t} {\minus}\mu _{i}^{{t{\minus}1}} } \right){\plus}\Omega _{{i,j}}^{{t{\minus}1}} \,where\,j{\,\equals\,}F_{i}^{t} $$
Definition (2) gives the set of equations that calculate the mood value. In Equation (2) we show how we get our α value from the current mood of an agent; this places the mood value in the range of ]0, 1[ so it can be used as the α. For example, a mood value of 75 will return an α of 0.25. Equation (3) is the simplified version of the Homo Egualis function (Gintis, Reference Gintis2000), as we have only two agents in a single interaction and α=β. The equation gives us a numerical representation of inequity that the agent has for that interaction. Equation (4) shows the overall implementation of mood using the previous mood value, the average payoff, the received payoff, and the Homo Egualis function to update the mood value after an interaction with another agent.
3 Experimental set-up
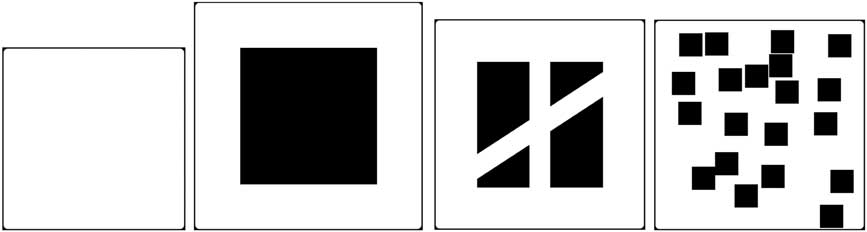
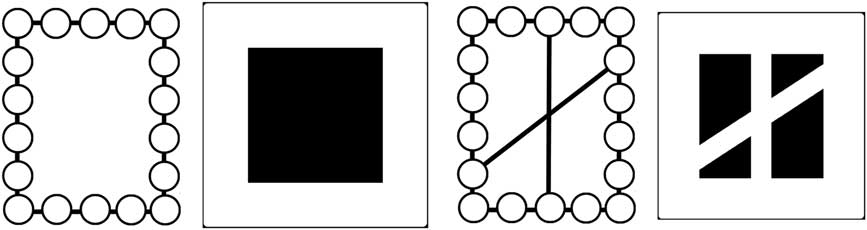
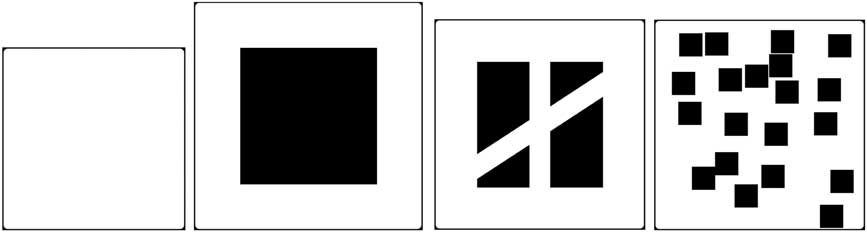
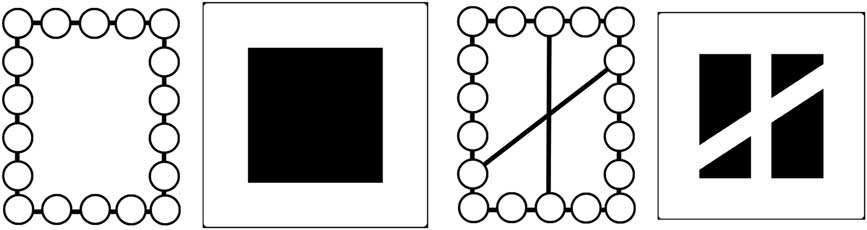
In this work we will be exploring cooperation in the Prisoner’s Dilemma using emotional agents with and without mood. We are also investigating how the environment shape can affect which strategies are successful. To achieve this we have conducted a number of experiments. These experiments will take place in four different environments as shown in Figure 1. The regular and small-world environments have been constructed from their network equivalents where the connections mark out the traversable space, as in Ranjbar-Sahraei et al. (Reference Ranjbar-Sahraei, Groothuis, Tuyls and Weiss2014b). The graph and the environment equivalents are shown in Figure 2.
Environments used, from left to right: empty environment, regular environment, small-world environment, random environment
Graph followed by environment for the regular and small-world environments, respectively
The empty environment is constructed to have no obstacles. The random environment is different for each run of the experiment, its shape is constructed from the regular environment. The inner obstacles are split into 20 equal-sized blocks which are then placed randomly within the environment while ensuring that they do not overlap.
3.1 Agent interactions
The agents are given a random walk behaviour with some basic obstacle avoidance procedures. Each agent has proximity sensors to detect walls and obstacles, located at {−90, −45, −15, 15, 45, 90°} w.r.t. the robot’s heading. If the sensors on the left detect anything, the agent will stop and then turn to the right, and the reverse for the right sensors. The robot’s speed is set at 10 cm s−1 and it can turn at speeds upto 45° s−1. When no obstacles are detected the agent randomly selects a turn speed between −45 and 45° s−1 while moving forward. Since a new heading is generated each time the robot receives sensor data this results in a random movement pattern. We use a random walk as in this work we are interested in robot societies, where the random walk replicates some of the characteristics associated with a society. The characteristics include the ability to have dynamic groups of agents and uneven numbers of interactions between agents.
The Prisoner’s Dilemma game is initiated whenever two agents are in close proximity, and have line of sight of each other. The game is played once, after which they will then continue their random walk behaviour. The agents have no knowledge of the payoffs or the number of games to be played, and will purely use the strategy given by their emotional character to play. The agent has no knowledge of the strategies or emotional characters of its neighbours, but it can differentiate between them, and the emotions it has apply specifically to the agent it is playing against. The agents have no knowledge of the environment; they will only use the random walk behaviour driven by their sensor inputs.
The average payoff is obtained directly from the opponent and since we study how effective these agents are in an ideal situation, we force all agents to be truthful. Similarly the agent will not lie when communicating the emotional characteristics it is currently inhabiting. Exploring how lying can affect these emotional agents is an interesting topic but it is out of scope of this paper since we are most interested in isolating the effects of movement on a mixed group of emotional agents.
3.2 Validation experiment
The aim of this experiment is to show that our mobile agents have the same emotional response and outcomes as the static agents reported by Lloyd-Kelly et al. (Reference Lloyd-Kelly, Atkinson and Bench-Capon2012b). In this experiment we will only be using the emotions gratitude and anger, as these were the emotions used in the original experiment (Lloyd-Kelly et al., Reference Lloyd-Kelly, Atkinson and Bench-Capon2012a). The emotional agents will play the iterated Prisoner’s Dilemma against a fixed-strategy agent that does not use emotions. The emotional agents will be set to cooperate initially. The non-emotional agents have the same knowledge of the world as the emotional agents. They have the same random walk behaviour and the same limited knowledge about their neighbours. The fixed strategies that the emotional agents will be tested against are the traditional ones from Axelrod’s tournament (Axelrod & Hamilton, Reference Axelrod and Hamilton1981) and are described in Lloyd-Kelly et al. (Reference Lloyd-Kelly, Atkinson and Bench-Capon2012a) but are reiterated here.
Mendacious Always defects
Veracious Always cooperates
Random Equal chance of defection or cooperation
Tit-for-tat Initially cooperates, then mimics the opponent’s last move
Joss Tit-for-tat with a 10% chance of defection
Tester Defect on round n, if the opponent defects play tit-for-tat until the end of the game otherwise cooperate until round n+2 then repeat from n+3
In this experiment there are only two agents in the environment: the emotional agent, and the fixed-strategy agent. For each emotional character of Table 2 we will perform 10 runs against each fixed strategy in turn. A run consists of simulating the mobile agents until 200 rounds of the Prisoner’s Dilemma game have been completed, equal to the set-up used by Lloyd-Kelly et al. (Reference Lloyd-Kelly, Atkinson and Bench-Capon2012b). This should make the results identical, up to a slight variation caused by chance in the Random and Joss strategies. The Joss strategy plays tit-for-tat with a 10% chance of defection.
3.3 Emotion experiment
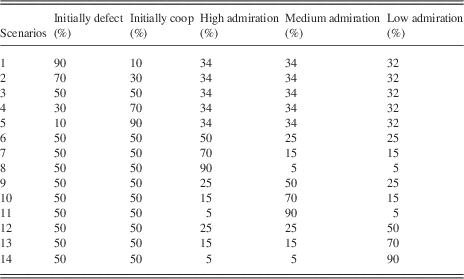
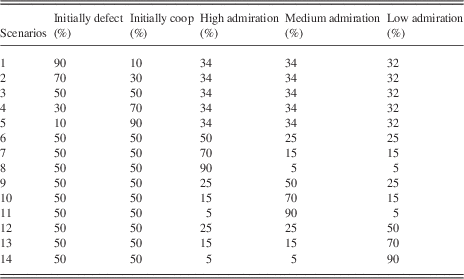
This experiment aims to highlight the differences and similarities between mobile and static emotional agents, as well as showing what influence the environment type has on the outcomes. In addition to the anger and gratitude emotions, here we will also include the admiration emotion. As in Lloyd-Kelly et al. (Reference Lloyd-Kelly, Atkinson and Bench-Capon2012a), there will be 14 scenarios that will be investigated. Each scenario is defined by the number of initial defectors and cooperators, and the number of agents with high, medium, or low admiration thresholds. The first five scenarios have identical admiration threshold distributions, but have varying percentages of initial actions. The remaining scenarios have varying admiration thresholds but identical distributions of initial actions. Each scenario is shown in Table 3.
Scenarios used in the emotion experiment
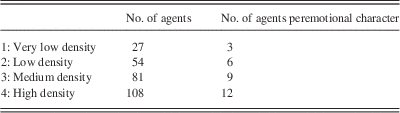
For each of these scenarios there will be a number of sub-scenarios using a different numbers of agents. The number of simulated mobile agents will range from 27 to 108, with each emotional character being represented equally in each sub-scenario. The exact numbers for each density are given in Table 4. We have included these sub-scenarios as we expect when the number of agents increases, the density of the agents will increase, since the environment is still the same size. We predict that the effects seen in previous work should be replicated as each environment is the same shape. For the random and empty environments we predict that the empty environment will show a more extreme version of the small-world environment, while the random environment will give a more extreme version of the regular environment as it restricts the movement of agents more.
Number of robots that each scenario will be performed with

We have changed the number of robots from previous work as we predict that in the random environment the very low densities of the previous work of nine agents will struggle to interact at all. We have also lowered the very high densities as we have made some of the environments smaller to account for the differing floor space; we want to ensure that all robots are able to fit into the arena and have the chance of movement.
Having an equal distribution of emotional characters initially makes sure that we test character strength without being affected by characteristics having an initially higher representation. We will run each combination of scenario and sub-scenario 10 times. The data set allows us to judge the characteristics and outcomes of the runs at a significant level. Each run will last for 10 min during which the agents move around and interact, which allows sufficient interactions and replication to take place. We record data for each interaction including: agents involved, actions chosen, current number of games, current average, time initiated, and distance travelled. We also record the number of each characteristic at the end of the run, as well as the final averages for each agent. This provides us a good data set to perform a deep analysis on our agents.
We are expecting the Active agent to be most dominant in our emotion experiment, as in previous work. We expect some variation in rankings due to the random nature of the interactions. If the Active agent continues to be dominant in all environments then we can say that some strategies are more successful despite differences in environment or floor space.
3.4 Mood experiment
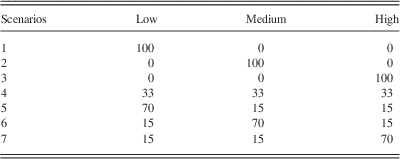
This experiment explores how cooperation evolves and whether it is affected by differing initial mood levels. The initial level of mood will be categorized into three types, low, medium, and high where low has a mood level of 30, medium is 50, and high is 70. There will be seven scenarios each with a different distribution of these levels among the agents, which can be seen in Table 5. We have kept the scenarios the same as in previous work.
Mood experiment scenarios with starting mood levels as a percentage

Each of these scenarios will be run against a number of sub-scenarios. The sub-scenarios define how many agents will be in the environment, with a range from 27 to 108 agents. The details of the scenarios can be seen in Table 4. Again, we have changed the number of agents from previous work and as such we can also keep the number of agents consistent between the mood and emotion experiments. Each scenario will also contain an equal distribution of each emotional characteristic, with the initial actions distributed equally among them. We keep to previous work by having the admiration threshold for each agent set to 3 (high). We predict that there will be little difference in the level of cooperation from the previous work. We also predict that the mood will stop individual characteristics becoming dominant as the mood evens out the differences in average payoffs.
3.5 Resilience experiment
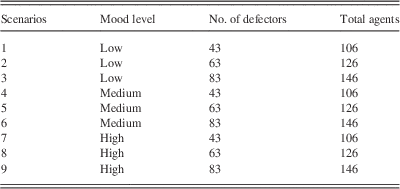
We repeat the resilience experiment that Collenette et al. (Reference Collenette, Atkinson, Bloembergen and Tuyls2016a) conducted. This experiment is intended to test the resilience of the cooperation that evolves over time. To test this we will be introducing into our environment pure defectors at the beginning of the experiment. The pure defectors cannot replicate themselves but the emotional agents may take on the role of a pure defector due to their admiration emotion. Each scenario will have 63 agents whose initial mood is dictated by the scenario: the moods are categorized as high (70), medium (50), and low (30). The numbers of pure defectors are 43 (minority defectors), 63 (equal defectors and emotional agents), and 83 (majority defectors). The details of each scenario are shown in Table 6. This will show the resilience that our mood model has to these pure defectors.
Resilience experiment scenarios

We predict that the results will be similar to the previous work, with high moods performing well then collapsing and low moods to be the most stable. We also predict that low moods will lose the least amount of agents to the defectors as their average scores were reported to be closest to the defectors which should prevent the replication happening. Under the same reasoning we predict that the high moods should lose the most agents.
4 Analysis
In this section we present and discuss the results of the four experiments detailed previously. First we discuss the validation experiment, showing that our mobile agents have the same emotional response as their static counterparts. Next we expand on the mutual outcomes that were introduced in Collenette et al. (Reference Collenette, Atkinson, Bloembergen and Tuyls2016c), by providing a proof for the outcomes. Then we analyze the emotion and mood experiments looking at the cooperation levels, successful characteristics, and the effects of agent density, while considering the effects that the environment has on each section. Finally we explore the resilience experiment by providing a deeper analysis than the one provided in Collenette et al. (Reference Collenette, Atkinson, Bloembergen and Tuyls2016a).
4.1 Validation results
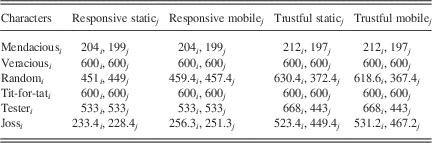
We investigate how our emotional characters perform against the static strategies discussed. To compare our results to those in Lloyd-Kelly et al. (Reference Lloyd-Kelly, Atkinson and Bench-Capon2012b), we focus on the Responsive and Trustful charactersFootnote 1 as these are characters whose individual scores were reported. The results of this experiment show that our agents do indeed react in the same way. We observe that against agents which do not have randomness, our mobile agents perform identically to their static counterparts. Against agents which have randomness introduced (Random and Joss), we can see that the average payoffs between the two types of agent are close, and that all of them have the same winners. This shows that our mobile agents react in the same way as their static counterparts, and that our results will be directly comparable (Table 7).
Total individual payoffs of initially cooperative emotional agents (columns, indicated with j) against a set of fixed strategies (rows, indicated with i)
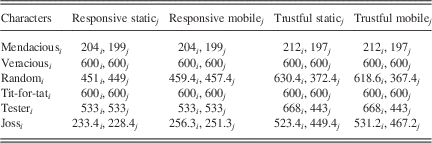
We compare the results of our mobile agents to the static ones of Lloyd-Kelly et al. (Reference Lloyd-Kelly, Atkinson and Bench-Capon2012b).
4.2 Mutual outcomes
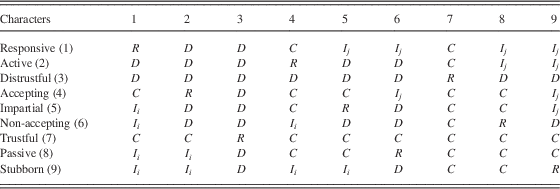
When we look at the interactions between pairs of agents there are a number of patterns that emerge between them. When two agents start with identical initial actions the result of the game will be continued mutual cooperation or defection without deviation. When the initial actions are different then a number of different patterns emerge. The agents will play a series of (COOP, DEFECT) cycles then after a number of interactions turn to mutual defection or cooperation and then continue this indefinitely. The agents may under certain conditions continue this (COOP, DEFECT) cycle indefinitely without settling on a mutual action between them. The mutual action the two agents choose is dependant on a number of conditions, namely their gratitude and anger thresholds, but it may also depend on their opponent’s thresholds. We will reproduce the equation given in Collenette et al. (Reference Collenette, Atkinson, Bloembergen and Tuyls2016a) for clarity in Equation (5).
Definition 3. Let Ω i,j return the mutual action of emotional agents i and j. Let A i be the anger threshold of agent i and G i be the gratitude threshold of agent i. Let Ac i return the current action of agent i.
 $$\Omega _{i}^{j} {\,\equals\,}\left\{ {\matrix{ {COOP,} \hfill & {If\left( {Ac_{i} {\,\equals\,}Ac_{j} {\,\equals\,}COOP} \right)\,or\,\left( {Ac_{i} {\,\equals\,}COOP\,and\,G_{j} \,\lt\,A_{i} } \right)} \hfill \cr {DEFECT,} \hfill & {If\left( {Ac_{i} {\,\equals\,}Ac_{j} {\,\equals\,}DEFECT} \right)\,or\,\left( {Ac_{i} {\,\equals\,}DEFECT\,and\,A_{j} \,\lt\,G_{i} } \right)} \hfill \cr {NotMutual,} \hfill & {If\,A_{i} {\,\equals\,}G_{j} \,and\,G_{i} {\,\equals\,}A_{j} } \hfill \cr {\Omega _{j}^{i} } \hfill & {Otherwise} \hfill \cr } } \right.$$
Table 8 shows what the mutual actions will be between our emotional characteristics when paired against each other. This table also shows us that when two agents are paired against each other and they have differing initial actions, the two agents are equally likely to choose mutual cooperation or defection.
The mutual outcomes that occur between two agents i and j with differing initial actions, where I i is mutual cooperation or defection depending on the initial action of agent i, C is mutual cooperation, D is mutual defection, and R is a repeated loop of (COOP, DEFECT) then (DEFECT, COOP)

4.2.1 Proof of mutual outcomes
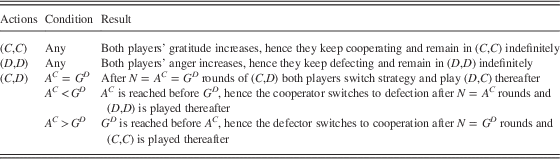
We will now give a proof for Equation (5), by enumerating all possible interactions and finally giving an example.
Assumptions: Emotional characters are paired to play iterated Prisoner’s Dilemma games, both start with zero anger and gratitude. This only holds in two-player interactions, for multiple players the admiration emotion starts playing a role as well.
Notation: Actions are C (cooperate) and D (defect); the anger threshold is A, superscript denotes a player, for example, A C is the anger threshold of the cooperating player; and similarly the gratitude threshold is G. Each time A or G is reached its value is reset to 0.
Enumerating all possible interactions: Based on initial actions of both players and conditions on their values of A and G, we can enumerate all possible outcomes. This is given in Table 9.
All possible interactions for emotional agents and their outcomes

Example: Suppose Responsive meets Active. If Responsive plays C and Active plays D, they will switch to (D,D) after 1 round since AC=1<2=GD. If Responsive plays D and Active plays C, they will swap strategies after one round since AC=GD=1 and play (C,D) for one round (since now AC=1<2=GD, as before), and then (D,D).
4.3 Cooperation levels
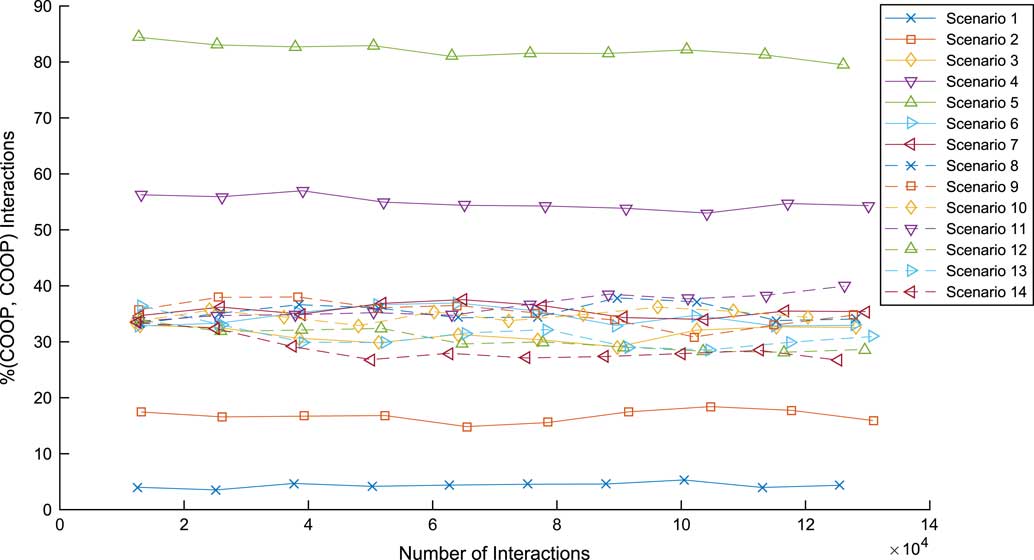
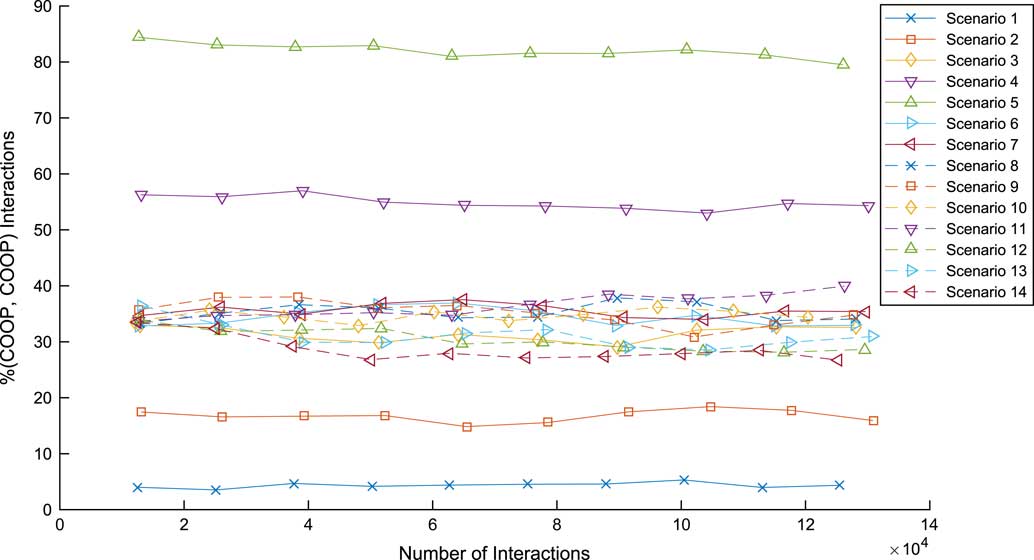
We first look at the level of cooperation between the agents in the emotion experiment as shown in Figure 3. We can see that the cooperation is stable with the level of cooperation achieved being in proportion to the starting level of initial cooperation. The reason that cooperation does not change over time is that only agents which have an initial result of (COOP, DEFECT) will change their action. When we look at Table 8 we see that there are an equal amount of mutual cooperation and defection endings, so we expect half of the agents to go to mutual cooperation and half to mutual defection.
Level of cooperation per scenario in the emotion experiments, the level of cooperation is related to the starting level of initial cooperation
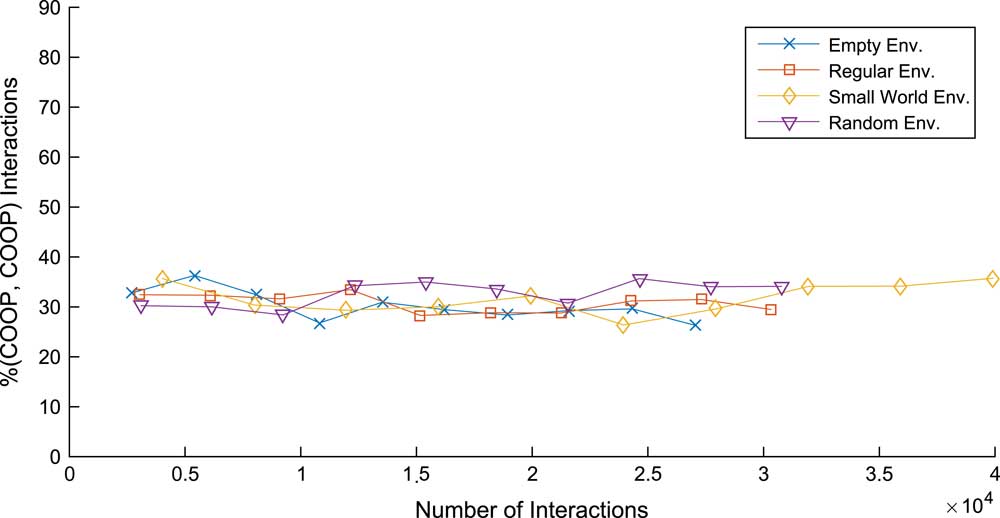
This effect can also be seen when we look more closely at the environments. We have taken scenario 3 of the emotion experiment as it has equal distributions and looked at the levels of cooperation achieved in Figure 4. We can see that the environments have some variation but hover around the same level. This shows that the environments do not have a direct effect on cooperation levels between agents, highlighting that the differences in the results shown in Figure 3 are down to the emotional characteristics of the agents.
Level of cooperation per environment, using scenario 3 showing how the environment has no direct effect
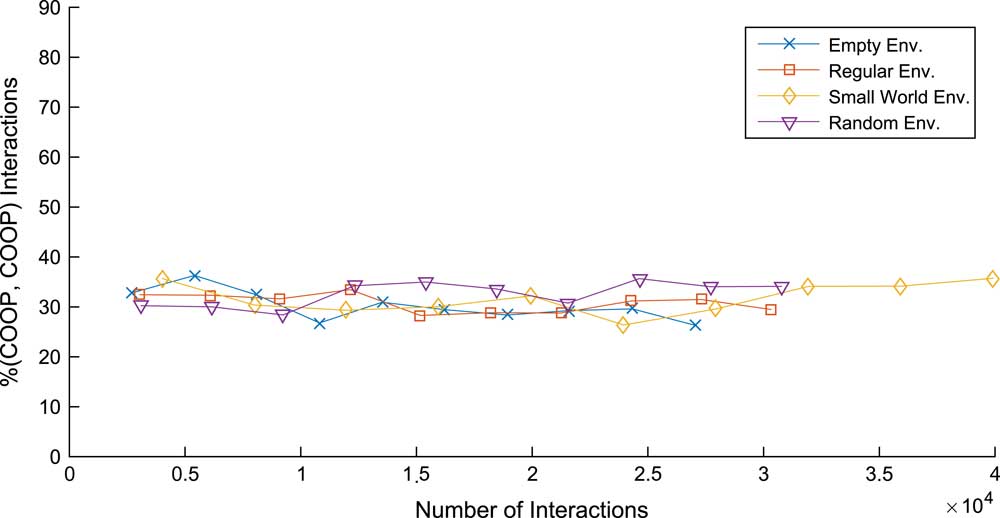
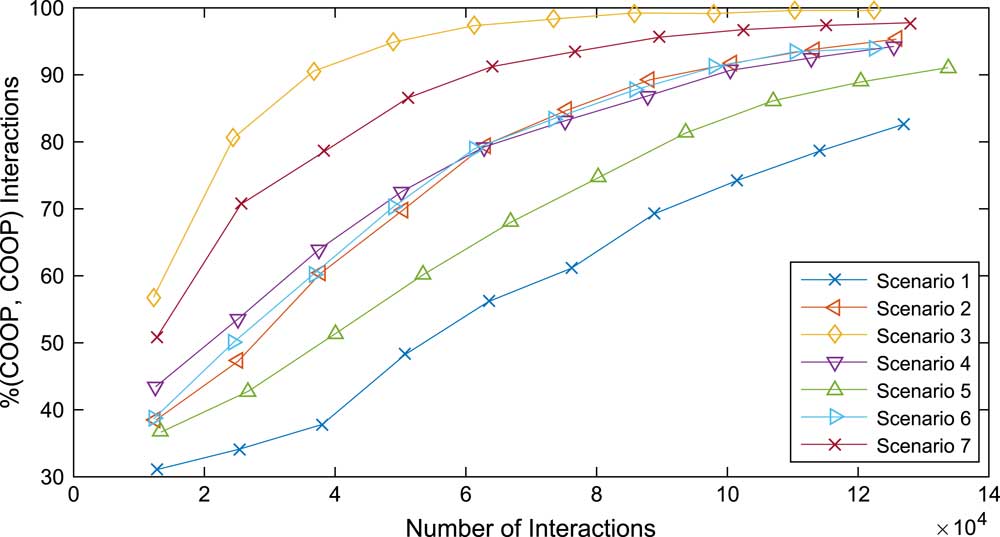
Figure 5 shows us the percentage of cooperation between each minute for each scenario in the mood experiment. The results given are quite intuitive; we see that cooperation evolves throughout the agents, and the speed at which this is achieved is directly proportional to the average level of mood. The fastest is the scenario with 100% of agents starting with high mood levels and the lowest is the scenario with 100% of agents having low mood levels. We can attribute this to the mood model as when we compare this to Figure 3 we see that cooperation only rises with the addition of mood. This also validates our implementation of the mood model as our results reflect those of previous work (Collenette et al., Reference Collenette, Atkinson, Bloembergen and Tuyls2016a).
Level of cooperation per scenario in the mood experiments, the speed cooperation is achieved is related to the starting mood level
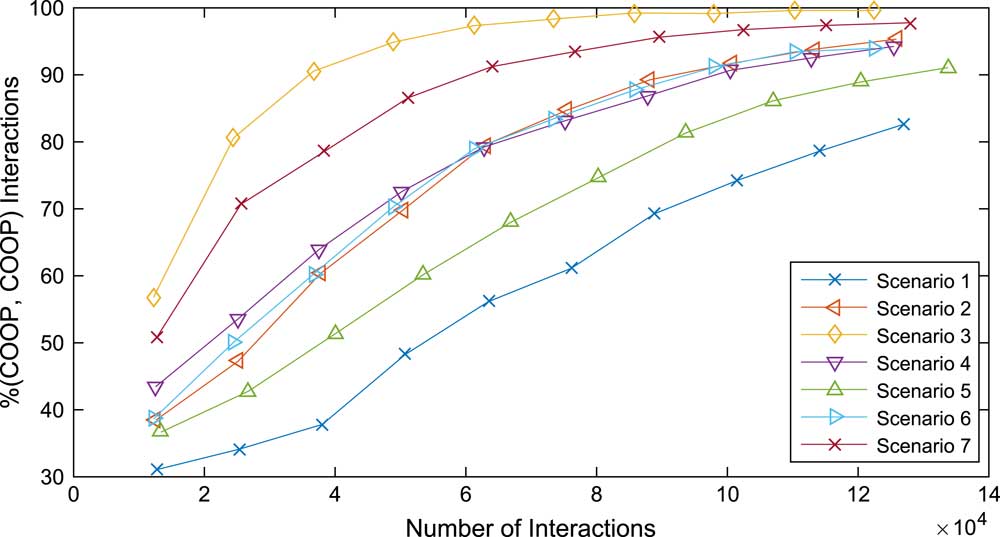
These results show us that the mood model can support the evolution of cooperation over time and sustain cooperation; this was an expected result as when cooperation is high the mood moves very little. When two agents play the game, with one being in a high mood and one being in a low mood, the low mood will rise faster than the high mood can go down which is a property of the implementation of the egualis equation of Fehr and Schmidt (Reference Fehr and Schmidt1999). This leads to more agents in a cooperative state, raising cooperation overall. This effect is most apparent in scenarios where the agents start with low moods, as there is a dip in cooperation followed by the continuing rise of cooperation when a large amount of agents with opposing moods meet.
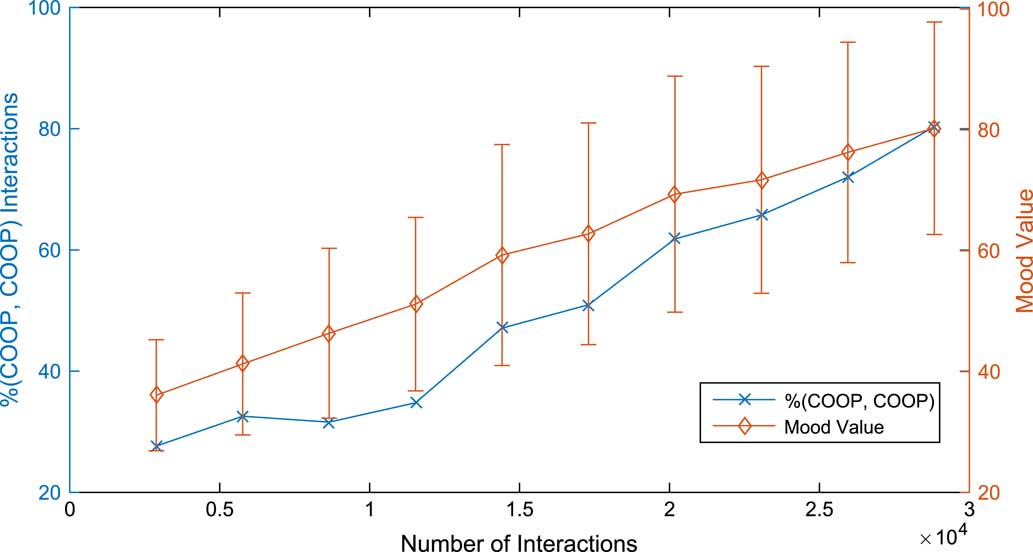
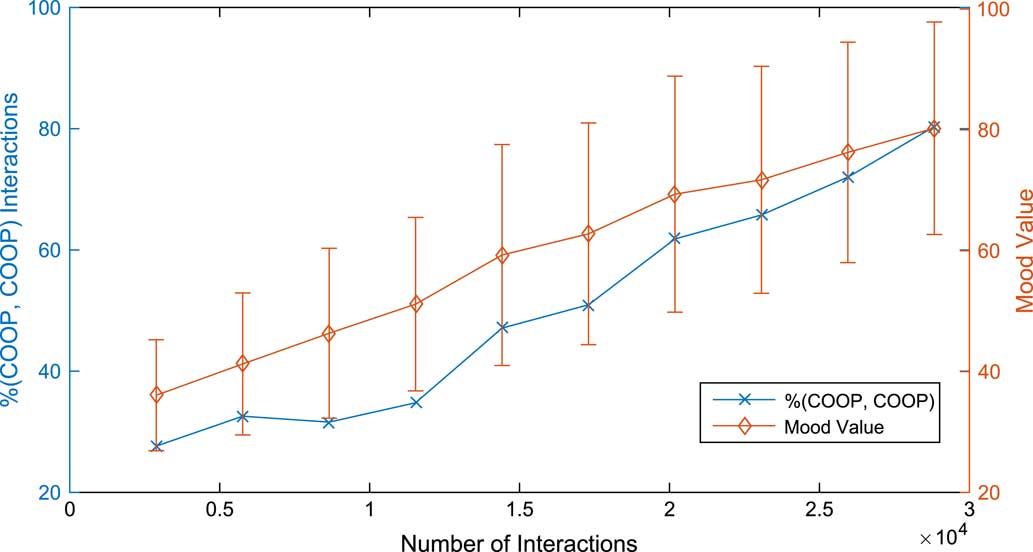
To justify our claim that the speed at which cooperation is achieved is proportional to the starting level of mood, we have plotted the average mood values against the number of (COOP, COOP) actions, as can be seen in Figure 6. We have shown this against scenario 1 as this is where the effect is most pronounced; we can see that when the cooperation between agents falls, the average mood level still rises. As cooperation rises the standard deviation of mood levels gets wider but as the standard deviation gets smaller the cooperation still rises, showing us that the low moods are rising more quickly than high moods are lowering. This shows us that the mood reflects the level of cooperation, and the higher the starting level of mood the faster cooperation is achieved.
Level of cooperation for the regular environment in scenario 1 against the average level of mood, showing how the level of mood is related to the level of cooperation
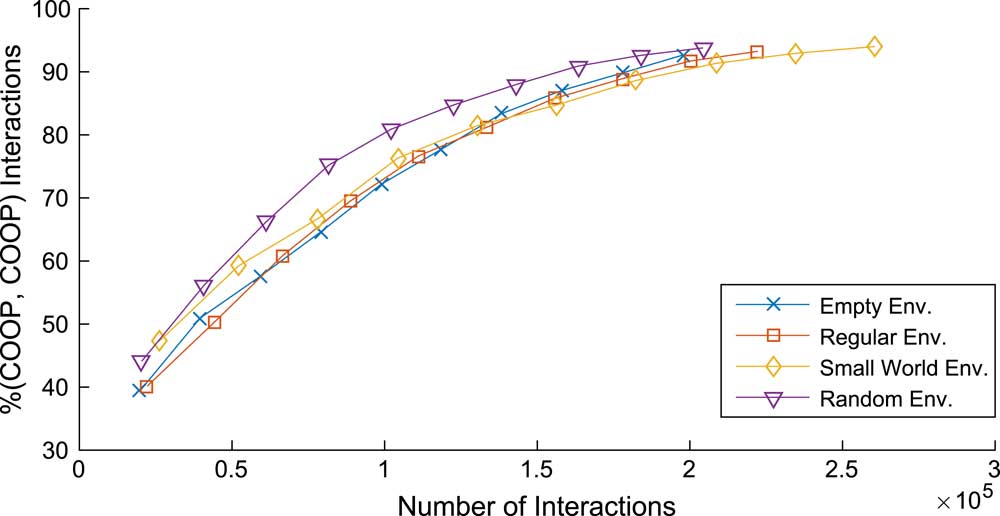
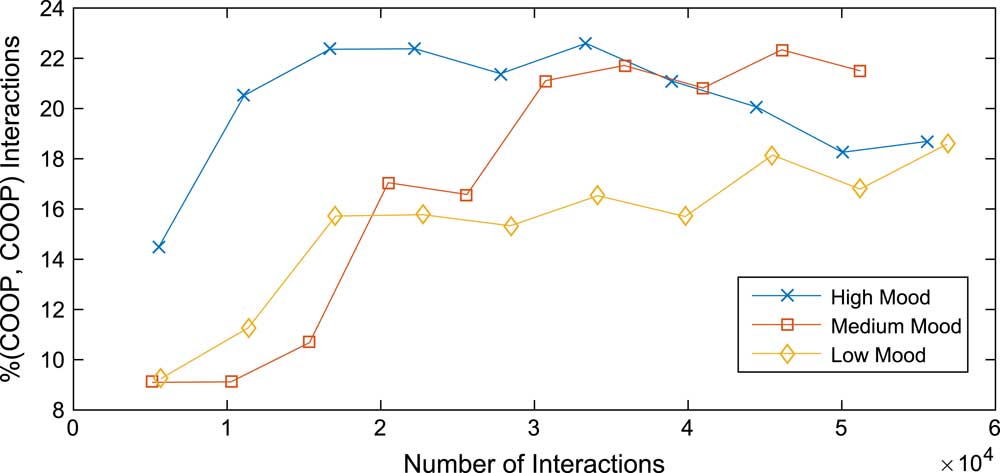
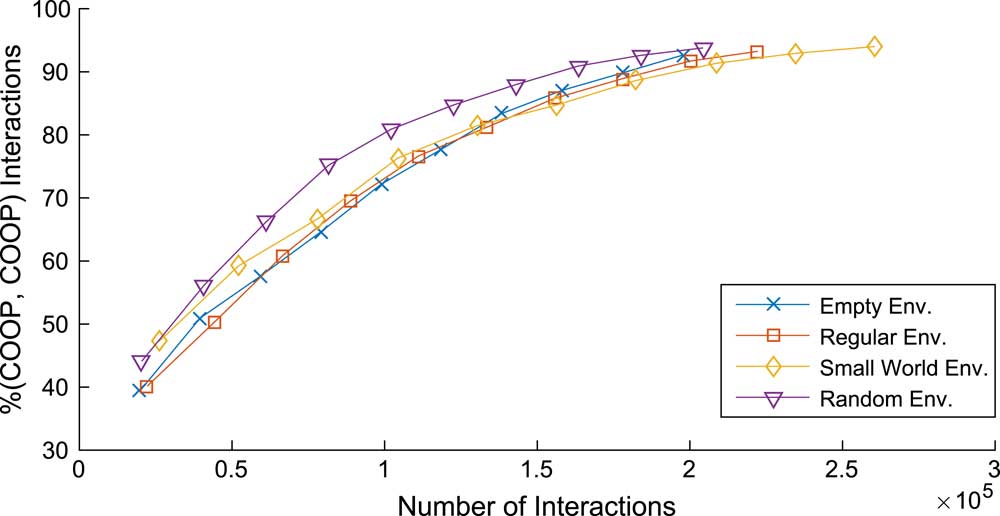
We have looked for any notable differences in environments for the mood experiment, as shown in Figure 7. While there is little difference in the regular, small-world, and empty environments, the random environment, however, achieves high levels of cooperation more quickly. We have noted how the random environment separates the agents into smaller groups which cannot interact with each other. We have also noted how there are dips in cooperation in the mood scenarios as agents with high moods meet agents with low moods, and the cooperation continues as the low moods rise more quickly than the high moods reduce. When we combine these two things we can conclude that when there are few agents with a high chance of meeting every agent in that group, the low level moods will meet the high level moods more quickly than in situations with more agents in a more open environment. This will cause the low level moods to rise more quickly in the smaller environment. In conclusion we can say that emotions enable a stable level of cooperation, and with the addition of mood can allow cooperation to flourish.
Level of cooperation for each environment in the mood experiment, highlighting the small difference in the random environment
In summary we can conclude the following:
-
∙ Cooperation is stable with emotional agents.
-
∙ Cooperation rises and is sustained with the addition of mood.
-
∙ The environment has no effect on cooperation in emotional agents.
-
∙ The smaller the group, the faster cooperation rises in emotional agents with mood.
4.4 Successful characteristics
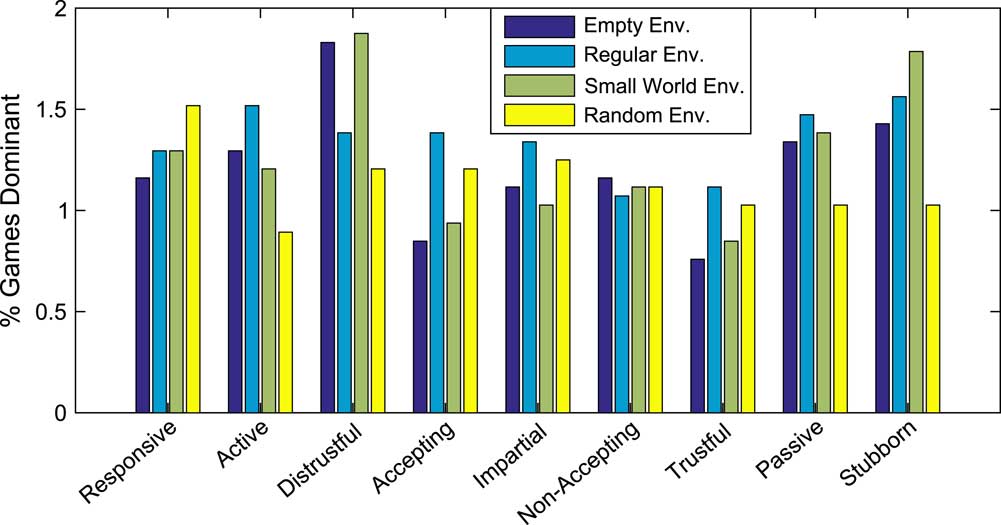
We now investigate which characters are the most successful, where success is how often a characteristic becomes dominant. Dominant characteristics have replicated so that they makeup the majority of the agents. Lloyd-Kelly et al. (Reference Lloyd-Kelly, Atkinson and Bench-Capon2012b) showed that the Trustful agent was most successful, however, when mobility was added, Collenette et al. (Reference Collenette, Atkinson, Bloembergen and Tuyls2016c) showed Active as the most successful due to the much larger range of agents played against and the few times that each agent played against each other. Figure 8 shows the results for our experiments, again we see that Trustful performs poorly. However, we can see that Distrustful is the most successful in the empty and small-world environments; Stubborn was the most successful in the regular environment and in the random environment Responsive was the most successful.
Most dominant characteristics in the emotion experiment, showing Distrustful, Stubborn, and Responsive to be the most successful
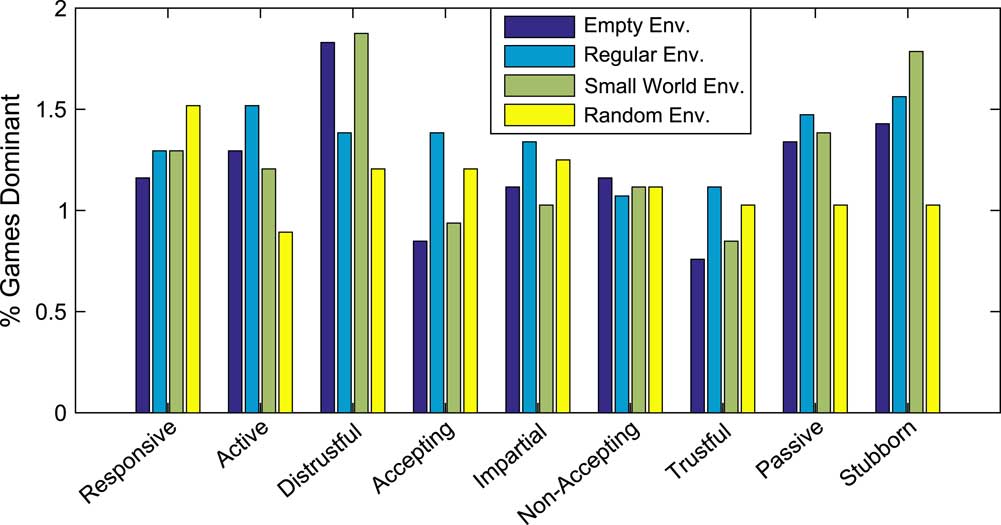
The random environment had the effect of separating the agents into groups, limiting the range of agents that could be played against. This causes the number of games with a particular agent to go up when compared to the other environments. This in turn changes the dynamic of the game as agents are able to boost their scores with mutual cooperation and prevent losses with mutual defection, unlike more open environments where this dynamic is reversed. This leads to the most successful agent being the agent which is able to place itself into mutual outcomes the quickest, which is the Responsive character.
The empty environment allows for agents to play against the largest range of agents. The dynamic here is that an agent goes against an individual agent less often than in the random environment. The most successful agents respond to cooperation slowly; this allows the agent to sucker-punch its opponent without retaliation raising its payoff quickly. Since these agents are defecting they are not open to being sucker-punched themselves. Distrustful becomes the most successful as it is able to minimize the amount of times it is on the receiving end of a sucker-punch, which lowers the payoff, as it responds to defection quickly.
The unexpected results came from the regular environment and the small-world environment, with the successful characteristics being Stubborn and Distrustful, respectively. Collenette et al. (Reference Collenette, Atkinson, Bloembergen and Tuyls2016c) reported that Active and Stubborn where the most successful in the regular environment and Active and Impartial for the small-world environment. The difference between the two most successful characteristics in the regular environment is very small in both this work and Collenette et al. (Reference Collenette, Atkinson, Bloembergen and Tuyls2016c), with the Active and Stubborn characteristics being the most successful. This leads us to conclude that Active and Stubborn are both dominant characteristics in the regular environment and the ordering comes down to random chance.
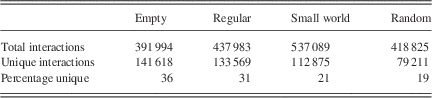
The small-world environment does not have this same outcome with our two highest performers being Distrustful and Stubborn. The highest performers are Active and Impartial in Collenette et al. (Reference Collenette, Atkinson, Bloembergen and Tuyls2016c). To see why this was the case, we looked at the number of interactions per environment as can be seen in Table 10. The small-world environment has more total interactions and less unique interactions, and a lower percentage of unique interactions than the previous work where the values were 361 682, 115 653, and 32%, respectively (Collenette et al., Reference Collenette, Atkinson, Bloembergen and Tuyls2016c).
Interaction distribution for each environment, highlighting how each environment affects the number of unique interactions

There is a physical difference in the small-world environments in this work and the previous work Collenette et al. (Reference Collenette, Atkinson, Bloembergen and Tuyls2016c). In this work we take into account the difference in available floor space between the different types of arena. Collenette et al. (Reference Collenette, Atkinson, Bloembergen and Tuyls2016c) did not take this into account so their small-world environment has more space than the regular environment. This causes the agents in our small-world environment to be more cramped as the width of the corridors is reduced. The reduced width forces the agents closer together causing them to have more interactions with the same agents. However, for the agents that do manage to move around the environment a lot, they will meet a wider range of characters leading to their situation being more like an empty environment and the most successful characteristics reflect this.
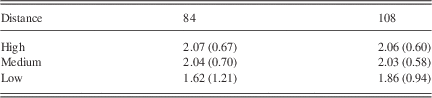
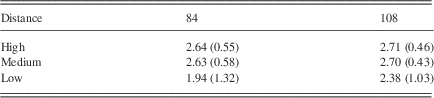
We can attribute the most successful characteristics to the agents that moved the furthest as reported by Collenette et al. (Reference Collenette, Atkinson, Bloembergen and Tuyls2016c), and when we look at our results shown in Table 11 we can see that the same applies.
Average payoffs (std. dev.) for an agent based on distance travelled in the emotion experiment, agents that moved the least achieved the least payoff

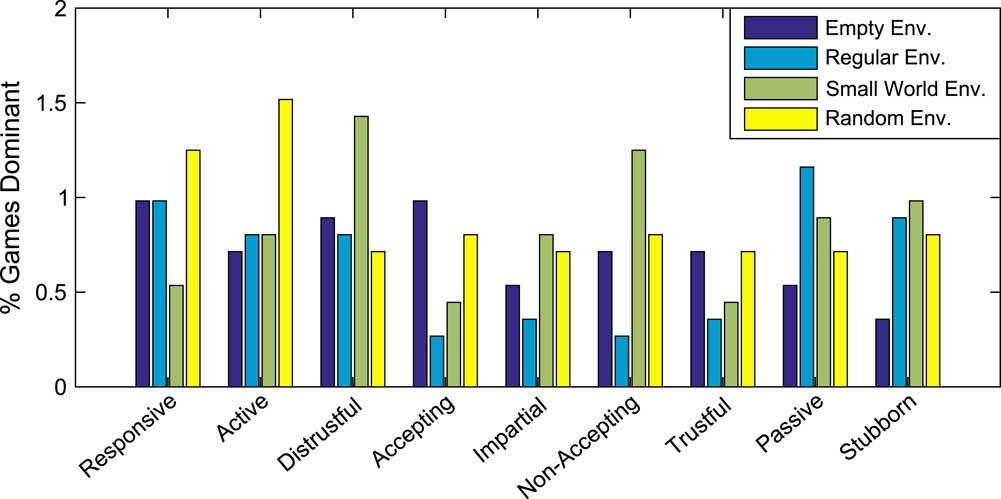
We then looked at which characteristics are most dominant in the mood experiment, as shown in Figure 9. The most notable difference is that in the mood experiments there are fewer games where there is a dominant characteristic. This was expected as the mood makes previous games affect the current game regardless of opponent so the effect of the characteristic is reduced. The unexpected aspect is that there is a clear number of characteristics which are dominant. For the different environments the dominant characteristics are: Responsive and Accepting, Passive, Distrustful, and Active for the empty, regular, small-world, and random environments, respectively.
Most dominant characteristics in the mood experiment, highlighting how the addition of mood does not stop some emotional characteristics being dominant
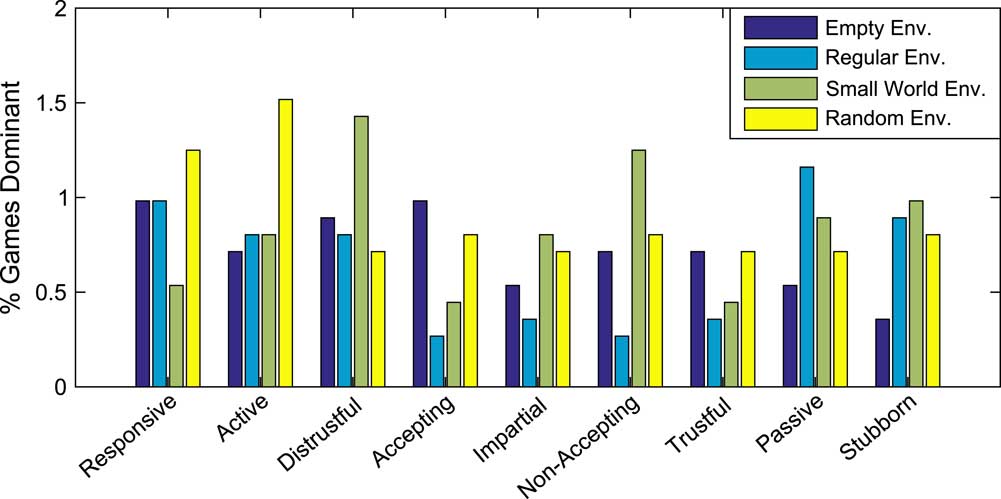
For each environment different characteristics are dominant. In the more open environments we can see that the games are closer with the characteristics becoming dominant that achieve cooperation quickly while protecting themselves from being taken advantage of. This is due to the low number of times that agents meet with the same agent. This requires the agent to protect its payoff quickly as it is unlikely to be able to punish this behaviour or force the cooperation to happen. Later in the experiment when the mood effects take place and cooperation is enforced, the difference comes at the beginning, where agents that protected their payoff do better, whether they took advantage of cooperators or cooperated to raise their payoffs. This can be seen by the dominant characteristics of Responsive and Distrustful.
When the environments become more closed, the payoffs achieved given by taking advantage early become more important, especially if the agents are able to get to other agents more quickly. We see this in the small-world environment where the dominant characteristics take the most advantage of other characteristics with Distrustful being the most dominant as it protects its payoff the most. We have seen that the regular and small-world environments are similar, however, in our experiment the regular environment acts more open due to its larger corridors. This makes the successful characteristics closer in the number of games dominant, as in the empty environment. Dominant characteristics in the regular environment react quickly to defection as previously noted, however, this environment also allows consistent interactions with the same agent. Agents that are taken advantage of by there opponents can still become dominant if they also take advantage of their opponents. This is seen by the success of the Passive, Stubborn, and Responsive characteristics.
In the random environment, the agents are more limited in the range of characters they can interact with. This closed-off environment allows the Active characteristic to become the most dominant by a wide margin. The advantage that can be achieved from defecting in this environment is reduced as the agent is likely to be punished since the chance that the agent meets the same agent again is heightened, however, a small advantage can be taken provided that the agent protects the payoff quickly by reacting to this punishment. This is seen by the success of Responsive and Active.
We have compared the differences in payoffs based on the distance moved for the mood experiment (Table 12) and the emotion experiment (Table 11). We again see that the distance moved has the same effect in the mood experiment as it does in the emotion experiment. The differences are that the payoffs in the mood experiment are higher due to the simulated mood raising every agent’s payoffs.
Average payoffs (std. dev.) for an agent based on distance in the mood experiment, agents that moved the least achieved the least payoff

In summary we can conclude the following:
-
∙ The success of a character is dependant on the shape of the environment.
-
∙ The payoffs and success of an agent and its character is dependant on the number of unique interactions, which is affected by the environment.
-
∙ The environmental effects differ when the amount of floor space is taken into account.
-
∙ The addition of mood reduces the effect of a characteristic on the final results.
-
∙ The payoffs of an agent depend upon the how many different agents it interacts with.
4.5 Density effects
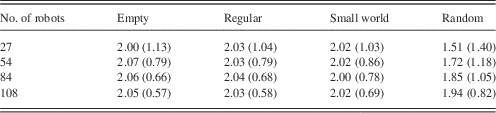
When we look at the average scores of an agent in differing densities as shown in Table 13 we can see that the payoff has a large variance. Increasing the density lowers the standard deviation. When the density increases and the number of interactions increases as well, we can see the variance in average scores becomes less pronounced. When the number of interactions is very high the agents will settle into their mutual outcomes with the majority being mutual cooperation or defection, whereas in lower densities the mutual outcomes of the agents have not been achieved, leading to a majority of mixed outcomes. When half of the agents are in mutual cooperation and the other in mutual defection, the overall average will be 2, but the mixed outcome average will be around 2.5, showing the slight dip in the average scores in higher densities.
Average payoffs (std. dev.) for an agent based on number of robots in an environment in the emotion experiment, showing how increasing the density of agents lowers the std. dev. in payoffs

Similarly in the random environment, we note the falling standard deviations and move towards an average of 2. However, due to how the random environment causes the agents to separate into different groups which do not interact with each other, this causes the average payoff to drop significantly in lower densities. This can be also be seen in the very low densities reported in Collenette et al. (Reference Collenette, Atkinson, Bloembergen and Tuyls2016c), where the agents achieved an average payoff (std. dev.) of 1.64 (1.41) and 1.24 (1.43) for the regular and small-world environments with nine agents, respectively.
Table 14 shows the average scores for scenarios 8, 11, and 14 which have differing admiration thresholds. We see that with the empty, regular, and small environments the payoffs decrease over time, whereas the random environment is stable. Collenette et al. (Reference Collenette, Atkinson, Bloembergen and Tuyls2016c) attributed the differences in environment to the number of unique interactions. This is partly reinforced despite the differences in our experiment when the average score in the regular environment is falling rather than stable and the small-world environment has a low percentage of unique interactions.
Average payoff (std. dev.) of agents based on environments and distributions of admiration levels, highlighting the how average payoffs are related to the admiration level

The effect that Collenette et al. (Reference Collenette, Atkinson, Bloembergen and Tuyls2016c) noted was that when agents interact with individual agents less often and they come to replicate using their admiration thresholds, the chance of them replicating into a characteristic which is not dominant is increased. Agents choosing to replicate a non-dominant characteristic is due to the average scores not reflecting the performance of a characteristic accurately; this then prevents the agents achieving higher scores. The effect still holds in our experiments because the number of unique interactions is around the same in the small-world environment, and increased in the regular environment when compared to the previous work. Thus, we can conclude that if the agents interact with the majority of the agents in the environment the average payoff will be highest for the high admiration thresholds. If the agents do not interact with the majority of agents, as is the case for the random environment, then the payoffs will be stable.
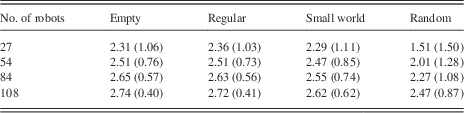
When we compare the average payoffs of agents by density in the emotion experiment (Table 13) and the mood experiment (Table 15), we can see some similarities between the two. The standard deviation decreases as more agents are added, due to the increased number of interactions this causes. The emotion experiment goes towards an average of 2, so the agents tend to be relatively stable in the averages they achieve. The mood experiment, however, goes towards an average of 3, as the mood causes the agents to choose cooperation. The more interactions there are, the more the mood will increase forcing the agents closer to the average of a (COOP, COOP) outcome, which is 3.
Average payoffs (std. dev.) for an agent based on number of robots in an environment for the mood experiment, showing how increasing the density increases the average payoff

In summary we can conclude the following:
-
∙ The size of a group of agents affects their payoff.
-
∙ The smaller the group of agents, the quicker a dominant characteristic can be identified.
-
∙ Adding more agents brings the average closer to the average that would be achieved through continuous cooperation.
4.6 Mood resilience
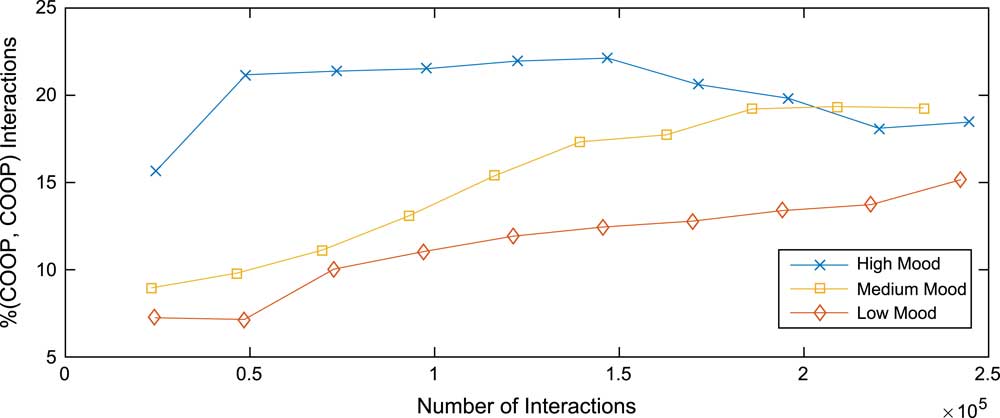
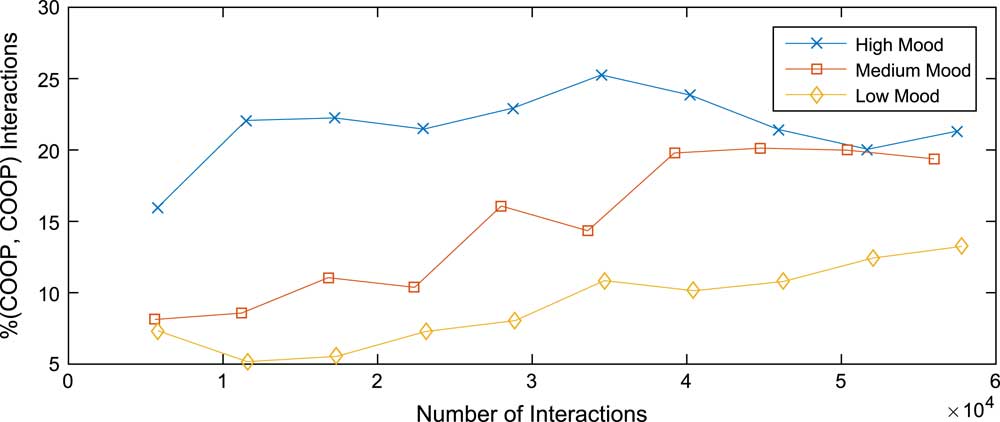
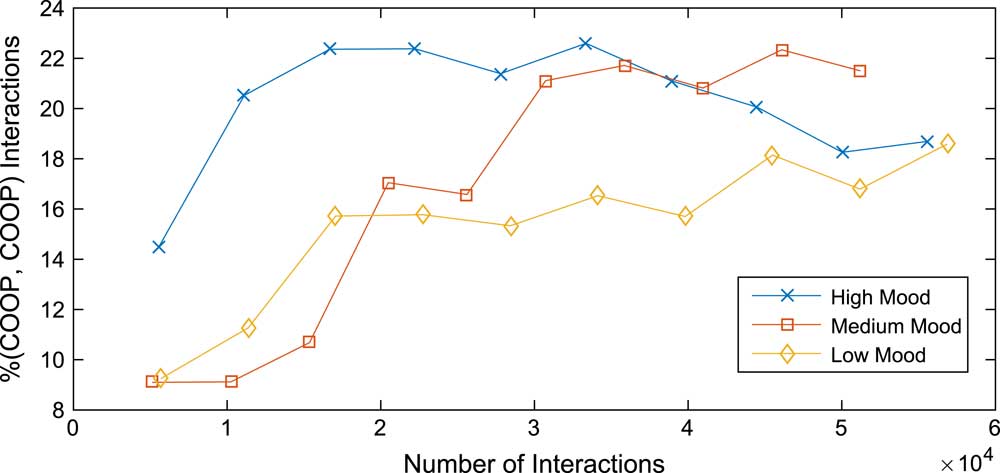
We first looked at how cooperation has been affected by the addition of pure defectors, shown in Figure 10. We can see similar effects when compared to the results reported in Collenette et al. (Reference Collenette, Atkinson, Bloembergen and Tuyls2016a). There the high mood level rises then collapses as the defectors replicate and collapse, while for medium and low moods cooperation rises despite the addition of pure defectors. The effect in this work is less pronounced than in previous work.
Levels of cooperation in the resilience experiment based on starting mood; starting with a high level of mood shows a collapse in cooperation
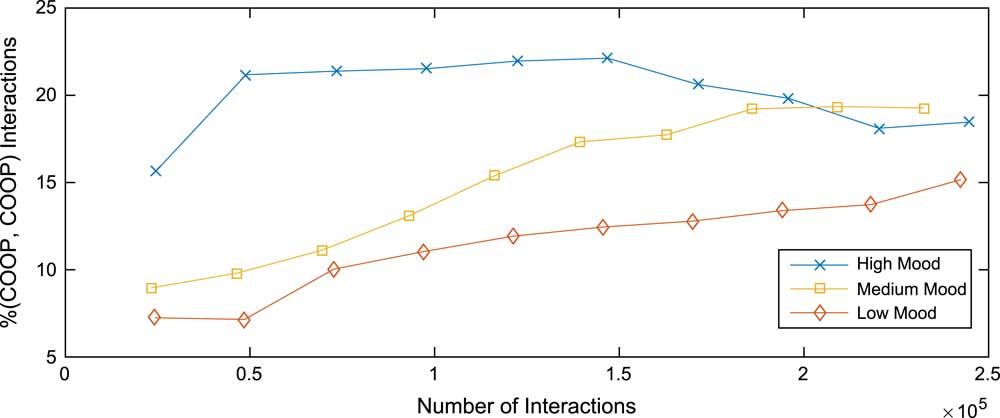
We see why the effect in this work is less pronounced when we looked at the variation in different types of environment; the random environment and the empty environment, Figures 11 and 12, respectively. In the random environment, the effect is most pronounced while in the empty environment the effect is least pronounced. This is due to the different chances of meeting defectors. In the empty environment an agent will meet more agents, making the chance of meeting a pure defector with a higher average payoff less likely. However, in the random environment where the agents are split into small groups the chance of meeting a pure defector with a higher payoff is increased.
Levels of cooperation in the resilience experiment based on starting mood for the random environment, showing a pronounced drop in cooperation
Levels of cooperation in the resilience experiment based on starting mood for the empty environment, showing a less pronounced drop in cooperation
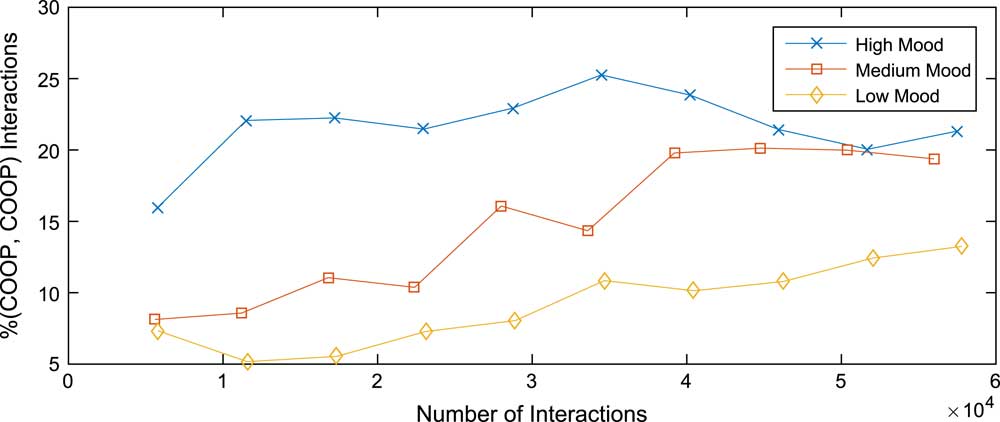
Collenette et al. (Reference Collenette, Atkinson, Bloembergen and Tuyls2016a) reported how high mood levels collapsed through pure defectors taking advantage of them. When we compare our results from the previous work of Collenette et al. (Reference Collenette, Atkinson, Bloembergen and Tuyls2016a) we can see that our results are extremely similar. High moods do not adapt quickly to the pure defectors and therefore are taken advantage of. The advantage taken then leads to the emotional agents becoming pure defectors as their average score is not high enough when compared to the pure defectors. We took the difference between average score of the defectors and the average score of the emotional agents for each starting level of mood, as shown in Table 16. From this figure we can see that the high mood difference is more than double the medium mood difference. The defectors are clearly taking advantage of the high moods the most.
Average payoffs (std. dev.) for agents in the resilience experiment with differences between emotional agents and pure defectors; the difference is larger when the mood starts at a high level

As the high moods are being taken advantage of the most, we expect that the payoffs for the defectors should be the highest when faced with the highest mood. The average scores of the defectors are also shown in Table 16 clearly shows that the defectors do the best when faced with high moods, meaning that they will replicate the fastest in the high mood scenarios. The medium and low moods do not collapse as they adapt to the newly replicated defectors through the use of their directed emotion strategy. The high moods do not do this as when the mood is very high they act as pure cooperators.
We then looked at the increase in defectors for each mood level, expecting low moods to have the smallest increase and high moods to have the highest. The results from experiment, as shown in Table 17, show an unexpected outcome: the highest increase in defectors is in the low mood levels, while medium and high mood showed expected results. We can explain why low mood levels do both the best and the worst as the standard deviation is much higher than the other mood levels. Low mood levels act closer to pure defectors which enables them to keep the payoffs of pure defectors low as they always defect so both agents will attain an average of 1. The difference comes when the low moods attempt a cooperative action; if the low mood agent attempts a cooperate action with a pure defector it raises the pure defector’s average higher than the majority of the low agents. When the replication happens the pure defectors will always replicate, causing the high increase in pure defectors. However, if the low mood agents attempt a cooperative action with the other emotional agents such that the emotional agents start cooperating, their high average prevents pure defectors from replicating as they cannot get the advantage from any of the other agents. The result is a high average increase and high standard deviation.
Average increase (std. dev.) in pure defectors for each mood level in the resilience experiment, low moods show the highest average increase in defectors

The medium moods do the best with the smallest increase in pure defectors as they are quick to adapt to the pure defectors as these agents are using the emotional aspect of their decision making. This is also an advantage in getting cooperation between other emotional agents since by using their emotional aspected of decision making are more responsive to cooperation. This allows the medium mood agents to increase their payoff between each other, which the pure defectors cannot do and since the medium moods have adapted to the pure defectors they do not replicate as often. The high moods act similarly to pure cooperators allowing pure defectors to take advantage quickly as mentioned, leading to the higher increase in defectors.
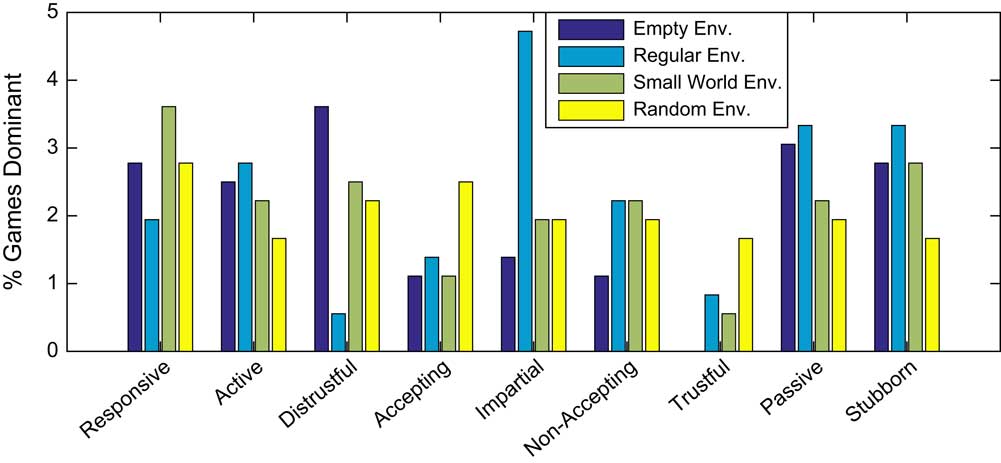
Figure 13 shows which characters are successful in the resilience experiment. In contrast to the mood experiment, the number of runs with a dominant characteristic is much higher. The defectors have an effect on the other agents’ mood, causing the agents to act more unpredictably. This allows advantages to be taken within each run by the relevant characteristics.
Dominant characteristics in the resilience experiment by environment, excluding pure defectors. The number of runs with a dominant characteristic is higher when compared to the mood scenario
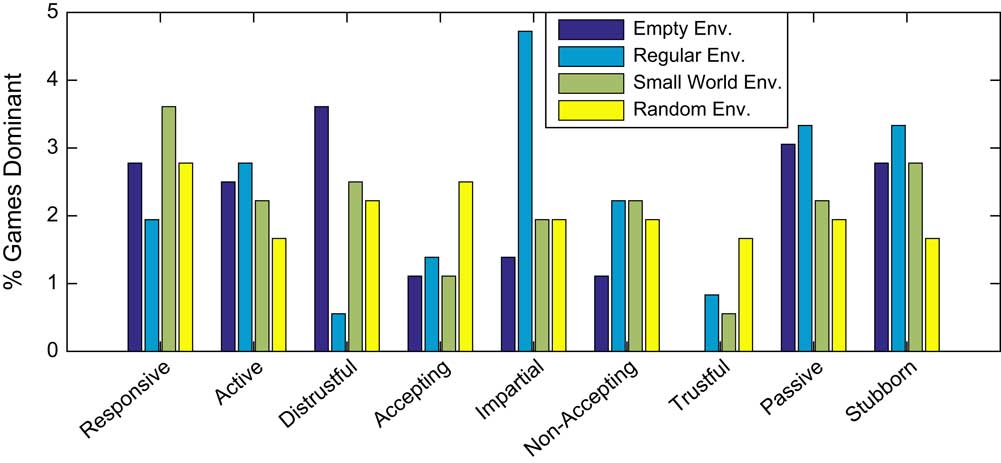
The random environment has Responsive as its most successful character, by reacting quickly to both defection and cooperation it can protect itself from the pure defectors while keeping its payoff high through cooperation. This stops the character from being taken over by the pure defectors. As the environment splits the agents into groups, there is a chance that the agents may not encounter any pure defectors. This allows different agents to be dominant in different groups within the environment which is shown by how close each characteristic is in terms of number of games dominant.
With the empty environment allowing all agents to meet other agents briefly, there is a benefit to an agent taking a more cautious approach and reacting to defection quickly to protect itself from the defectors. Additionally, reacting to cooperation slowly allows the agent to take an advantage as the defectors do. This then ensures that cooperation is likely to continue when the agent does eventually choose cooperation. So, an agent should react quickly to defection and slowly to cooperation, such as in the Distrustful character, which is reflected in the results.
The empty environment is similar to the small-world environment but with an increase of interactions between each individual agent. There is more benefit from reacting to cooperation quickly as this cooperation is likely to continue to be reciprocated with the same agent since they are more likely to interact with each other. This diminishes the advantage Distrustful has in the empty environment and allows Responsive to be the most effective.
The regular environment shows the largest difference from the other environments, due to the way agents can move around more freely than in the small world. An agent in the regular environment takes longer to get to other agents on the other side of the environment. This allows agents who take advantage to increase their payoffs as they will be meeting the same agents more frequently. As there is more freedom of movement in the regular arena than in the small-world environment, this allows cooperation to be attained, provided the agent can be assured that this cooperation will be reciprocated. By taking a balanced approach and protecting its payoff as well as taking advantage, consistently allows an agent to be successful in this environment, as shown by the success of the Impartial characteristic. We can conclude from the results that characteristics are affected by differences in environment, and that pure defectors affect which strategies are successful.
In summary we can conclude the following:
-
∙ Higher starting moods cause cooperation to come and go quickly.
-
∙ The speed of the above effect is dependent on the environment.
-
∙ The closer an agent acts like a pure defector, the closer the payoffs will be between the emotional agent with mood and the pure defector.
-
∙ The success of the pure defectors against low starting mood agents depends upon what kind of agent the low mood cooperates with.
5 Conclusion
We have expanded upon the work of Lloyd-Kelly et al. (Reference Lloyd-Kelly, Atkinson and Bench-Capon2012b) and Collenette et al. (Reference Collenette, Atkinson, Bloembergen and Tuyls2016a, Reference Collenette, Atkinson, Bloembergen and Tuyls2016b, Reference Collenette, Atkinson, Bloembergen and Tuyls2016c), by providing additional environments and adjusted these environments so that they each have the same area of floor space, while ensuring that our agents are valid for comparison. We explored the levels of cooperation for differing proportions of initial actions and initial mood levels, as well as for each arena we tested. We saw how different characteristics can become the most dominant depending on the arena they were interacting in. Finally we tested the resilience of the cooperation achieved in the mood experiments with the addition of pure defectors.
Our results show us how different environments can have an affect on the outcomes of identical experiments. From these experiments we can conclude that the type of environment needs to be considered when designing agents that will be placed in an environment where the agents can move. When designing emotional agents we have shown how the addition of mood can be used to enhance the decision-making aspect of that agent.
With emotional agents there is a point where the two agents will converge a single outcome of decisions, where the decisions of both agents will no longer change. Most agents will come to a point where they are both in either mutual cooperation or defection, while there is a specific condition to the agents being in repeating immutual outcomes. This was shown through an algorithm to calculate this mutual outcome in Collenette et al. (Reference Collenette, Atkinson, Bloembergen and Tuyls2016c), and in this work we have provided a proof for that algorithm, which allows designers of these agents to make accurate assumptions on how these agents will behave.
We have expanded the analysis of the emotional agents, and the agents with mood; by taking this deeper analysis of the agents we have seen how the two different types of agents differ and how this can affect both the cooperation of the group and which characters are successful. We have pinpointed how group size can affect these agents, as well as multiple effects that the environment can have. The deeper analysis of the resilience experiment with agents that use simulated mood have shown that low starting moods provide a strong yet brittle form of resilience to pure defectors. We have also highlighted how the characters in the resilience experiment have a more significant effect on which character is successful when compared to an experiment where all agents are using the simulated mood for their decision making.
The environments themselves have an effect on the strategies of agents, these effects are introduced by the distribution of agent interactions. These effects can been seen throughout our experiments, as the environments affect the success of different strategies and how cooperation has evolved. We have noted that these effects between the environment structures are still valid even when floor space is taken into account, however, the adjustment of floor space also has an effect and in this work we have distinguished between differences in floor space and the environment shape. We concluded in this work that there are environment effects on agents regardless of their strategy and we have highlighted the effects in the four environments that we have tested. We have shown that the individual effects the environments had were due to how the environment shape affects the range of agents the whole society interacts with. More open environments support a large range and less open environments support a smaller range.
To further expand on this work, an analysis on the intermediate states between the empty and random environments will allow us to expand and clarify the differences that these environments have on the results. An increase in the number of emotions modelled from the OCC model is an aspect that needs further investigation. The mood model can be expanded by implementing the model into a reinforcement learning approach. This will allow us to show how the model can be used with a different underlying decision model and see what improvements this may bring. Finally as these models have been conducted using the Prisoner’s Dilemma, the work can also be applied to other social dilemmas to see if the same aspects of the model hold. Additionally, there is an interest to see if these models can be shown to be part of a mixed evolutionary stable strategy.