


INTRODUCTION
The number of rats in any particular habitat is dependent on the physical and biological conditions of that habitat with more favourable environments supporting more rats [Reference Davis1]. The rat population in an environment will grow to reach the ‘carrying capacity’ (i.e. the number of rats the habitat can support) of that environment which will be dependent on several limiting factors. The population may fluctuate due to changes in the limiting factors. The enclosed environment in sewers can be broadly classified by six of these factors: food, water, harbourage, parasites/disease, predators, and competitors. All of these factors have the potential to regulate the population size in some way.
Rats require ∼28 g dry food and 14–28 g water daily [Reference Brooks2]. As water is abundant in sewers, it is suggested that food and harbourage (a secure place to sleep and breed) primarily limit the natural populations of rats while the effects of competition and disease play a regulatory role. Rats are thought to find food near cafés, markets and in older sewers with poor self-cleaning where food particles often accumulate [Reference Bentley3]. Old sewers and drains; the so-called ‘Victorian sewers’ that are in bad repair or with redundant connections not sealed-off can provide harbourage, as can poorly maintained (private/domestic) systems with faults that allow rats to burrow into the surrounding earth. Modern pipework and sewer design practice, on the other hand, are thought to present smoother, less hospitable surfaces with fewer faults and hence thought to offer fewer food and harbourage opportunities [Reference Bentley3].
Rat populations are likely to be affected by a wide array of parasites, diseases and also by interactions with other rats (i.e. intra-specific competition). These factors are generally termed density dependent meaning that their effect is higher at high population densities. In rodents, intra-specific competition is thought to be one of the most important of all density-dependent factors [Reference Davis1, Reference Brooks2] and high population densities can lead to increased aggression, mortality, nest destruction and nest abandonment [Reference Brooks2, Reference Andrews, Belknap and Keenan4].
In UK sewers, with the exception of human sewer baiting with poison, rats do not have predators. Furthermore, there is concern about the effectiveness of some current sewer baiting practices. Barnett & Bathard [Reference Barnett and Bathard5] found that sewer rat population levels reached pre-baiting levels 6 months after baiting to near extinction. This is likely to be due to one or more of the following: re-invasion from the surface, re-invasion from contiguous systems and breeding by rats that survived the poison treatment. It is likely that baiting will result in a decrease in intra-specific competition that will subsequently result in an increased supply of food and harbourage for any rats surviving the treatment. As a result, juvenile survival will tend to increase until the carrying capacity of the environment is reached and competition again increases [Reference Barnett and Spencer6].
More recently, one of the authors of this study (D.C.) found a declining sewer population in the same area, whilst conducting a long-term study [Reference Channon, Cole and Cole7]. This indicates that either intra-specific competition may not be such an important factor as was previously thought or, that available resources within the system are declining thus preventing recovery to previous levels. If baiting has little long-term effect and the other limiting factors exercise their ordinary influence, the distribution of rats within the sewerage system should reflect these other factors in some way.
Given that the subterranean environment is not homogenous across the whole sewerage network and that favourable locations occur irregularly where favourable factors combine, the distribution of rats should not be random and even aggregated in more favourable locations. These locations ought to show rodent activity year after year and could thus be termed rodent ‘hotspots’.
If hotspots are thus identified, this should reflect in some way the balance of the foregoing limiting factors and should allow the focusing of resources to control or eliminate the problem of having rats and inter alia a potential source of disease transmission close to human housing.
Rats, worldwide, are noted carriers of a variety of diseases [Reference Gratz and Ptrakesh8]. In the United Kingdom, Webster & Macdonald [Reference Webster and Macdonald9] found a total of 13 zoonotic and 10 non-zoonotic disease species in a sample of 509 surface-trapped specimens. Whilst many of these diseases may limit their numbers, their potential role in transmitting them to humans should not be underestimated and the potential of sewers as a possible source of disease needs to be understood. The potential for populations of rats to harbour and transmit diseases to humans remains high and the existence of commensal rodents in close proximity to human dwellings, remains a cause for concern and requires a better understanding of them.
The objective of this study was to establish whether hotspot areas existed or not. We worked from the null hypothesis that rodents should be evenly distributed throughout the sewer network.
METHODS
The data used were street manhole sewer-baiting records collected over the period between 1986 and 2001 from the London Borough of Enfield (Enfield) and 1986–90 from the London Borough of Barnet (Barnet) and the Royal Borough of Kensington and Chelsea (RBKC). Manholes were baited with Warfarin (Sewarin P; Killgerm Chemicals Ltd, Ossett, W. Yorkshire, UK) laid above the flow on the benching in the early years and Brodifacoum (Brodifacoum sewer bait; Killgerm Chemicals Ltd) in later years. The data selected were the results of the first inspection between 7 and 10 days following the placement of rodent baits in sewer manholes. Complete or partial consumption of the bait was taken to indicate the presence of rats. It is not possible, from the data, to determine exactly how many individual rats there were and we looked for presence not abundance.
The raw data consisted of over 53 000 records from Enfield, 27 000 records from Barnet and 20 000 records from RBKC. The number of manholes baited varies from year to year. No account has been taken of weather conditions or time of year in any individual year. The majority of the data were collected during the winter months.
The data were entered on an Excel spreadsheet (Microsoft Corp., Redmond, WA, USA) and subjected to a weighted analysis allowing for the number of manholes per square and the varying total rat population from year to year. Because the data were handled in a different way and it was not possible to accurately assign some of it to grid squares, the numbers used will vary slightly from those given above. It was felt that, given the robustness of the original data and the large dataset involved, this would not have any impact on the overall results.
Each borough was divided into grid squares corresponding with those found on Ordnance Survey (OS) maps [10]. Each square was given an alpha-numeric identity to enable data attribution.
Thames Water provided, on request, a printed asset map of each square showing the location of all the manholes within that square. The number of foul water manholes was counted and added to an Excel spreadsheet. This process was repeated for each of the 15 years on the Enfield data and for the 5 years of the Barnet and the RBKC data. Not every area within each borough was baited every year. RBKC had multiple baitings, eight within 5 years. Of these, the winter sets have been selected since these are common to the other datasets.
The sewer baiting records for each year were examined and the takes for each location were cross referenced against the appropriate asset map squares and entered into the spreadsheet. We also entered, for each square, the number of takes and calculated the proportion. Not every take was clearly assignable to a specific square, since some streets spanned several squares and as previously mentioned, the doubtful ones were omitted from the data used. Despite this, the amount of viable data was not markedly reduced.
In some years, more manholes were baited than in others, and the results overall were weighted to ensure that their interpretation for these years did not cause distortions.
To look at each year's results in isolation, we used a binomial test [Reference Hollander and Wolfe11] to compare the observed number of takes in each square kilometre with the expected number (i.e. assuming an equal chance of finding a take in all manholes). A large number of squares were significant. The test was, therefore, repeated more stringently to identify squares with, for example, five times the average number. Since there were hundreds of tests (one for each square kilometre), the Bonferroni correction [Reference Senn12] was applied which makes the results particularly rigorous. There were 250 km2 in Enfield, 340 km2 in Barnet and 66 km2 in RBKC containing sewers. Without the correction there would be a 1 in 20 chance of the result for any particular square being wrong and so in Enfield this could lead to wrong results in about 12 or 13 squares. However, using the correction, there was only a 1 in 20 chance of any one square in the whole grid being wrong. In terms of P values, a P value of say 0·0001 for a square in Enfield was multiplied by 250 to get 0·0250 and this was considered significant as it was <0·05.
The data were plotted as an area graph where each square represented the corresponding area on the OS map. There were areas of parkland that had no sewers and areas of housing which had no recorded takes. These are shown as background level shading (refer to chart legends in the Appendix). Those areas that had high takes in a particular year are represented by different shadings for the number of years involved. Those that showed consistent returns were examined to see whether this could be a chance event or whether the results showed a statistical pattern, i.e. if locations were found that consistently showed rodent activity year on year. Some of these areas were visited to see whether there was anything peculiar about the age or type of surface buildings that might give a clue to their attractiveness. If such an area were found, Thames Water would be approached to see whether the age or condition of the sewers beneath might provide a clue.
We checked for correlation between manhole density and hotspots using the non-parametric Spearman's rank correlation test (For low density, i.e. 1–11 manholes per grid square, we calculated the average number of years where the incidence of takes was more than five times the expected value. This was repeated for four higher density levels to provide five pairs of data for the test).
Further charts were produced showing the distribution of rodents throughout the system at greater than five times the expected value (see Appendix: Figs 3, 4, 5). The expected value was derived from the total number of takes, divided by the total number of manholes, multiplied by 100. The measurement was now the number of years at which high activity was seen. Because of its complexity the binomial test was replaced by a multinomial test [Reference Evans, Hastings and Peacock13]. Significance was set at the 0·05 level, giving five chances in 100 of the hypothesis being wrong. Testing for more than five times greater than average is far more stringent than testing to see if numbers are just greater than average, making the results very robust.
Enquiries were made with Thames Water engineers concerning the age and amount of maintenance or improvement work carried out in areas of Enfield where hotspots were found. The London Borough of Barnet is adjacent to the London Borough of Enfield and is similar in terms of size, range of housing densities, housing ages and sewer construction dates. We chose to include the 5 years of data for this borough in the study to test whether any result found for the London Borough of Enfield was replicated in other similar boroughs or was an artefact of some factor peculiar to that borough alone.
RBKC is quite a small London borough in terms of surface area and the construction of its sewers dates back to the beginning of the last century and earlier. The human population density is quite high and it is an ‘inner city’ borough. We included the data in the study in order to see whether any effect found in the Enfield data (an ‘outer city’ borough) would be replicated in the inner city. We struggled to format the RBKC data in a way that would fit into the study because the borough had eight baiting cycles in the five comparison years. Even though we selected the first in each year's data only, we cannot discount the possibility that later baiting cycles had an effect upon the subsequent year's figures. We feel that, as a consequence of removing nearly three-eighths of the data, the picture that emerges from RBKC is not as clear as it might be. However, since we were only using the data to corroborate the existence or not of hotspots in inner city areas, we feel that it is sufficiently robust to clarify this point. We did not apply the Spearman test to RBKC and Barnet because each only had a 5-year dataset.
Within the tests, the null hypothesis was that rats would be equally likely to be found in each manhole within the system. It was important to determine how often annual baiting recorded their presence or activity at each manhole.
The data for the early years were not collected for the research and statistical tests that we subsequently applied. We recognize that inconsistencies exist and have applied weighting and other statistical measures to diminish their effect. In view of the very large number of records examined, we feel that the chances of a spurious effect being revealed (despite the foregoing acknowledged shortcomings) are very low.
RESULTS
Those areas that had high takes in a particular year are represented by different shadings for the number of years involved (Figs 3, 4, 5). Those that show a statistically significant level are marked ‘SIG’Footnote †. We found a number of squares for each year which were significantly greater than average and a smaller number which were more than five times significantly greater than average. We did not expect to find significance in squares with only a few manholes because they have a low weighting in the analysis. There is significance in a few such squares and these relate to particularly high takes.
London Borough of Enfield
We chose to include the 15 years of data for this borough because it was the largest single dataset of sewer baiting records that we had access to at the time and we already had an idea of rat population trends from the 13-year study [Reference Channon, Cole and Cole7].
A chart was produced showing the distribution of manholes throughout the system in Enfield (Fig. 1). The chart is a graphical representation of the borough in squares. The large faintly speckled area in the upper left of the map is an area of parkland with no sewers or manholes. The different shadings show the number of manholes in the square. The density of manholes is clearly non-uniform hence the weighting we used to allow for this factor.
On these charts, not all highlighted squares (i.e. with dark shading) are denoted significant. This is because the statistical tests assigned lower weighting to squares where there were a low number of manholes within the square. Those that remain show clearly that hotspots do occur.
Charts were produced for each of the 15 years in isolation but only the one for 1987 is presented here as an example (Fig. 2). The different shadings show the density of rat activity (expressed as number of bait takes per 100 manholes). In 1987 seven squares showed significantly high activity (using the binomial test). The main chart covers all 15 years together (Fig. 3) and counts squares with more than five times the average level of activity. The different shadings show the number of years where a high proportion of takes was found at that level. This was significant for five squares and so count as hotspots (using a multinomial test).
Perhaps it would be useful to focus on one hotspot square (Enfield K,18) and explain the result (see Table). This is a significant square marked ‘17×’ in Figure 2. In 1987 it had 23 takes from 30 manholes=76·7/100 manholes. The average for Enfield that year was 2·4/100 manholes, which is the expected value for a random distribution; thus, this square had 32 times the average. The P value for this square is extremely small (P<0·0001). Even if the average rate were 17 times as high this square would still be significant (P<0·0001, or P=0·021 after the Bonferroni correction) and so we say that there were significantly more than 17 times the expected number of takes in this square (This is essentially the same as producing a 95% confidence interval.).
Enfield square K,18 data showing years with greater than five times average activity
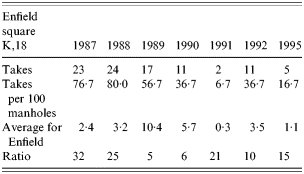
This square is also significant in Figure 3 (bottom left corner marked ‘SIG’) and has a dark shading (cross-hatched) on the chart because in 7 years it had more than five times the average takes (1987, 1988, 1989, 1990, 1991, 1992, 1995). In 1987, for example, this square has 32 times the average which, being more than five times the average, is counted for 1987. In other years the relative number of takes was not so high but is still more than five times the average. This square is significant (P<0·0001 after the Bonferroni correction) and so counts as a hotspot.
The age of sewer does not seem to have been a factor. Construction dates ranged from 1912 to 1974 with a large proportion in the 1930s. The dates reflected, for the most part, when those areas of housing had originally been constructed. Maintenance records were not available in a format that easily related to the way the statistical data was examined, in that renewals crossed the boundaries of many squares. Repair works may either have spanned several squares or be too localized to have had any overall impact on an area the size of the square.
There does not appear to be a confirmed link between the density of manholes in an area and the presence of rats. The density of manholes tends to reflect the density of housing and spacing of streets and is a function of the number of individual connections that the builders wanted to make to the sewerage system. Even though there were more subterranean pipes and connections in some blocks than others, this did not necessarily mean that there was more rodent activity there.
We checked for correlation between manhole density and hotspots in Enfield using Spearman's rank correlation test. Considerable significance is shown (p<0·001) but the magnitude (0·43 at best) is not high. Values of ⩾0·7 are to be preferred.
London Borough of Barnet
The results quite conclusively show that the effect is not confined to Enfield alone and appears in a similar manner in the London Borough of Barnet.
A chart was produced showing greater than five times expected value. This shows clearly that hotspots do occur. The different shadings show the number of years where a high proportion of takes was found. Please note that, on the shading scale on the figure, only light-speckling (1 year) through to vertical hatching (5 years) are utilized since there are only 5 years to the Barnet dataset.
A number of hotspots are apparent and of key interest are the ‘SIG’ squares which have more than five times expected values over 4 years. Hotspots seem to be clustered in one part of the borough on high ground (Fig. 4).
Royal Borough of Kensington & Chelsea
Squares were made using the same criteria as before and the data was examined in the same way. Charts were produced showing five times the expected value (Fig. 5). It can be seen from this chart that significant results were found in eight squares demonstrating that hotspots occur in RBKC too and this is not a feature confined to the more suburban boroughs. Note that the significant squares for RBKC all relate to only 1 year with more than five times the expected number of takes and, thus, that we have not found a year-on-year effect using this criterion. However, using the weaker criterion of number of years with more than 1½ times the expected number (not illustrated), there is one significant square relating to high activity in all 5 years and two significant squares relating to high activity in 2 years. Thus, we conclude that there is evidence, albeit weaker, for hotspots in RBKC.
DISCUSSION
It is clear that hotspots occurred in all boroughs although the evidence is stronger in Enfield and Barnet than RBKC. The number of statistically significant results found means that the null hypothesis that rodents are evenly distributed amongst the manholes must, therefore, be firmly rejected. There is clear evidence that rodents are not evenly or randomly distributed within sewerage systems. We cannot point to the exact number of rodents involved but we can clearly see that, even having discounted areas with low manhole numbers, for whatever reason, some areas of the sewerage network provide an ongoing attraction for rodents year after year whilst others rarely, if ever, exhibit activity.
There is no current simple (single factor) evidence to link the hotspots with the age of sewers or the type of human housing or activity. It may be that a combination of factors plays a part but it was not possible to explore that further within this study. There is a tendency in the contemporary press, to link higher housing density with Victorian (1837–1901) sewer systems then to link these with age-related defects and these with rodent infestation. Langton et al. [Reference Langton, Cowan and Meyer14] seemed to find the opposite on the surface, in that houses on plots larger than themselves were more likely to have rat infestations than those packed more closely together in terraces.
There is some significant evidence to link hotspots with areas with high manhole density. The results for the Spearman's test are not definitive. We, therefore, restrict ourselves to saying that there tend to be more hotspots in areas of higher manhole density. However, the reasons for the link need to be fully explored and the data refined before proceeding further. More of the variance is unexplained than is explained, leading us to conclude that there are other factors remaining to be identified. One factor, which did change over the time-scale, was continuing maintenance of and repairs/improvements to the sewer system which may be mechanically decreasing the rat-carrying capacity of the system. If repair and renewal is an effect, one indicator one would expect to see, is a decrease in numbers over the time-scale of the study and this has occurred [Reference Barnett and Spencer6] although it is not thought to be a sole cause. There are, however, areas of high manhole density which do not show as hotspots.
Although there were areas of Victorian housing within the study area, they were not amongst those that exhibited hotspots. Since hotspots occurred in areas that were built in post-Victorian times, it seems clear that the popular perception of Victorian sewers as a sole root cause of rat problems may well be erroneous (and they were not a factor of any significance in this study). Thames Water have highlighted that <3% of the total network London-wide consisted of pipework built in this period. So it is little surprise that there was no noted effect.
In the event, we have been unable thus far to point to any other particular (single) surface feature that might be a common factor other than its height above sea level. There seems to be a common factor for instance, amongst those examined in the lower right-hand quadrant of Barnet in that they all surround a valley and the hotspots occur only on the high ground. There is, therefore, some cross-borough evidence to suggest that the rodents occur in sewers on higher ground. Street locations were checked on an OS map but it proved impossible in the case of RBKC to read much into the contour lines since large parts were in the 10–20 m range with little differentiation visible. The colour for housing on the OS map and the contour line colour blend into each other making it impossible to read heights from the OS map. In any event, it is unlikely that heights would not vary somewhat across squares the size we have chosen to base the study on. Therefore, the suggestion that height is a factor can only be a general one and further work would be needed and the source data revisited on a different basis, to establish whether this really is a major factor. There are areas of high ground without hotspots. If there are factors such as surcharging (system flooding) controlling rodents in lower lying areas, these factors appear to be more effective that the use of poison baits in that these are often the areas which do not display hotspots. Despite poison baiting, the areas identified as hotspots exhibited activity year after year suggesting that the baiting had little long-term effect.
The results of this study suggest that an examination and comparison of the construction of the sewers in low-density and hotspot areas might lead to a design improvement which is more hostile to rodent presence. Investment in sewer improvements from this basis would give the combined benefits of reducing the pest population and its associated disease risks as well as reducing the amount of pesticides finding their way into the waste-water system.
The 13-year study [Reference Barnett and Spencer6], which monitors rodent numbers in Enfield, highlights a continuing decline in numbers and points to infrastructure repairs as a possible cause. This study, which uses much of the same dataset alongside fresh data, appears to support this view.
ACKNOWLEDGEMENTS
We acknowledge the financial and technical support of Thames Water PLC in sponsoring this work and providing access to the areas and records concerned, Julia Verity for data collection and Britta Chesser for background support.
5. APPENDIX
Area map of Enfield showing number of manholes per grid and baiting areas.

Enfield squares showing levels of significance. Expected value is total number of hits divided by number of manholes ×100 (17× means that there were significantly more than 17 times the expected number of takes in this square).

Enfield squares showing greater than five times average significance. Expected value is total number of hits divided by number of manholes ×100 (true alpha=0·0500).

Barnet squares showing greater than five times significance. Expected value is total number of hits divided by number of manholes ×100.

RBKC squares showing greater than five times significance. Expected value is total number of hits divided by number of manholes ×100 (true alpha=0·0132).



