Osteoporosis places a substantial medical and economic burden on patients and their families (Reference Reginster and Burlet1). Osteoporosis is the most prevalent bone disease in the United States (U.S.). It currently affects 55 percent of the population aged 55 and older, 80 percent of whom are women (Reference Burge, Dawson-Hughes and Solomon2). The incidence of this disease is projected to increase as the population ages, placing millions of Americans at an increased risk of fracture that negatively affects their quality of life and may lead to disability and loss of independence (Reference Vincent and Velkoff3;Reference Silverman4). In addition, osteoporosis is associated with a substantial economic burden for the patient, the society and the healthcare system at large (Reference Robitaille, Yoon and Moore5;Reference Viswanathan, Curtis, Yu and White6).
The global osteoporosis drug market reached US$8.4 billion in 2013, and it is estimated to reach US$8.9 billion by 2020 (7). An estimated 63.0 percent of the worldwide osteoporosis market share is held by five pharmaceutical companies (7). In the United States, an estimated 2.4 million patients were on osteoporosis drugs in 2012 (8). The annual healthcare expenditures on the treatment of osteoporotic related fractures amounted $19 billion in the United States (Reference Burge, Dawson-Hughes and Solomon2;9). In the United States, outpatient pharmaceutical expenditures reached US$250.9 billion in 2014 (10). Private insurance and out-of-pocked payments represented 42.8 percent and 15.0 percent, respectively. Medicaid, the publicly funded program for low income individuals, and Medicare, the federal program for the elderly, disable and end-stage renal disease patients, covered 29.0 percent and 9.2 percent, respectively, of the outpatient pharmaceutical expenditures.
Since the U.S. Food and Drug Administration (FDA) approval of alendronate in 1995, the number of pharmaceutical products available for the prevention and treatment of osteoporosis have increased significantly. FDA approved pharmaceuticals for the prevention and management of osteoporosis include bisphosphonates, selective estrogen receptor modulators (SERMs), receptor activator of nuclear factor kappa-B ligand (RANKL inhibitors), and parathyroid hormone (Reference Warriner and Saag11;Reference Parthan, Kruse and Yurgin12). Hormone replacement therapy (HRT) and calcitonin are also available in the U.S. market for patients that cannot use other alternatives. Osteoporosis drugs differ in their safety and efficacy profile and also in its cost. Pharmaceuticals are a major cost of health care especially for chronic diseases such as osteoporosis (13). Thus, pharmaceutical prices are a concern to patients and healthcare payers.
Information about final net prices paid in the pharmaceutical market for osteoporosis drugs is not publically available. Additionally, different payers end up paying different prices for the same drug (Reference Gencarelli14). Several price benchmarks are available to account for differences in prices paid by different purchasers in the United States. The average wholesale price (AWP) has long been the most commonly used benchmark price for establishing pharmacy reimbursement rates for brand pharmaceuticals between payers and retail pharmacies (Reference Curtiss, Lettrich and Fairman15). However, the AWP is set by the pharmaceutical sponsor companies and does not represent the actual transaction cost.
The Centers for Medicare & Medicaid Services (CMS) establishes a Federal Upper Limit (FUL) price (i.e., federal maximum allowable cost for generic drugs in the Medicaid program) for a drug when: (i) all formulations of a drug have been rated as therapeutically equivalent by the FDA; (ii) three or more versions of the drug have been rated therapeutically and pharmaceutically equivalent by the FDA, and (iii) the drug has at least three suppliers for sale nationally (16;17). The FUL is set at 150 percent of the manufacturer published AWP for the least costly therapeutically equivalent product that can be purchased by pharmacists. The Patient Protection and Affordable Care Act (ACA) signed into law on March 23, 2010, modified the previous FUL regulations. Effective October 1, 2010, the FUL is estimated at 175 percent of the sales-volume-weighted average of the reported monthly average manufacturer prices (AMPs) for drugs available for purchasing by community pharmacies on a nationwide basis. The CMS has issued draft AMP-based FUL reimbursement files based on the most recently reported monthly AMP (18;Reference Affairs19).
The CMS survey of the National Average Drug Acquisition Cost (NADAC) includes drug acquisition cost paid by chain and independent retail community pharmacies in all fifty states and the District of Columbia for all outpatient drugs covered by Medicaid (17;20).
The Federal Supply Schedule (FSS) is a multi-year contract available for drug purchases by Federal Government agencies. The FSS does not apply to drugs purchased by the Medicaid or Medicare programs. Pharmaceutical companies provide a discount to the Federal Government based on the lowest prices charged to private sector customers. Price negotiations may further reduce FSS prices (Reference Affairs19;21).
Despite the economic burden of osteoporosis drugs, no studies have assessed price differences among osteoporosis drugs approved for marketing in the United States. The objectives of this study were to assess trends in manufacturer listed prices of osteoporosis drugs in the United States in the period 1988–2014, evaluate price differences between brand and generic drugs, compare pricing structure of different drugs available in the market, and evaluate price trends before and after osteoporosis generic drugs entry into the U.S. market.
METHODS
Data for osteoporosis drugs approved by the FDA were derived from the FDA databases “Approved Drug Products with Therapeutic Equivalence Evaluations” (Orange Book) and Drugs@FDA. Study data collected included the application and product number, approval date, generic and brand name, route of administration, dosage form, strength, market status, active ingredient, and pharmaceutical sponsor company.
Osteoporosis drug therapeutic subclasses were obtained from the World Health Organization Collaborating Centre for Drug Statistics Methodology Anatomical Therapeutic Chemical (ATC) classification system (16;20). Average wholesale prices (AWPs), wholesale acquisition costs (WACs) and Federal Upper Limits (FUL) per unit were collected from the RedBook (Truven Health Analytics) (18;21).
Information collected from the RedBook for each NDC included the following: product name, deactivated status and date, active ingredient, manufacturer/distributor, generic name, national drug code (NDC) identifier, dosage form, strength, route of administration, package size, unit dose, AWP per unit and effective date, WAC per unit and effective date, direct price per unit and effective date, FUL per unit and effective date.
FUL prices (i.e., federal maximum allowable cost for generic drugs in the Medicaid program) were collected from the CMS (16;17). The FUL information collected included: drug active ingredient, strength, dosage, administration route, ACA FUL, and weighted average AMP.
Study data also included information derived from the CMS NADAC survey including the NDC description, NDC, NADAC per unit price and effective date, pricing unit, generic drug NADAC per unit price and corresponding generic drug price effective date (17;20).
Price data were also collected from the FSS (16;18). Information collected from the FSS included the NDC, package size, contract number, vendor, generic and trade name, and FSS price. The FSS also contains the same information for drug prices negotiated by the Department of Veterans Affairs, the Department of Defense, the Public Health Service, and the Coast Guard (the Big Four).
All drug units (e.g., tablets, capsules, injections) were converted to defined daily doses (i.e., a standardized unit for analysis of usage of different drugs/formulations/strengths) using the World Health Organization Anatomical Therapeutic Chemical/Defined Daily Dose (WHO ATC/DDD) index (16;20). Prices were converted to 2014 year U.S. dollars using the Consumer Price Index-All Urban Consumers (CPI-U) (22).
Descriptive statistics were performed for the variables included in the analysis. The AWP compound annual growth rate (CAGR) for each osteoporosis drug was calculated from approval to date of RedBook deactivation or December 31, 2014. The CAGR was used to compare the year-over-year drug price growth rate over different time periods. Comparisons of drug prices from the different data sources were performed using the AWP as the reference for price comparisons. Multilinear regression analysis was conducted to assess associations between changes of osteoporosis drug prices and time. In addition, a segmented linear regression analysis was performed to evaluate changes in prices of osteoporosis drugs after generic market entry. To measure the short- and long-term effect of generic entry on prices of osteoporosis drug, the difference in the slope (trend) and level (intercept) before and after the generic enter the U.S. market was assessed. The level of significance was set at p < .05 for two-tailed tests.
RESULTS
In the period 1988–2014, the FDA approved twelve new drugs with thirty-three different pharmaceutical formulations and strengths for the prevention and treatment of osteoporosis (Supplementary Table 1). The FDA also approved two fixed-dose combinations containing a bisphosphonate (alendronate sodium/cholecalciferol and calcium carbonate/risedronate sodium). Most drugs were still in the U.S. market as of December 31, 2014, with the exceptions of calcitonin human and the fixed-dose combinations alendronate sodium/cholecalciferol and risedronate sodium/calcium carbonate.
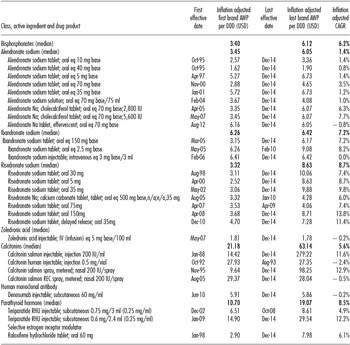
First and Last Inflation Adjusted Average Wholesale Price per Defined Daily Dose of Osteoporosis Brand Drugs Marketed in the United States, 1988–2014

Generic drug entry into the U.S. market occurred for the following active ingredients: alendronate sodium, calcitonin salmon, ibandronate sodium, raloxifene hydrochloride, risedronate sodium, and zoledronic acid (Supplementary Table 1). There were 19 different formulations and strengths with generic competition, with an average ± standard deviation of 5.0 ± 4.2 (range, 1–13) generic applications approved by the FDA in the study period.
The AWP per DDD for osteoporosis drugs varied by approval year, active ingredient, therapeutic class, and dosage form (Table 1). In 1995, the AWP per DDD for alendronate, the first bisphosphonate approved by the FDA, was $1.62 and $2.57 for 40- and 10-mg tablets, respectively. Risedronate entered the U.S. market in 1998 with an AWP per DDD of $3.11; a higher price than the price of alendronate in the same year 1998 (data not shown). Ibandronate sodium AWP per DDD was $3.15 for the first entry in 2005, slightly lower than the prices of alternative bisphosphonates that also entered the market in 2005. Zoledronic acid entered the marked in 2007 at an AWP per DDD of $1.81. The AWP price per DDD was lower for zoledronic acid than for other bisphosphonates. However, zoledronic acid is an injectable and the dosage for treatment of postmenopausal osteoporosis is 5 mg once a year, with a cost per dosage of $1.81. Raloxifene hydrochloride (selective estrogen receptor modulator) was also marketed in oral form with an AWP per DDD of $2.90 at market entry in 1998.
The FDA approved calcitonins in injectable and nasal formulations. The AWP per DDD at market entry was higher for calcitonins than for already marketed drug oral formulations. The first calcitonin salmon injectable entered the U.S. market in 1998 at an AWP per DDD of $14.43; the first calcitonin salmon nasal formulation, approved in 1995 by the FDA, entered the market at an AWP per DDD of $9.64.
The first formulation of teriparatide human recombinant entered the U.S. market in 2002 at an AWP per DDD of $6.51. In addition, denosumab injectable entered the market in 2010 at an AWP per DDD of $5.91.
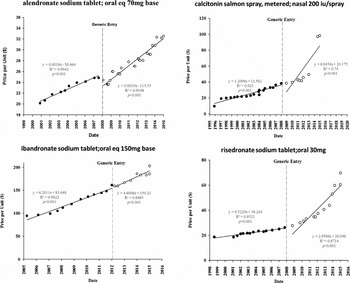
The inflation adjusted AWP compound annual growth varied by drug and therapeutic class (Table 1). Risedronate sodium (all forms and strengths) had the largest median CAGR during the study period (8.7 percent), followed by teriparatide human recombinant (8.5 percent) and ibandronate sodium (7.2 percent). Two active ingredients experienced a negative CAGR (zoledronic acid -0.24 percent and denosumab -0.18 percent). The AWP of brand osteoporosis drugs continued to increase after generic market entry with the exception of alendronate sodium solution; oral equivalent 70 mg base/75 ml and alendronate 10 mg base (Figure 1; Supplementary Figure 1).
Trends in osteoporosis brand inflation adjusted AWP per unit before and after generic drugs entry. Trends in brand AWP before and after generic drugs entry into the U.S. market. Segmented regression analysis is shown for pre- and postgeneric entry periods. Osteoporosis brand AWP significantly (p < .001) increase after generic drugs entry into the U.S. market.

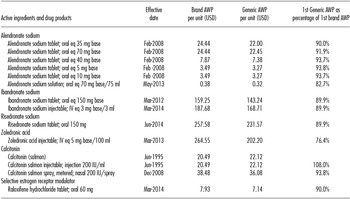
The AWPs of generic drugs at market entry were typically set around 90 percent of the AWP for the corresponding brand product (Table 2). Generic companies set the AWP at 85.7 percent of the brand AWP and set the generic WAC at 61.9 percent of the brand AWP. The generic WAC had a larger price dispersion (range, 5.2–77.5 percent of the brand AWP) than the generic AWP (range, 32.9–89.9 percent of the brand AWP). A large reduction in brand AWP was observed for generic NADAC (33.7 percent of the AWP), FSS (22.5 percent), ACA FUL (9.8 percent), AMP (5.6 percent), and Medicare Part B (78.5 percent).
Inflation Adjusted Brand and Generic Average Wholesale Price per Unit at Generic Entry Date, 1988–2014

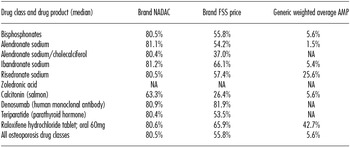
In the study period, prices, acquisition cost and reimbursement amounts of osteoporosis drugs showed a significant variation compared with the brand AWP price (Table 3). The brand WAC was typically set at 83.3 percent of the AWP, with the exception of risedronate and calcitonin. The brand direct price was set at the same level as the brand WAC (83.3 percent of the brand AWP) (Supplementary Table 2). Community pharmacies, both independent and chains, acquired the brand osteoporosis drugs at a median NADAC of 80.5 percent of the brand AWP. Brand pharmaceutical companies provided additional discounts to the federal programs FSS and to the Big 4 (53.2 percent of the brand AWP).
Inflation Adjusted Prices of Osteoporosis Drugs as a Percentage of the Brand Average Wholesale Price on December 31, 2014

DISCUSSION
To our knowledge, this is the first study to assess price trends for osteoporosis drugs and to compare different manufacturer prices, community pharmacy actual transaction cost estimations, and reimbursement amounts available in the United States. Study results show that generic drug prices were significantly lower than brand prices and brand prices continued to increase after generic drug entry into the U.S. market. In addition, there was a significant variability among manufacturer listed prices, community pharmacy actual acquisition costs, and third party payer's reimbursement rates. In the study period, prices of osteoporosis drugs increased faster than the inflation. Previous studies found that the growth in pharmaceutical expenditures exceeded the increase in general prices in the United States (Reference Aitken, Berndt and Cutler23;Reference Schumock, Li, Suda and Wiest24). Study results show that price increases significantly varied by formulation and strength, active ingredient, and drug class.
The first generic AWP and WAC for a drug did not represent a significant decrease in comparison with the brand AWP and WAC, respectively. Generic AWPs decreased over time after more generic competitors entered the market, but they still remained higher than the community pharmacy actual transaction cost (Reference Balaban, Dhalla, Law and Bell25). The number of generic competitors varied by drug and formulation/strengths. Alendronate, the drug of choice for osteoporosis during most of the study period, experienced the largest number of generic competitors. These results corroborate findings from a prior study that showed that the number of generic entrants is a key determinant of the generic-to-brand price ratio, and that generic competition is more intense for drugs with large sales, which experienced significantly more generic entrants (Reference Saha, Grabowski and Birnbaum26).
Prior research showed that brand drugs continue to increase after generic market entry (the so called “Generic Competition Paradox”), and this study also confirmed that finding (Reference Regan27;Reference Kong28). The brand AWP increased at a pace faster than the inflation after generic entry. Study results showed that manufacturer listed prices (i.e., AWP and WAC) do not represent the actual transaction price paid by the pharmacy for drug products. However, the WAC is closely related to the actual transaction price paid by community pharmacies for brand drugs. The AWP and WAC were much higher than the community pharmacy actual acquisition cost for generic drugs. The AWP and the WAC do not take into account discounts and rebates (Reference Gencarelli29). As a result, pharmacies and third party payers typically pay less than the AWP for brand drugs, and less than the AWP and WAC for generic drugs. Still, the AWP and WAC are commonly used for calculating the pharmacy estimated acquisition cost that is used for third party payers’ pharmacy reimbursement purposes in the United States (Reference Scherer30).
This study compared prices that are used in the United States for different purposes. The AWP and the WAC are manufacturer listed prices and do not represent the actual transaction cost. However, AWP and WAC are benchmark prices used in the United States for reimbursement purposes. The FSS and the Big 4 are prices negotiated by the Federal government for federal purchases of pharmaceuticals and these prices are based on the lowest prices offered in the private sector. The ACA FUL and Medicare Part B ASP prices are based on the average actual transaction costs that occur in the private sector. The ACA FUL and Medicare Part B ASP prices are intended for pharmacy and physician offices reimbursement, respectively. The NADAC and weighted average AMP are based on surveys of actual transaction costs paid by community pharmacy (i.e., NADAC) and the average prices charged by manufacturers in the private sector (i.e., AMP). NADAC and weighted average AMP are used to estimate the pharmacy reimbursement in some Medicaid programs.
Study results show significant differences in the prices of drugs used in the U.S. healthcare system. Pharmaceutical companies listed prices were higher than the estimated acquisitions costs (i.e., NADAC, AMP) and also higher that the prices used for reimbursement (i.e., FUL, ACA FUL, Medicaid Part D, FSS, and Big 4). The prices paid by the Federal government were significantly lower than the prices paid in the private sector. Previous studies conducted by the federal government found that drug prices vary considerably across government programs (31;32). The prices paid by federal and state pharmacy benefit programs are established using a combination of statutory rebates and discounts, and negotiations with pharmaceutical companies that can result in additional price reductions.
The federal reimbursement system goal is at least for access to the lowest price paid for drugs in the private commercial sector. In line with the findings of this study, a study by the Office of the Inspector General (OIG) found that the AMP was significantly lower than the AWP and WAC (31). The OIG also found that the differences between AMP and AWP were higher for generic than for brand drugs. Recognizing that pharmaceutical companies set high prices for generic drugs, CMS established first the FUL for reimbursement of multisource generic drugs, and later the AMP and ASP reimbursement systems for linking reimbursement to the pharmacy actual acquisition cost.
This study has some limitations. The price comparisons conducted in this study reflect manufacturer prices, actual pharmacy acquisition costs, and reimbursement prices. These prices do not include the total drug and pharmacy costs. The pharmacy benefit management cost, administrative costs, and the pharmacy dispensing fees are not included in the analysis. This study focused on osteoporosis drugs; as a result, study findings cannot necessarily be generalized to other therapeutic classes. HRTs were not included in the analysis because HRTs are indicated for treatment of multiple diseases other than osteoporosis. In addition, HRTs are only indicated for patients who are intolerant of other osteoporosis prevention therapies.
Prices assessed in this study are for use in community pharmacies. Prices paid for osteoporosis drugs in institutional pharmacies were not included in this study. The price analysis was based on price comparisons to prices effective on December 31, 2014. Prices may change over time in response to increasing competition, cost control measures, market entry of new therapeutic alternatives, or new findings about the efficacy or safety of pharmaceuticals. Last, the DDD does not represent the actual or recommended usage of osteoporosis drugs, and it does not consider variations in usage for osteoporosis prevention or treatment, or in different subpopulation groups (e.g., low versus high fracture risks). Future studies could use other indicators such as FDA-approved or guideline-recommended doses to assess usage and prices of osteoporosis drugs in the United States.
CONCLUSIONS
There are significant differences among osteoporosis drugs manufacturer prices, community pharmacy actual acquisition cost, and reimbursement rates in the U.S. public and private healthcare programs. Pharmaceutical companies’ listed prices are higher than the pharmacy actual estimated acquisitions costs, and they are also higher than the prices used for reimbursement to providers. The prices paid by the federal government are significantly lower than the prices paid by the private sector. In the period 1988–2014, the price of osteoporosis drugs increased at a pace faster than the inflation. Generic entry significantly decreased drug prices; nevertheless, the prices of branded drugs facing generic competition continued to increase after generic market entry.
SUPPLEMENTARY MATERIAL
Supplementary Table 1: https://doi.org/10.1017/S0266462316000623
Supplementary Figure 1: https://doi.org/10.1017/S0266462316000623
Supplementary Table 2: https://doi.org/10.1017/S0266462316000623
CONFLICTS OF INTEREST
Bander Balkhi: Dr. Balkhi has nothing to disclose. Enrique Seoane-Vazquez: Dr. Seoane-Vazquez has nothing to disclose. Rosa Rodriguez-Monguio: Dr. Rodriguez-Monguio has nothing to disclose.