Implications
Dairy farmers put considerable emphasis on milkability of their cows. For German Fleckvieh, breeding values for milkability, which are based only on first-lactation data, are available. This study shows that heritability of average milk flow rate varies through the lactation, and that heritability in later lactations tends to be lower than in the first lactation. Genetic correlations between test-days are higher for average milk flow rate than for other dairy traits. Performance data from later lactations are available, and the accuracy of selection decisions may improve if these data were included in the breeding value estimation.
Introduction
Milkability is an important functional trait in dairy cattle. A cow should be milked gently, quickly and completely, with no need for further adjustment of the milking unit and no need for machine stripping (Mein, Reference Mein1998). Especially in milking parlours, slow-milking cows hinder the milking process of the herd. In the total merit index for the Fleckvieh breed in Germany, milkability is included with a relative economic weight of 3%. Krogmeier et al. (Reference Krogmeier, Luntz and Goetz2006) found out that at auctions, where both daily milk yields and milkability of heifers are announced, milkability had a significant impact on their price. This shows that dairy farmers place considerable emphasis on this trait.
According to a description of National genetic evaluation systems (Interbull (The International Bull Evaluation Service), 2007), several countries have implemented a breeding value estimation for workability, which includes milking speed and (milking) temperament. In most countries milking speed is subjectively scored by farmers and only one observation per cow is available. In Italy and Germany (Bavaria), where milking speed is recorded with a milk meter that allows calculating flow rates during milking, cows can have repeated observations.
In genetic evaluation systems related to milk production, e.g. milk yield, fat yield, protein yield and somatic cell count, observations from the first, second and third lactations are often considered as different traits. In studies including milking speed data from several lactations, a fixed parity effect was fitted in the model (Bagnato et al., Reference Bagnato, Rossoni, Maltecca, Vigo and Ghiroldi2003; Zwald et al., Reference Zwald, Weigel, Chang, Welper and Clay2005; Norberg and Rasmussen, Reference Norberg and Rasmussen2007). In the joint genetic evaluation for somatic cell count and milking speed in Austria and Germany (Baden-Wuerttemberg, Bavaria), a multiple-trait model with five traits is applied: somatic cell count from lactations 1 to 3 in both countries, average flow rate (AFR) in Austria and Baden-Wuerttemberg and AFR in Bavaria (Sprengel et al., Reference Sprengel, Dodenhoff, Götz, Duda and Dempfle2001). A test-day model with fixed regressions is used and only AFR from lactation 1 is considered, even though in Bavaria AFR from all lactations is available for approximately 75% of the cows, depending on the recording scheme and on the recording device, respectively.
A previous study by Dodenhoff et al. (Reference Dodenhoff, Sprengel, Duda and Dempfle1999) indicated that AFR in later lactations is higher than in the first lactation and that the shape of the lactation curve is different in later lactations as compared to the first lactation. Therefore, AFR from later lactations might give additional information about the milkability of cows. The use of covariance functions (CF) and random regressions in test-day models are commonly regarded as being superior to fixed regression test-day models (e.g. Swalve, Reference Swalve2000; Jensen, Reference Jensen2001). For the genetic evaluation of milk yield traits in Austria and Germany, reduced rank CF are applied (Emmerling et al., Reference Emmerling, Mäntysaari and Lidauer2002b). Hence, it seemed appropriate to consider a similar model for the analysis of AFR. The objective of this study was to estimate genetic parameters for AFR in the first three lactations via a two-step approach, deriving CF based on multiple-trait restricted maximum likelihood (REML) estimates.
Material and methods
Data for this study included test-day records for milk yield and AFR on Fleckvieh cows from Northern Bavaria, recorded from 1999 to 2007. These data were from the routine dairy recording, provided by the Bavarian dairy recording organization, LKV Bayern. AFR is the average milk flow rate during the main milking. By definition, the period of main milking starts when the milk flow rate reaches 0.5 kg/min, and it ends when the milk flow rate is lower than 0.2 kg/min as measured by the milk-recording device (Steidle et al., Reference Steidle, Goeft, Immler, Rosenberger, Korndoerfer, Duda, Troeger, Bruckmaier, Worstorff, Model, Harch and Deneke2000). Only records with a minimum of 2 kg milk per milking were included in the data. According to the LKV Bayern, measurement of milk flow rates from milkings with very small milk yields may be inaccurate (J. Duda, personal communication). Depending on the recording method (two milkings per day or alternative milking), one or two observations per test-day were available. Herds in the data were ranked by their number of test-day records. Then two independent data sets were created by randomly selecting herds with more test-day records than average. These data sets included 630 000 and 583 000 AFR observations on 22 700 and 20 400 cows, respectively. On average, each cow had, respectively, 27.8 and 28.6 observations. Data were edited with respect to age at calving (22 to 38 months, 33 to 53 months and 44 to 68 months in lactations 1, 2 and 3, respectively), days in milk (DIM 8 to 305) and number of observations per herd test-day (at least six observations). Milkings where an abrupt air leakage had occurred, e.g. when the milking unit fell off or was knocked off by the cow, were excluded. This was the case in 4% to 11% of the milkings, depending on lactation number as well as on stage of lactation. The milk-recording device identifies such air leakages based on interruptions of the milk flow (Steidle et al., Reference Steidle, Goeft, Immler, Rosenberger, Korndoerfer, Duda, Troeger, Bruckmaier, Worstorff, Model, Harch and Deneke2000). Cows were required to have at least one observation in the first lactation. These edits left 18 719 and 16 937 cows in the data sets, respectively. For each cow, seven generations of paternal pedigree information and two generations of maternal pedigree information were added. In a recursive procedure parent animals that had only a single offspring were treated as unknown (pruning). The total number of animals in the relationship matrix was, respectively, 46 216 and 40 725.
AFR test-day records were grouped into periods, which were considered to be different traits. Eighteen time periods were defined across lactations (DIM 8–20, 31–63, 64–96, 130–162, 196–228 and 275–305 in lactations 1, 2 and 3, respectively). The first time period in each lactation comprised only 13 days in order to obtain precise information about the beginning of the lactation. If two milkings (i.e. two AFR observations) per cow and test-day were available, the one where the component sample was taken remained in the data so that cows had only one AFR observation in a particular time period. Preliminary studies revealed that AFR from morning milkings and AFR from evening milkings can be considered to be the same trait, even though AFR from morning milkings is slightly higher because of uneven milking intervals. To improve the normality of AFR, a square root transformation was applied.
For the estimation of variance parameters a two-step approach was applied (Mäntysaari, Reference Mäntysaari1999). In the first step, multiple-trait REML analyses were performed to obtain estimates for the 18 time periods, whereas in the second step, CF (Kirkpatrick et al., Reference Kirkpatrick, Lofsvold and Bulmer1990) were fitted to the estimated REML parameters.
Computational requirements did not allow one to apply a multiple-trait animal model with all 18 traits (i.e. time periods). Hence, for each of the two data sets, numerous multiple-trait analyses with a maximum of four traits were carried out in order to fill the 18 × 18 matrix of (co)variance parameters. The traits considered in each analysis were allowed to come from different lactations. However, in order to avoid a potential selection bias through culling of cows after lactation 1, each analysis included at least one time period from the first lactation. For both data sets and each trait, the same statistical model was used:

where yijklm is the test-day AFR record of cow l in time period i; HYij is the fixed effect of herd–year; CYSik is the fixed effect of calving year–calving season; biDIMjklm is the DIM as a linear covariate; ciagejklm is the age at calving (days) as a linear covariate; animalil is the random additive-genetic animal effect; and eijklm is the random residual effect.
Components of variances were estimated by REML using an average information algorithm implemented in the DMU package (Madsen and Jensen, Reference Madsen and Jensen2000). Estimates from these REML analyses were combined applying an algorithm for iterative summing of expanded part matrices (Mäntysaari, Reference Mäntysaari1999), thus assuring the additive-genetic and residual (co)variance matrices of order 18 × 18 to be positive-definite.
In the second step, CF for additive-genetic variances (ΦK aΦ′) and non-genetic animal variances (ΦK pΦ′) were derived. Constant residual variances within lactations were assumed. In the derivation, second-order Legendre polynomials plus an exponential term were used in Φ to obtain an order of fit with rank 12 in the coefficient matrices K a and K p (Emmerling et al., Reference Emmerling, Mäntysaari and Lidauer2002b). Non-genetic animal variances and residual variances were derived applying an expectation-maximization algorithm (Mäntysaari, Reference Mäntysaari1999), where the estimated residual covariance matrix was separated into a part for the permanent environmental effects, and a part for temporary environmental effects.
Results and discussion
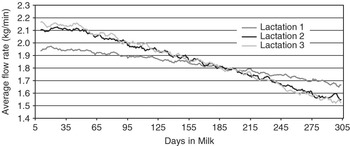
The two-sample data sets were combined and 5-day running averages were calculated to present the general phenotypic variability of AFR during lactations (Figure 1). In lactation 1, AFR reached its peak of 2.0 kg/min at around day 20 and then decreased steadily towards the end of lactation. In the first half of lactation, AFR was somewhat higher in lactation 3 than in lactation 2, but late in lactation there was almost no difference. AFR early in lactation was considerably higher in these two lactations as compared to the first lactation but the decrease during lactation was stronger. This caused AFR from around day 215 to be lower in later lactations than in lactation 1.
Average flow rate across lactations (data sets 1 and 2 combined; 5-day running average).

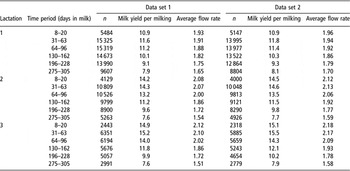
Due to the definition of time periods, the first period (DIM 8–20) of each lactation had fewest data (Table 1). As could be expected, the number of observations decreased towards the end of lactation (cows drying off) as well as across lactations (cows being culled). While AFR tended to be higher for data set 2, pattern of AFR within and across lactations was very similar for both data sets. At the beginning of lactation, AFR was considerably higher in lactations 2 and 3 than in lactation 1. In late lactation (i.e. in time periods 5 and 6), AFR was actually higher in lactation 1 than in later lactations. This could be related to the degree of udder filling, which plays an important role in milk ejection (Bruckmaier, Reference Bruckmaier2001). Towards the end of lactation, milk production of cows from different lactations was rather similar (Table 1), but in general, first-lactation cows likely have smaller udders than later-lactation cows.
Number of observations and means for milk yield per milking and average flow rate for two data sets

Considering the relatively low number of AFR test-day records in some of the time periods, especially in the first and in the last time period of lactation 3, estimates of variances from REML runs for the two data sets were in good agreement. Since the estimates, and especially the pattern of estimates within lactations, were so similar, and since the data sets were sampled from the same population, the estimates from both data sets were pooled in the iterative summing of expanded part matrices, resulting in additive genetic and residual (co)variance matrices of order 18 × 18.
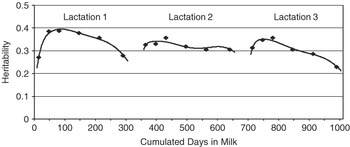
For lactation 1, estimates of heritability (h 2) for AFR from multiple-trait analyses after iterative summing ranged from 0.27 to 0.39 (Figure 2). The estimates from the first time period and the last time period, respectively, were considerably lower than those from mid-lactation. Analysing data from the same population with a fixed regression model, Sprengel et al. (Reference Sprengel, Dodenhoff, Duda and Dempfle2000) found h 2 estimates of 0.25 for first-lactation AFR. In our study, data were from a larger time span (9 years v. 3 years) and, therefore, besides using a different model, a better structure of the data might explain the higher estimates. The heritability of automatically recorded milk flow rate reported by Gäde et al. (Reference Gäde, Stamer, Junge and Kalm2006) and Norberg and Rasmussen (Reference Norberg and Rasmussen2007) was, respectively, 0.55 and 0.39. In Ilahi and Kadarmideen (Reference Ilahi and Kadarmideen2004), the heritability of measured AFR for Brown Swiss and Simmental was 0.46 and 0.48, respectively. In the same study the heritability for subjectively scored milk flow in Holstein was 0.25. Similar or slightly lower heritabilities for subjectively scored milking speed were reported by, e.g. Boettcher et al. (Reference Boettcher, Dekkers and Kolstad1998), Rupp and Boichard (Reference Rupp and Boichard1999) and Wiggans et al. (Reference Wiggans, Thornton, Neitzel and Gengler2007). In national genetic evaluation systems, heritabilities for subjectively scored milking speed range from 0.16 to 0.32 (Interbull, 2007). The heritability for subjectively scored milking speed generally seems to be lower than the heritability for measured flow rate.
Heritability estimates for test-day average flow rate across lactations (symbols: estimates from multiple-trait analyses after iterative summing; solid lines: estimates derived by covariance functions).

For primiparous cows, it may take some time to get accustomed to the milking routine. Early in lactation 1, an abrupt air leakage, which indicated that the cow may have kicked off the cups, was observed in approximately 11% of the milkings whereas later in the lactation this was observed in less than 5% of the milkings. Those records were deleted, but even if no abrupt air leakage was registered AFR may be affected if the cow is not yet familiar with the milking process. This could be the reason for the relatively small h 2 for the first time period in lactation 1. Very early in lactation, AFR may also be affected by udder oedema, which would be even more likely in later lactations. Therefore, in a future study the effects of behaviour of first-lactation cows and of udder oedema, respectively, on AFR should be analysed.
Range of h 2 estimates in later lactations was smaller than in the first lactation. For most time periods, heritabilities from lactations 2 and 3 were very similar. Only at the end of lactation, h 2 in lactation 3 was lower than in lactation 2. During mid-lactation, heritabilities were largest for lactation 1. In general, estimates of genetic variances (not presented in detail) were of the same magnitude for all lactations, whereas residual variances were higher in lactations 2 and 3 than in lactation 1. In lactations 1 and 3, genetic variance decreased towards the end of lactation, while it increased in lactation 2, resulting in the relatively large h 2 at the end of lactation 2.
Test-day h 2 estimates for each day of lactation based on the derived CF are shown in Figure 2. Comparing the test-day heritabilities with the heritabilities for the 18 time periods, the combination of second-order Legendre polynomial and an exponential term in the derivation of CF can be considered to be a sufficient fit. Except for the first part of lactation 2, test-day h 2 estimates were very close to those obtained from the multiple-trait analyses after iterative summing. Lactation heritabilities of 0.46, 0.44 and 0.41 for lactations 1, 2 and 3, respectively, were derived when 10 equally spaced test-days per lactation were assumed. These heritabilities agreed with estimates from other studies, where models with repeated observations per cow were applied (Gäde et al., Reference Gäde, Stamer, Junge and Kalm2006; Norberg and Rasmussen, Reference Norberg and Rasmussen2007).
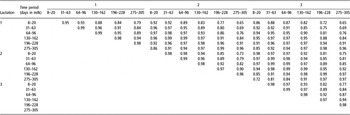
Estimates of genetic correlations (r a) between time periods for AFR from multiple-trait analyses after iterative summing ranged from 0.65 to 0.99 (Table 2). Within lactation, r a estimates between time periods were very similar for all lactations. In each lactation, the genetic correlation was smallest between time period 1 and time period 6 (0.79, 0.73 and 0.77 in lactations 1, 2 and 3, respectively). Estimates of r a were always higher for adjacent time periods than for time periods further apart. A similar pattern could be observed for r a estimates between time periods across lactations. Those estimates were largest between time periods from lactations 2 and 3, and they tended to be slightly higher between time periods from lactations 1 and 2 as compared to those between time periods from lactations 1 and 3.
Estimates of genetic correlations from multiple trait analyses after iterative summing for average flow rate in the first three lactations

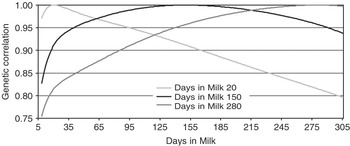
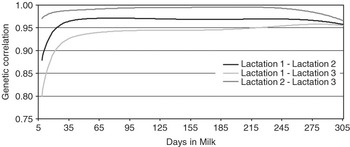
In order to illustrate the genetic covariance structure based on the derived CF, estimates of r a between DIM 20, 150 and 280, respectively, and other DIM over the course of lactation 1 are presented in Figure 3. Genetic correlations decreased as the distance between DIM increased. The curve for DIM 150 shows that this tendency was more pronounced towards the beginning of lactation than towards the end of lactation. Genetic correlations between DIM in lactations 2 and 3 were very similar to those in lactation 1 and, therefore, are not presented. Figure 4 shows that estimates of r a between corresponding DIM in the three lactations were smallest early in lactation. The estimates were fairly stable during mid-lactation and, somewhat surprisingly, hardly decreased towards the end of lactation. The largest estimates of r a were found between corresponding DIM from lactations 2 and 3, with estimates early in lactation as well as late in lactation being above 0.96. Estimates between DIM from lactations 1 and 2 were slightly higher than between DIM from lactations 1 and 3.
Genetic correlation estimates for average flow rate between days in milk 20, 150 and 280, respectively, and other days in milk over the course of lactation 1.

Genetic correlation estimates for average flow rate between corresponding days in milk of two lactations.

We are not aware of any other studies applying random regression models for the analysis of test-day milkability. Therefore, we chose to compare the general trends in estimated heritabilities and genetic correlations for AFR with other dairy traits. Heritability estimates for AFR in lactation 1 were higher than in later lactations. This was also observed for milk yield traits by Liu et al. (Reference Liu, Reinhardt and Reents2000) and Emmerling et al. (Reference Emmerling, Lidauer and Mäntysaari2002a), whereas Druet et al. (Reference Druet, Jaffrézic and Ducrocq2005) found constant heritabilities across lactations for milk yield traits. Heritability estimates for somatic cell score tended to be similar across lactations (Liu et al., Reference Liu, Reinhardt and Reents2001; Druet et al., Reference Druet, Jaffrézic and Ducrocq2005). Shapes of heritability curves for AFR were more similar to those for milk production traits (Liu et al., Reference Liu, Reinhardt and Reents2000; Druet et al., Reference Druet, Jaffrézic and Ducrocq2005) than for somatic cell score (Liu et al., Reference Liu, Reinhardt and Reents2001; Druet et al., Reference Druet, Jaffrézic and Ducrocq2005). Genetic correlations within lactation between extreme parts of lactation were higher for AFR than for milk yield traits (Liu et al., Reference Liu, Reinhardt and Reents2000; Emmerling et al., Reference Emmerling, Lidauer and Mäntysaari2002a; Druet et al., Reference Druet, Jaffrézic and Ducrocq2005) and for somatic cell score (Liu et al., Reference Liu, Reinhardt and Reents2001) but were almost identical to the genetic correlations for fat content observed by Druet et al. (Reference Druet, Jaffrézic and Ducrocq2005). In the joint genetic evaluation in Austria and Germany, a fixed regression model is used for first-lactation AFR in Bavaria (Sprengel et al., Reference Sprengel, Dodenhoff, Götz, Duda and Dempfle2001), which assumes that the observations are repeated measurements of the same trait (r a=1.0). The large correlations between test-days in the first lactation found in our study indicate that the possible advantage of using a random regression model for first-lactation AFR, which describes the correlation structure more accurately, may be smaller than for other dairy traits. Genetic correlations for AFR between corresponding test-days from two lactations were close to 1 for second and third lactations, which was also the case for milk yield traits and somatic cell score in the studies mentioned above. However, genetic correlations between first and second lactation and between first and third lactation, respectively, were higher for AFR than for other dairy traits (e.g. Liu et al., Reference Liu, Reinhardt and Reents2001; Emmerling et al., Reference Emmerling, Lidauer and Mäntysaari2002a; Druet et al., Reference Druet, Jaffrézic and Ducrocq2005).
Conclusions
Trends for test-day heritability for AFR were found to be similar to those for milk, fat and protein yield. Test-day heritability early in lactation 1 was considerably lower than in mid-lactation, possibly because AFR was affected when cows were not yet familiar with the milking process. Genetic correlations between test-day AFR within lactation as well as across lactations were higher than for other dairy traits but lower than unity. Therefore, using a multi-lactation random regression test-day model for AFR instead of the current first-lactation fixed regression test-day model may improve the accuracy of selection decisions. Recording of AFR in all lactations does not cause any additional costs because it is a by-product of the official milk recording.
The covariance structure also indicates that applying a rank reduction to the CF might lead to a considerable reduction of the number of equations per animal. This would decrease the computational demands and, therefore, make the further development of the already-existing genetic evaluation system for somatic cell count and milkability more feasible.