Introduction
Concern about the environment has increased in recent years across all types of industry. The cement industry, over the past 65 years, has seen its production increase almost 34-fold; its emissions represent 5–8% of all anthropogenic greenhouse gases (Mikulčić et al., Reference Mikulčić, Klemeš, Vujanović, Urbaniec and Duić2016; Scrivener et al., Reference Scrivener, John and Gartner2018; Tam et al., Reference Tam, Taylor, Gielen, Twigg, Klee, Rocha and Meer2009). The industry, other organizations, and researchers have sought ways to reduce these CO2 emissions. The use of supplementary cementitious materials (SCM) is generally agreed as a good way forward (Mikulčić et al., Reference Mikulčić, Klemeš, Vujanović, Urbaniec and Duić2016; Scrivener et al., Reference Scrivener, John and Gartner2018); in particular, calcined clays are favored, because of their wide availability, favorable behavior, and lower energy consumption (ACI Committee 232, 2012; Benhelal et al., Reference Benhelal, Shamsaei and Rashid2021).
Thermally treated kaolin (metakaolin) is the most studied calcined clay to be used as a SCM, and numerous authors have shown that it is suitable for this purpose because of its good strength and durable behavior (Almenares et al., Reference Almenares, Vizcaíno, Damas, Mathieu, Alujas and Martirena2017; Fernandez et al., Reference Fernandez, Martirena and Scrivener2011; Sabir et al., Reference Sabir, Wild and Bai2001; Trümer & Ludwig, Reference Trümer and Ludwig2015). Illite has also been used and is readily available in various parts of the world (Nickovic et al., Reference Nickovic, Vukovic, Vujadinovic, Djurdjevic and Pejanovic2012), especially in the Argentine cement production zone (Zalba et al., Reference Zalba, Morosi, Conconi and Segovia2010). In Argentina, the first study of thermally treated illite from the province of Buenos Aires to be used as a SCM dates back to 1971 (Batic et al., Reference Batic, Iñiguez Rodríguez and Wainsztein1971), but it did not provide satisfactory strength results because of a low treatment temperature. Although at the correct activation temperature, ~900°C (He et al., Reference He, Makovicky and Øsbæck1995a; Jiang et al., Reference Jiang, Li, Qiu, Fan and Huang2008; Lemma et al., Reference Lemma, Irassar and Rahhal2015), illite has a lower reactivity than metakaolin, many studies show that thermally treated illite also performs well (ACI Committee 232, 2012; Ambroise et al., Reference Ambroise, Murat and Péra1985; Cordoba et al., Reference Cordoba, Zito, Sposito, Rahhal, Tironi, Thienel, Irassar, Thienel and Irassar2020; Cordoba & Irassar, Reference Cordoba and Irassar2021; He et al., Reference He, Makovicky and Øsbæck1995a; He et al., Reference He, Osbaeck and Makovicky1995b; Irassar et al., Reference Irassar, Bonavetti, Castellano, Trezza, Rahhal, Cordoba and Lemma2019; Lemma et al., Reference Lemma, Irassar and Rahhal2015, Reference Lemma, Castellano, Bonavetti, Trezza, Rahhal and Irassar2018; Marchetti et al., Reference Marchetti, Rahhal, Pavlík, Pavlíková and Irassar2020; Trümer & Ludwig, Reference Trümer and Ludwig2015). He et al. (Reference He, Makovicky and Øsbæck1995a) reported that with a 30% replacement of portland cement by illite treated at 930°C, a mortar compressive strength greater than that of the inert mortar (quartz replacement) was obtained after 7 days of aging, but it never reached that of the ordinary portland cement (OPC) reference mortar. Marchetti et al. (Reference Marchetti, Rahhal, Pavlík, Pavlíková and Irassar2020) found that mortars with 25% replacement by illite treated at 950°C for OPC reached the same compressive strength as the OPC mortar after 90 days. Cordoba et al. (Reference Cordoba, Zito, Sposito, Rahhal, Tironi, Thienel, Irassar, Thienel and Irassar2020) and Cordoba and Irassar (Reference Cordoba and Irassar2021) found that in a sorptivity test, at 28 days, the initial rate of water absorption was the same for a portland cement concrete and a concrete containing 25% calcined illite in place of OPC. Furthermore, in mortars with 20% calcined illite, the expansion due to sulfate attack was controlled in a cement with a large C3A content.
However, cement has alkalis (Na and K) in its chemical composition. For many years, expansion due to the alkali-silica reaction (ASR) was believed to be unlikely when the alkali content of the portland cement was <0.6% Na2Oeq. This consideration was adopted in the ASTM C150 standard. The ASR occurs when the alkalis from the paste react with the amorphous silica of aggregates, forming an expansive gel around them, which produces concrete cracking. Nevertheless, it is now recognized that limiting the alkali content in cement is not an effective way of preventing the ASR because it does not control the total alkali content of the concrete mixture. Therefore, limiting the expansion is an effective way of controlling the ASR (Folliard et al., Reference Folliard, Thomas and Kurtis2003).
The alkali content of the concrete mixture could be affected by the alkalis provided mainly by the portland cement, SCM, aggregates, and additives. Some thermally treated clays used as SCM also have alkalis in their chemical composition (Grim, Reference Grim1942). Furthermore, illite has potassium in its structure as an interlayer cation (Bailey, Reference Bailey1984). When it is extracted from the soil to be used as SCM, it is in the form of illite-rich rocks which also have other mineral components such as quartz, feldspars, chlorite, and iron oxides. Some of these minerals also have alkalis in their compositions, so alkalis could be provided by them. Rossetti et al. (Reference Rossetti, Cordoba, Falcone and Irassar2018) studied the ASR expansion of mortars with a 20% replacement by calcined illite. Portland cement with high and low alkali content was used, and the results showed that when the high-alkali-content cement was used, the expansion of the mortars with the calcined illite replacement was less than that of the OPC mortar. When the low-alkali-content cement was used, the expansion of the mortars with the calcined illite replacement was greater than in the OPC mortar.
On the other hand, alkalis could be used to stimulate the reactions and to make geopolymer binders. Experience has shown that calcined clays have potential in this area (Buchwald et al., Reference Buchwald, Hohmann, Posern and Brendler2009; Diop & Grutzeck, Reference Diop and Grutzeck2008; Hu et al., Reference Hu, Bernsmeier, Grathoff and Warr2017; Marsh et al., Reference Marsh, Heath, Patureau, Evernden and Walker2018; Werling et al., Reference Werling, Kaltenbach, Weidler, Schuhmann, Dehn and Emmerich2022). Buchwald et al. (Reference Buchwald, Hohmann, Posern and Brendler2009) found that common clays such as illite-smectite are suitable as raw materials for preparing geopolymer binders. They studied the dissolution of silicate and aluminate monomers from clays in an alkaline solution and concluded that the best performance as geopolymer binders can be attained by thermal treatment of the clay minerals. However, the highest rate of dissolution was reached by metakaolin.
When illite is treated thermally to be used as a SCM, the dehydroxylation process must occur to make it reactive (He et al., Reference He, Makovicky and Øsbæck1995a). Dehydroxylation consists of the loss of the OH– groups due to high temperature, which results in the destruction of the structure, making the aluminosilicates amorphous and reactive (Buchwald et al., Reference Buchwald, Hohmann, Posern and Brendler2009). In addition, some of the secondary minerals present in the rock could go through dehydroxylation at lower temperatures than illite. In this case, therefore, alkalis could be free to participate in the reactions. Furthermore, when illite and secondary minerals are in contact with the cement pore solution, in a high-pH alkaline environment, (Behnood et al., Reference Behnood, Van Tittelboom and De Belie2016), the properties of the clay minerals (Abedi Koupai et al., Reference Abedi Koupai, Fatahizadeh and Mosaddeghi2020; Carroll & Starkey, Reference Carroll and Starkey1971; Sruthi & Reddy, Reference Sruthi and Reddy2020) and the release of their alkalis could be affected.
The present study aimed, therefore, to analyze alkali release from an illitic rock at various treatment temperatures in various pH systems.
The hypothesis tested was that alkali release occurs when the thermally treated illitic rock is milled and mixed with water or an alkaline solution; and also that it will be modified by the treatment temperature of the sample and the pH of the contact solution.
Materials and Methods
The material tested was an illitic rock from a quarry located in the province of Buenos Aires (Argentina) near the city of Olavarría (Fig. 1), which corresponds to the Sierras Bayas Group, Cerro Negro Formation (Neoproterozoic) in the Sierras Septentrionales of the Province of Buenos Aires. The Sierras Septentrionales have the oldest rocks in Argentina. Igneous and metamorphic rocks constitute the basement, known as the Buenos Aires Complex (Paleoproterozoic). The Complex is covered partially by three sedimentary units, the Sierras Bayas Group (Neoproterozoic) and the Cerro Negro and Balcarce Formations (Eopaleozoic), formed in a shallow sea. The Sierras Bayas Group is 167 m thick and comprises four depositional successions separated by regional unconformities. From the base to the top, it is composed of quartz-arkosic sandstones, dolomites, and shale, followed by quartz sandstones, claystones, and dark micritic limestones. The Cerro Negro Formation consists of >100 m of claystone with heterolithic intercalations. The Balcarce Formation, 100 m thick, represents a sequence of quartz sandstones with subordinate claystones and fine-grained conglomerates (Dalla Salda et al., Reference Dalla Salda, Spalletti, Poiré, Barrio and Echeveste2006).
Geological sketch of the Sierras Septentrionales of the Province of Buenos Aires and location of the study area (Olavarría) (modified from Cingolani (Reference Cingolani2011) and Pérez Marfil et al. (Reference Pérez Marfil, Locati, Marfil and Falcone2021))

The Cerro Negro Formation (Sierras Bayas Group) (Fig. 1) is a sedimentary unit with few outcrops. The basal section, in the Olavarría area, has up to 12 m of marl and reddish flakes that rest on the limestone of the Loma Negra Formation (Barrio et al., Reference Barrio, Poiré and Iñiguez1991). Those authors described three associations of sedimentary facies that, from base to top, are: (1) slope breccia, chert, and mudstones; (2) mudstones with planar stratification and mudstones; and (3) mudstones with wave stratification. A clearly pelitic member of illite-chlorite composition has developed.
After extraction, the rock was milled until <12% was retained in the #325 sieve and homogenized. Chemical analysis of the whole rock was done by X-ray fluorescence (XRF), using a Malvern Panalytical Axios Fast instrument (Malvern Panalytical, Almelo, The Netherlands). The mineralogical composition was determined by polarizing microscopy and XRD. A Leica DM750 P (Leica Microsystems, Wetzlar, Germany) microscope was used for the petrographic study of thin sections and a Philips X'Pert PW 3710 (Philips, Eindhoven, The Netherlands) X-ray diffractometer with CuKα radiation and a graphite monochromator, working at 40 kV and 20 mA, for XRD.
In order to improve the identification of clay minerals by XRD, the clay fraction was separated by decantation in a cylinder burette for 2 h. A portion of the suspension was removed and spread on a slide. The clay fraction was analyzed using a Rigaku D-Max III-C diffractometer (Rigaku, Tokyo, Japan), working at 35 kV and 15 mA, using CuKα1,2 radiation (λ = 1.541840 Å) filtered with a graphite monochromator in the diffracted beam, from 3 to 40°2θ with increments of 0.02°2θ and a counting time of 2 s per step.
For all the determinations, the sample consisted of the whole milled rock. The sample was activated thermally at 900°C, which is the dehydroxylation temperature of illite (He et al., Reference He, Makovicky and Øsbæck1995a; Jiang et al., Reference Jiang, Li, Qiu, Fan and Huang2008; Lemma et al., Reference Lemma, Irassar and Rahhal2015), to achieve the best performance as SCM. The sample was also treated at intermediate temperatures (300 and 600°C) to study its evolution behavior with temperature increase. The thermal treatment was carried out in a muffle furnace for 90 min at constant temperature. The density was determined using the Le Chatelier volumenometer, and the Atterberg limits were determined according to ASTM D4318-17.
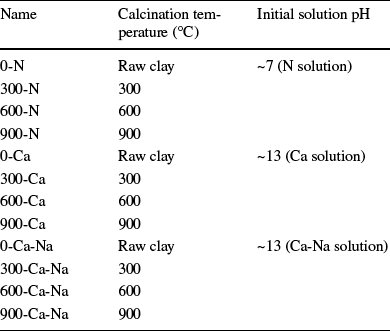
The evolution of alkali release was studied by determining the sodium and potassium concentrations of contact water obtained from samples mixed with various solutions (liquid/solid ratio of 10:1). The calcium concentration was also determined. Three solutions were used: a neutral one (initial pH ~7) with distilled water (N solution), and two alkaline solutions (initial pH ~13), one with 135 mmol/L Ca(OH)2 in distilled water (Ca solution) and the other with 135 mmol/L Ca(OH)2, and 5 mmol/L NaOH in distilled water (Ca-Na solution), simulating the pH of concrete (Behnood et al., Reference Behnood, Van Tittelboom and De Belie2016). In total, twelve combinations obtained by mixing the raw clay with the three solutions at the three heating temperatures were studied (Table 1).
Names of combinations studied, calcination temperatures of the samples, and the types of solutions used

After mixing, the hydrated samples were kept in a stove at 40°C until they reached the test ages: 1 and 6 h and 7, 28, 60, and 90 days for samples in N and Ca solutions, and 7, 28, and 60 days for samples in Ca-Na solution. The contact-water concentrations were determined using a flame photometer (Zeltec ZF240, Dicrom Ingeniería S.A., Buenos Aires, Argentina) for sodium and potassium, and EDTA titration for calcium (at 40°C). The results were the averages of three determinations, and the standard deviations were <±5%.
Results
Material Characterization
The chemical analysis of the whole rock (Table 2) indicated the predominance of SiO2 and Al2O3, followed by Fe2O3 and a significant amount of alkalis (Na2O and K2O), especially potassium, the illitic interlayer cation (Grim, Reference Grim1942).
Chemical composition (mean and coefficient of variation from four measurements) of the raw sample

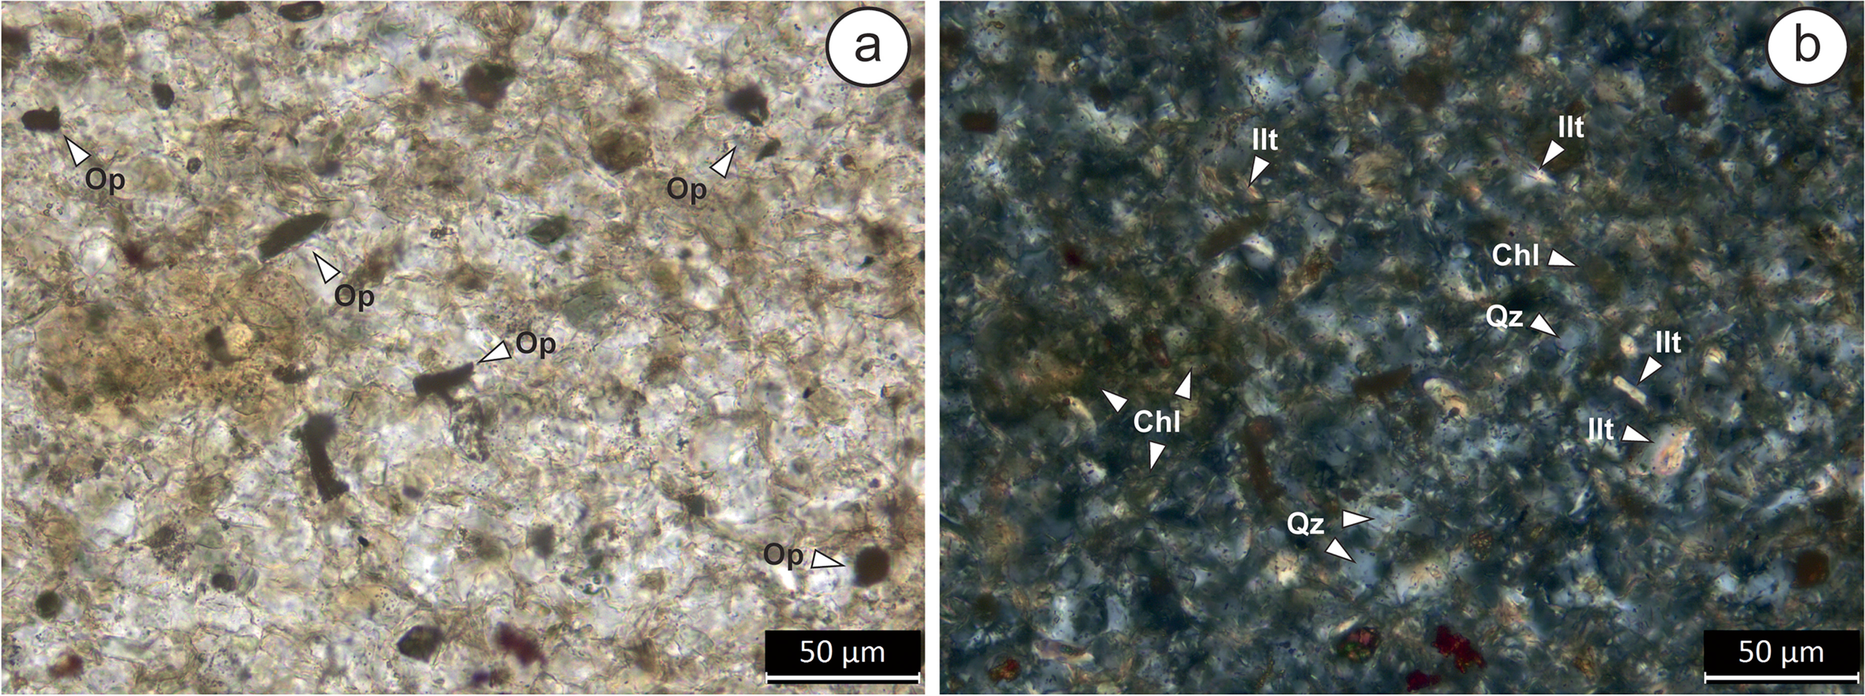
The rock used in the study was a very fine-grained sedimentary rock classified as an illite siltstone, of yellowish-brown color and homogeneous grain size. It presented a microcrystalline granular texture under a polarizing microscope in thin section (Fig. 2). It was composed of equidimensional irregular grains of quartz with subordinate illite and iron oxides. Illite occurred as fine elongated crystals within quartz. The matrix consisted of very fine quartz, illite, and chlorite grains.
Polarizing microscopy of thin sections. Mineralogical composition, structure, and texture of the rock a under parallel nicols, b under crossed nicols. Opaque minerals (Op), illite (Ilt), chlorite (Chl), and quartz (Qz)

In the XRD pattern of the bulk sample (Fig. 3), reflections corresponding to quartz, feldspars, illite, chlorite, and magnetite were identified. The XRD pattern of the clay fraction (Fig. 4) also showed reflections of quartz, illite, and chlorite, confirming that which was already observed in the polarizing microscope, the presence of illite and chlorite in the sample. The XRD pattern of the clay fraction showed a background increment due to the glass slide.
XRD patterns for the raw sample and for samples treated at 300°C, 600°C, and 900°C. Chl: Chlorite, Ilt: Illite, Fsp: Feldspar, Qz: Quartz, Mag: Magnetite, and Hem: Hematite

XRD pattern of the clay fraction of the raw sample. Chl: Chlorite, Ilt: Illite, and Qz: Quartz

Finally, the rock had ~45% illite, according to previous studies (Irassar et al., Reference Irassar, Bonavetti, Castellano, Trezza, Rahhal, Cordoba and Lemma2019; Lemma et al., Reference Lemma, Irassar and Rahhal2015) for which samples were taken in the same area and from the same formations.
Thermal Treatment
The XRD patterns of the raw and the thermally treated samples (Fig. 3) showed a decrease in the characteristic illite peaks as the treatment temperature increased. At 900°C, the main peaks appeared with low intensity because the dehydroxylation temperature of illite is ~900–950°C (He et al., Reference He, Makovicky and Øsbæck1995a; Jiang et al., Reference Jiang, Li, Qiu, Fan and Huang2008; Lemma et al., Reference Lemma, Irassar and Rahhal2015), turning the clay into a meta-illite, so a small amount of illite was not entirely activated thermally. As in the illite peaks, the chlorite peak intensities decreased with the treatment temperature increase, but in this case, the peaks disappeared after 600°C, showing a complete dehydroxylation of chlorite (Brindley & Ali, Reference Brindley and Ali1950). Quartz and feldspar peaks did not vary during the temperature increase. At 900°C, hematite peaks, responsible for the reddish color, appeared because of the change of Fe2+ to Fe3+ due to iron oxidation from magnetite (Hanein et al., Reference Hanein, Thienel, Zunino, Marsh, Maier, Wang, Canut, Juenger, Ben Haha, Avet, Parashar, Al-Jaberi, Almenares-Reyes, Alujas-Diaz, Scrivener, Bernal, Provis, Sui, Bishnoi and Martirena-Hernández2022; Murad & Wagner, Reference Murad and Wagner1996). Also observed was an increase in the background between 20 and 35°2θ, which was related to the incremental increase in the amount of amorphous phase (He et al., Reference He, Makovicky and Øsbæck1995a).
The density and Atterberg limit results (Fig. 5) showed that the density increased with treatment temperature, but reached a maximum at 600°C. Moreover, the plasticity index decreased with increases in the treatment temperature until 600°C; at 900°C, the sample became non-plastic. The plasticity of a clay is due to its capacity to incorporate water (Andrade et al., Reference Andrade, Al-Qureshi and Hotza2011), so when the sample was treated thermally, the plasticity index reduction and the density increase could be related. At 900°C, some illite peaks in the XRD patterns (Fig. 3) disappeared as a consequence of dehydroxylation, which could result in structure collapse, thus accounting for a density decrease and the complete loss of plasticity. Batic et al. (Reference Batic, Iñiguez Rodríguez and Wainsztein1971) and He et al. (Reference He, Makovicky and Øsbæck1995a) reported similar experiences. The former authors treated an illite at 600, 700, and 800°C, and the density increased and then decreased. In the same way, He et al. (Reference He, Makovicky and Øsbæck1995a) treated another illite at 650, 790, and 930°C. The density increased in the samples with no thermal treatment and for those treated at 650°C, and then decreased for those treated at 790 and 930°C. This density decrease corresponded to the temperatures at which strength results were better.
Density, liquid limit (LL), plastic limit (PL), and plasticity index (PI) for raw and thermally treated samples

Alkali Release and Calcium Concentration
Sodium ion concentration values in the contact water of samples (Fig. 6) showed an important difference in behavior among the samples in the different pH solutions. Samples in N solution had almost no variation with age, and their Na+ concentration was <1.5 mmol/L, whereas the samples in Ca and Ca-Na solutions increased their Na+ concentration with age. For Ca solution, the raw sample and samples treated at 300 and 600°C had a similar behavior, reaching 5–7 mmol/L of Na+ at 90 days, but the sample treated at 900°C had a significant initial value at 7 days (~7.5 mmol/L of Na+) and then stabilized. For Ca-Na solution, in the raw sample and in those treated at 300 and 600°C, the Na+ concentration was similar at 7 days (6–7 mmol/L of Na+) and at 60 days (13–14 mmol/L of Na+), whereas the sample treated at 900°C had a greater initial value (14.18 mmol/L of Na+ at 7 days) with an increase of ~2 mmol/L of Na+ at 28 days and then stabilized.
Na+ concentration of contact water of raw and thermally treated samples in various pH solutions

According to the percentage of Na2O in the whole rock (1.72%), the theoretical maximum amount of Na+ available was 49.94 mmol/L, but samples in N solution released only 0.57–0.96 mmol/L of Na+ at 60 days. On the other hand, the addition of calcium to the solution (Ca solution) increased the Na+ concentration in the contact water of samples to 4.2–7.14 mmol/L at 60 days. Moreover, with the addition of calcium and sodium to the solution (Ca-Na solution) these values reached 12.66–15.7 mmol/L of Na+ at 60 days, considering that the Na+ concentration values of samples in Ca-Na solution had 5 mmol/L of NaOH provided by the solution.
Like the Na+ concentration, the K+ concentration in the contact water of samples increased with age (Fig. 7). According to the percentage of K2O in the whole rock (3.81%), the theoretical maximum amount of K+ available was 72.96 mmol/L. However, samples in N solution exhibited a slight variation in K+ concentration with age, which remained at <0.1 mmol/L of K+. Samples in Ca solution showed similar behavior with respect to Na+ concentration, reaching ~0.4 mmol/L of K+ at 90 days in the raw sample and that treated at 300°C, and 1.2 mmol/L of K+ at 90 days in the sample treated at 900°C. However, the sample treated at 600°C showed an intermediate behavior in K+ concentration between samples treated at 300 and 900°C. For Ca-Na solution, the raw sample and that treated at 300°C had similar values to those for Ca solution. But samples treated at 600 and 900°C reached 1.06 and 1.37 mmol/L of K+ at 60 days, respectively.
K+ concentration of contact water of raw and thermally treated samples in various pH solutions

While sodium and potassium concentrations increased with age, calcium concentration (Fig. 8), in general, decreased. Ca2+ concentration in the contact water for samples in N solution remained <1 mmol/L, even though the theoretical maximum amount of available Ca2+ in the whole rock was 15.43 mmol/L (0.96% CaO). With the addition of Ca(OH)2, this value reached 150.57 mmol/L of Ca2+. However, the initial concentration in the contact water was ~14 mmol/L of Ca2+ for samples in Ca and Ca-Na solutions, which was similar to that of a Ca(OH)2 saturated solution at 40°C.
Ca2+ concentration of contact water of raw and thermally treated samples in various pH solutions

The Ca2+ concentration in the contact water of samples in Ca and Ca-Na solutions exhibited similar behavior. Raw samples and those treated at 300°C showed a slight concentration decrease with age. Then, in samples treated at 600°C the decrease in Ca2+ concentration was more significant. Moreover, samples treated at 900°C showed a sharp decrease in the Ca2+ concentration at early ages; and after 28 days, the values were <1 mmol/L of Ca2+.
The effect of adding NaOH to the Ca-Na solution was the displacement of the results to slightly lower values. This effect was most evident at 7 days. After that, values tended to approach those of the Ca solution. This effect was not visible for samples treated at 900°C because insufficient Ca was available.
Discussion
Comparison between the concentrations of Na+ and K+ in samples in the various solutions showed an important influence of the pH solution on alkali release. Ca(OH)2 incorporation into the solution increased the release of the Na+ and K+ in samples, and adding NaOH increased it further.
Rossetti et al. (Reference Rossetti, Cordoba, Falcone and Irassar2018) reported a similar experience with the pore solution of pastes made with a low-alkali portland cement, a 25% replacement of two illitic clays calcined at 950°C and water. When the calcined illite had a small alkali content (0.08% Na2O and 5.60% K2O), the pore solution decreased the Na+ and K+ concentration between 7 and 14 days of age, which Rossetti et al. (Reference Rossetti, Cordoba, Falcone and Irassar2018) attributed to their combination with silica and amorphous alumina in a pozzolanic reaction (ACI Committee 232, 2012). However, when the calcined illite had a large alkali content (1.52% Na2O and 4.29% K2O), the pore solution increased the Na+ and K+ concentration when similarly aged, the alkali release being greater than when combined in the pozzolanic reaction. The latter highlights the importance of Na content in alkali release, as occurred during the current investigation.
Furthermore, samples in Ca and Ca-Na solutions showed an increase in alkali release with increases in treatment temperature, which could be related to the modification of the clay structure. In previous publications (Lemma et al., Reference Lemma, Irassar and Rahhal2015), stimulation of the reactions was seen through the strength improvement with increases in the treatment temperature.
On the other hand, the Ca2+ concentration of samples in the various solutions showed the same pH influence as for the Na+ and K+ concentrations. In the present case, however, the Ca2+ concentration decreased with age when Ca(OH)2 was added to the solution; this behavior was assumed to be due to a traditional pozzolanic reaction, which consists of the combination of the Ca(OH)2 with the amorphous silica or alumina of the calcined clay to produce hydrated products (ACI Committee 232, 2012).
In addition, when NaOH was incorporated into the solution, the Ca2+ concentration decreased even more. This could be attributed to alkali activation of the sample, as found by Trezza et al. (Reference Trezza, Irassar and Rahhal2020) in Frattini test results of pastes made with portland cement with 25% replacement of calcined illite, and distilled water. The CaO concentration of the contact water decreased when glass powder wastes, which had a high alkali content, were added to the paste to activate the calcined clay.
For the samples in Ca and Ca-Na solution, the influence of treatment temperature was noted in smaller Ca2+ concentrations as the temperature increased. In the study of Lemma et al. (Reference Lemma, Irassar and Rahhal2015), in the Frattini test results of the contact water of pastes made with portland cement with 25% replacement of calcined illite, and distilled water, the CaO concentration for each sample decreased with the increment of the treatment temperature. In a more recent study by Lemma et al. (Reference Lemma, Castellano, Bonavetti, Trezza, Rahhal and Irassar2018), this effect was not evident for temperatures between 900 and 1100°C.
Finally, a relation between Na+ + K+ and Ca2+ concentrations (Fig. 9) could be seen, showing a significant Ca2+ concentration decrease and a slight Na+ + K+ concentration increase with increasing age and treatment temperature. The influence of the type of solution used on the release of alkalis by samples and, consequently, the influence of solution pH was seen in Fig. 9. In addition, the influence of the treatment temperature was shown by the displacement of the points in the figure to the left and slightly upwards, showing a significant decrease in Ca2+ concentration and an increase in the Na+ + K+ concentration with increases in the treatment temperature.
Na+ + K+ concentration vs. Ca2+ concentration of contact water of raw and thermally treated samples in different pH solutions. Age increase follows the arrow, from 7 days to older

Conclusions
When the milled rock, which has a large illite content, is mixed with water or an alkaline solution, a release of Na+, K+, and Ca2+ occurs, which is affected as follows:
– With increasing age, the Na+ and K+ concentrations increase and the Ca2+ concentration decreases.
– Increasing the solution pH increases the Na+ and K+ concentrations and decreases the Ca2+ concentration.
– With increasing treatment temperature, the Na+ and K+ concentrations increase and the Ca2+ concentration decreases until it reaches its activation temperature.
These conclusions are consistent with the proposed hypothesis, so future research will consist of analyzing the alkali release in cementitious systems to evaluate the compressive strength in mortars and ASR tests.
Acknowledgments
The authors thank the Facultad de Ingeniería (UNICEN) and the Centro de Geología Aplicada, Agua y Medio Ambiente (CGAMA, CIC-UNS) and the Geology Department of Universidad Nacional del Sur for their support. They also thank Viviana Colasurdo for her help with the alkali-determination techniques.
Funding
This work was supported by the Comisión de Investigaciones Científicas de la Provincia de Buenos Aires (CICPBA), the Consejo Nacional de Investigaciones Científicas y Técnicas (CONICET), the Universidad Nacional del Sur, and the Universidad Nacional del Centro de la Provincia de Buenos Aires.
Data Availability
Not applicable.
Code Availability
Not applicable.
Declarations
Conflicts of Interest/Competing Interests
On behalf of all authors, the corresponding author states that there is no conflict of interest.