INTRODUCTION
Rostral polymorphisms in shrimps are rather common phenomena, which can be observed in both marine (De Grave, Reference De Grave1999; Kapiris, Reference Kapiris2005; Kapiris & Kavvadas, Reference Kapiris and Kavvadas2009) and freshwater species (Anastasiadou et al., Reference Anastasiadou, Koukouras, Mavidis, Chartosia, Mostakim, Christodoulou and Aslanoglou2004; Ocasio-Torres et al., Reference Ocasio-Torres, Crowl and Sabat2015a). They are usually related to sexual dimorphism (d'Udekem d'Acoz, Reference d'Udekem d'Acoz1996; Kapiris & Thessalou-Legaki, Reference Kapiris and Thessalou-Legaki2001), reproductive age (Lozano-Álvarez et al., Reference Losano-Álvarez, Briones-Fourzán, Gracia and Vázquez-Bader2007), strategies for the avoidance of predation (Jugovic et al., Reference Jugovic, Prevorcnik, Aljancic and Sket2010; Ocasio-Torres et al., Reference Ocasio-Torres, Crowl and Sabat2014, Reference Ocasio-Torres, Giray, Crowl and Sabat2015b) and other micro-evolutionary factors. However, only in the species H. sapphica is the variation of the rostrum structure so sharp and discontinuous.
For the species of the genus Hippolyte the long, well-developed rostra, resembling that of morphotype A, seems to be the rule with only three exceptions (Ntakis et al., Reference Ntakis, Anastasiadou, Liasko and Leonardos2010). Moreover, the geographic distribution of H. sapphica morphotypes shows that form A is widely distributed in the Adriatic, Ionian, Aegean and Black Seas, whereas form B has a restricted distribution in the Central Mediterranean (Amvrakikos Gulf and Venice Lagoon) (d'Udekem d'Acoz, Reference d'Udekem d'Acoz1999 and references herein; Koukouras & Anastasiadou, Reference Koukouras and Anastasiadou2002). The above may suggest that form B could represent a derived character.
Hippolyte sapphica (Caridea: Decapoda: Crustacea) d'Udekem d'Acoz, Reference d'Udekem d'Acoz1993 is a small inshore shrimp, which is distributed in the Central and Eastern Mediterranean Seas (d'Udekem d'Acoz, Reference d'Udekem d'Acoz1993, Reference d'Udekem d'Acoz1996; Koukouras & Anastasiadou, Reference Koukouras and Anastasiadou2002). The species is marked by a sharp rostral dimorphism (morphotype A and B), which occurs in both sexes: individuals of morphotype A bear a long, robust, dentate rostrum, whereas those of morphotype B bear a short, toothless rostrum resembling that of juvenile specimens. The two morphotypes (forms) become distinguishable soon after the completion of their larval development (megalopal stage), and before the sex differentiation (first immature stage) (Ntakis et al., Reference Ntakis, Anastasiadou, Liasko and Leonardos2010).
The rostrum is a prominent structure, which in mature individuals can exceed the carapace length. One could speculate that the ‘loss’ or the ‘shortening’ of this anatomical feature (type B) must have some epigenetic compensatory effects on other morphological structures and functional unities of the shrimp's body. Moreover, in shrimps, the plastic phenotypical morphological changes could be consistently studied, as they may exceed variation due to genetic differences (Sardà et al., Reference Sardà, Bas, Roldán, Pla and Lleonart1998; Fernandes & Bichuette, Reference Fernandes and Bichuette2012).
Firstly, Ntakis et al. (Reference Ntakis, Anastasiadou, Liasko and Leonardos2010) confirmed the conspecific status of the two forms and later Liasko et al. (Reference Liasko, Anastasiadou, Ntakis and Leonardos2015) suggested that rostral length is genetically regulated by a simple locus, with allele b (morphotype B) being dominant. Furthermore, it has been shown that morphotype A specimens had a high propensity to become female (A/B ratio in females ~1 : 0.63), while the opposite was true for morphotype B specimens (A/B ratio in males 0.49 : 1). Likewise, A-phenotype turned out to be superior, in terms of viability, for big ovigerous females (Liasko et al., Reference Liasko, Anastasiadou, Ntakis and Leonardos2015).
Despite the above advances, the functional value of the long rostrum and how it contributes to viability is not entirely clear. The defence from predators is a natural explanation and has been advocated by some researchers (Covich et al., Reference Covish, Crowl, Hein, Townsend and McDowell2009; Jugovic et al., Reference Jugovic, Prevorcnik, Aljancic and Sket2010; Ocasio-Torres et al., Reference Ocasio-Torres, Crowl and Sabat2014, Reference Ocasio-Torres, Crowl and Sabat2015a, Reference Ocasio-Torres, Giray, Crowl and Sabatb). However, it is also argued that a long, robust rostrum diminishes the turbulent water flow behind the shrimp's body during a rapid escape backward movement (Burukovsky, Reference Burukovsky1972; Burukovsky & Romensky, Reference Burukovsky and Romensky1972; Sardà et al., Reference Sardà, Company and Costa2005), and thus decreases the energy expenditure while swimming.
Based on the above hypothesis, and since the effects of ‘rostral loss’ in H. sapphica have not been investigated to date, the present work aims to comparatively study the complete, detailed morphometry of the two forms (A and B). In this way, we attempt to benefit from this unique discontinuous rostral variability to draw eco-morphological conclusions about the adaptation of the species and its morphotypes. We expected that, since form A benefits females (Liasko et al., Reference Liasko, Anastasiadou, Ntakis and Leonardos2015), the females of form B must develop some compensatory traits, which would substitute for the lack of a long rostrum.
MATERIALS AND METHODS
Shrimp collection and laboratory observation
Shrimps were collected in June 2013 from Amvrakikos Gulf (39°13′961″N 20o45′971″E, NW Greece), at depth 0.5–2 m using a zooplankton net (mesh size 200 µm) in order to sample all the size classes of the species. Samples were fixed in situ with 4% formaldehyde solution. In the laboratory, samples were identified by stereo-microscopic inspection and by using a specialized key (d'Udekem d'Acoz, Reference d'Udekem d'Acoz1996). In the next step, sex and morphotype identification was accomplished by inspection of the second pleopod (appendix masculina) and rostrum, respectively. For the present study, only mature individuals with well-developed secondary sex characters (presence of appendix masculina) were measured and analysed, in order to avoid morphometric variation related to the developmental immature staging. The specimens and their appendages were photographed afterwards under a stereomicroscope and processed blindly by Zen 2012 image analysis software.
Morphometrics
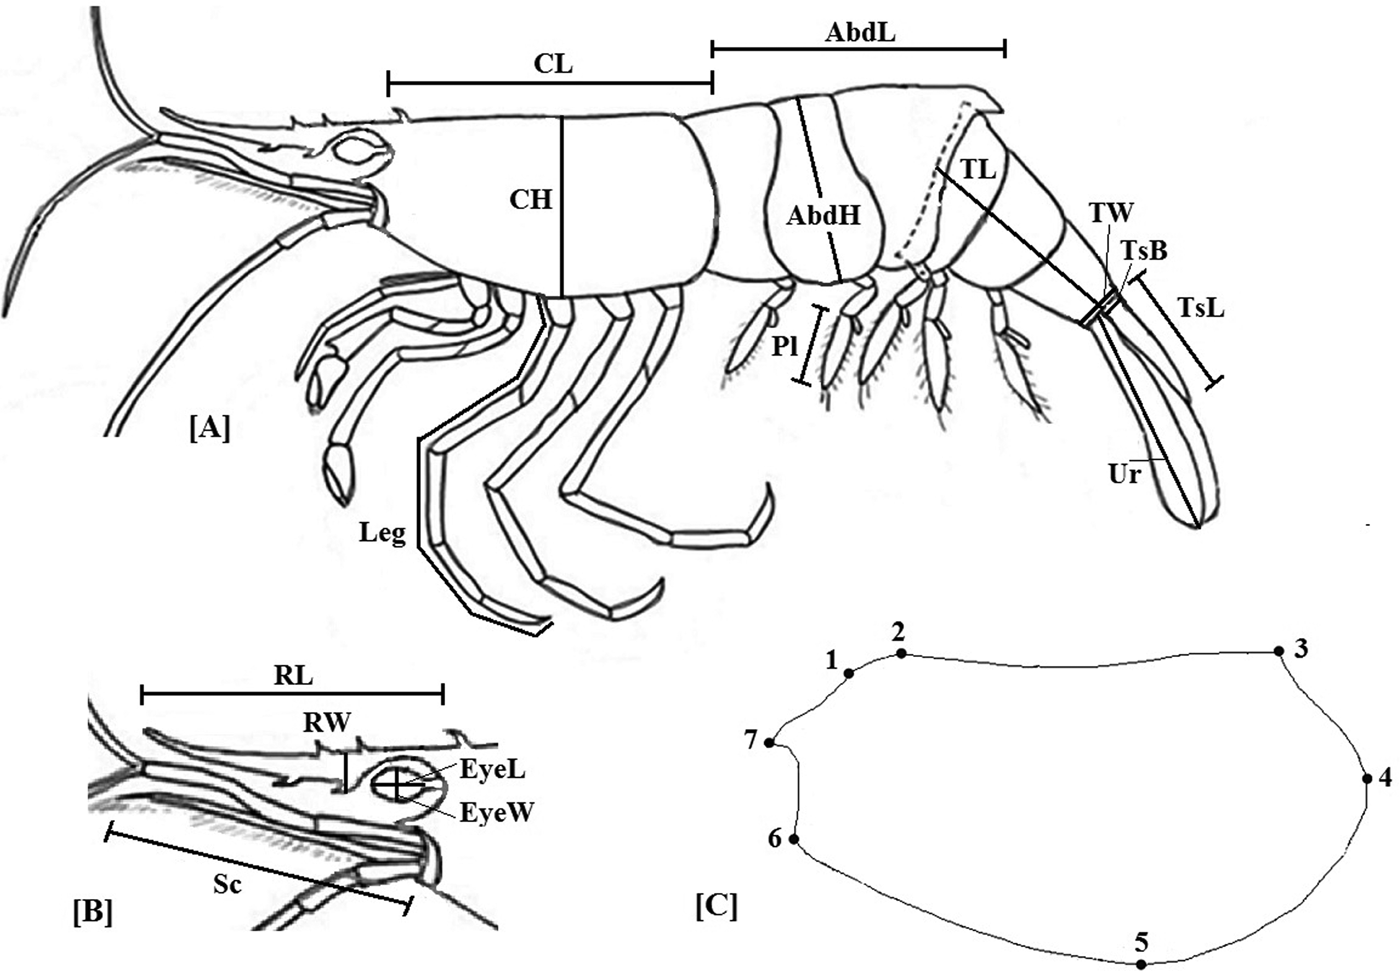
The morphometric measures reflected different aspects of its functional morphology (Sardà et al., Reference Sardà, Company and Costa2005; Kapiris & Kavvadas, Reference Kapiris and Kavvadas2009), such as vision (eye), defence and streamlining (rostrum), walking (pereiopod) and swimming ability (pleopod, tail, telson, uropod), orientation and maintaining direction (scaphocerite), metabolic (carapace) and reproductive (abdomen) capacity. All the morphometric variables (landmarks and distances), which were used in the present study, are shown in Figure 1. For the morphological study of the carapace, both distances and geometric morphometrics were used. For mobile structures, like tail and appendages, distances (and not landmarks) were preferred.
(A) Schematic representation of the whole body of Hippolyte sapphica. (B) The frontal part of carapace. (C) Carapace outline. Morphometric characters (distances and landmarks). Distances: AbdH: abdomen height; AbdL: abdomen length; CH: carapace height; CL: carapace length; EyeL: eye length; EyeW: eye width; Leg: 3rd pereiopod length; Pl – exopodite length of 2nd pleopod; RL: rostral length; RW: rostral width (height); Sc: scaphocerite length; TL: 4th to 6th somite length; TsB: Telson base length; TsL: telson length; TW – 6th somite basal width; Ur: exopodite length of uropod. Landmarks: 1: the rear-end of orbital margin; 2: postorbital tooth; 3: the dorsal most posterior point of carapace; 4: middle of the rear-most point of the carapace; 5: the ventral lowest point of carapace; 6: pterygostomian point of carapace; 7: antennal point of carapace.

Statistics
The allometric pattern for all distances was nearly linear and was studied by means of the linear least squares regression (character vs CL) for all groups pooled (except for the rostrum, for which the allometric patterns were calculated for the two forms separately). Allometric study of morphological traits is the simplest way to reveal their functional importance during different stages of the life history, uncover sexual dimorphisms etc. (e.g. Kapiris & Thessalou-Legaki, Reference Kapiris and Thessalou-Legaki2001; Kapiris, Reference Kapiris2005).
Furthermore, for distances, the general allometric trend (size effect) was removed according to the following formula (Lleonart et al., Reference Lleonart, Salat and Torres2000):
 $$Y_{\rm i}^* = Y_{\rm i} ({\rm CL}_{{\rm av}} /{\rm CL}_{\rm i} )^b, $$
where Y i is the original measure, CL is carapace length and b is the slope of linear regression of Y vs CL for all groups together. The remaining shape pattern was investigated by a variety of statistical procedures.
Normality of distribution was assessed by applying the Kolmogorov–Smirnov test. Effects of sex and form on morphometric variables were studied by MANOVA and ANOVA techniques (Tukey pairwise comparisons). In order to reduce dimensionality and obtain an illustrative representation of morphological differences, PCA with varimax rotation was run on original variables.
Finally, geometric morphometrics were applied for the study of the carapace shape and the landmarks’ shift was estimated by MANOVA. All statistical analyses were done using SPSS.23 software. Geometric morphometrics were performed by MorphoJ free software.
RESULTS
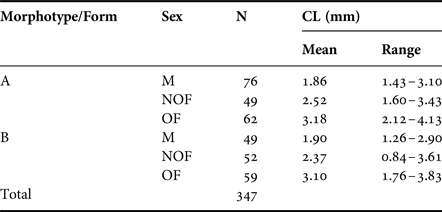
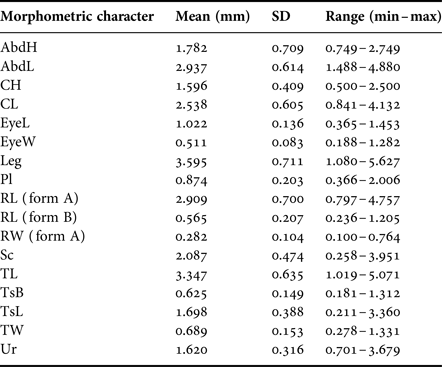
For the 347 shrimps’ individuals studied, the values of CL varied from 1.86 to 3.18 mm in form A and from 1.90 to 3.10 mm in form B (Table 1). The range corresponded to the mature stages of life history and was not biased for A or B form. All the descriptive statistics (pooled) for the distance morphometric characters studied are shown in Table 2.
Sample size, means and ranges of carapace length (CL, mm) given by sex and form for the individuals studied of H. sapphica.

N: number of individuals; M: Males; NOF: Non-ovigerous females; OF: Ovigerous females.
Descriptive statistics of the studied morphometric characters (for all groups pooled). SD: Standard Deviation.

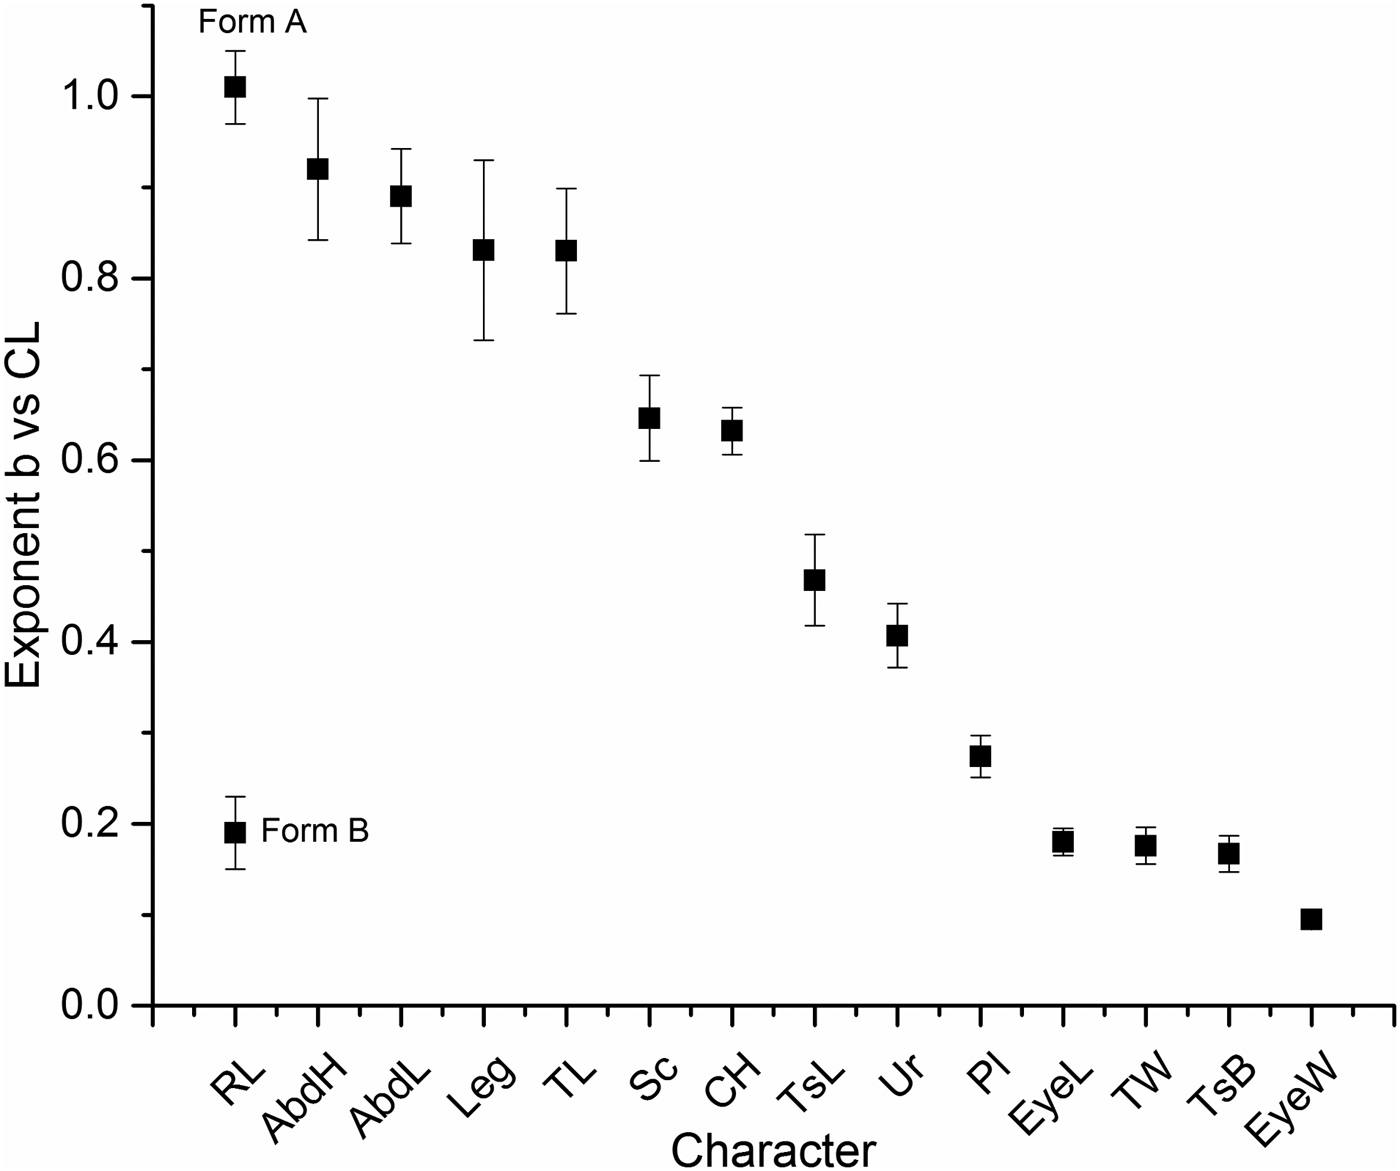
The allometric growth pattern was isometric for the rostral length (RL) in form A and negative allometric for the remaining characters. The slope (b) was found to have a wide variation across the studied morphometric variables, ranging from 0.10 for the eye's width (EyeW) to 1.02 for the rostral length (RL) in form A (Figure 2). The coefficients b for RL, AbdL, AbdH, Leg, TL, and to a lesser extent for Sc and CH were relatively close to isometric pattern. This finding suggests that the functional load (mechanical work and carrying capacity) of these morphological traits remains important as the animal grows.
Allometric growth patterns of different characters in H. sapphica. Bars show 95% CI.

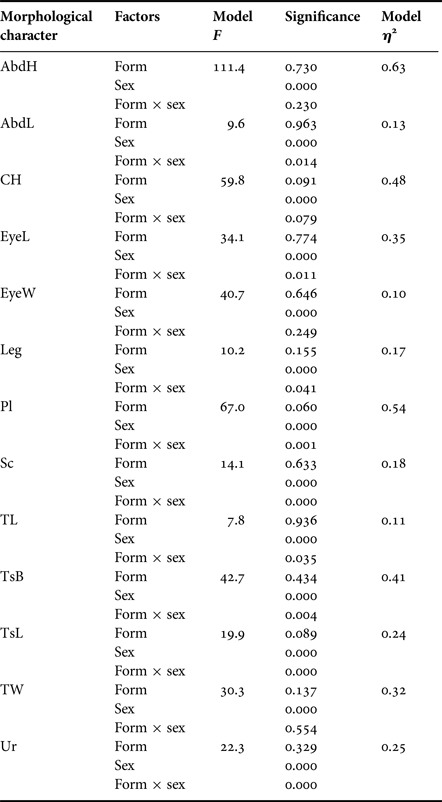
All departures of the morphometric variables from normality were related to kurtosis rather than to skewness, a fact that allows the application of parametric methods, which are robust for such violations. MANOVA run on the distance morphometric characters revealed significant effects of Sex factor (Wilk's L = 0.120; F = 25.9; P < 0.001; partial η 2 = 0.65) and of the interaction Sex × Form (Wilk's L = 0.79; F = 1.68; P = 0.022; partial η 2 = 0.11), but not of Form itself (Wilk's L = 0.92; F = 1.21; P = 0.273). The effects of the factors on particular morphometric characters were difficult to assess by MANOVA due to many missing values, which cases are excluded from the analysis listwise. Therefore, for this purpose, ANOVA was run for each character separately, since these analyses were independent from each other.
The results of multiple ANOVA revealed a strong influence of sex on all distance morphometric characters (Table 3). In all cases, the effect of form was not significant, but rather the interaction of form with sex (Table 3). More specifically, the male specimens of both forms did not demonstrate any significant difference for the characters studied, which suggests that rostrum loss has no serious impact on males.
ANOVA results for the studied morphometric characters given by sex and form factors.

The non-ovigerous females of form A had significantly higher relative values of the abdomen length, eye length, third pereiopod length, exopodite length of the 2nd pleopod, scaphocerite length, telson base length, telson length, and exopodite length of uropod (ANOVA, pairwise comparisons). We may thus conclude that these traits develop faster in A females, than in their B counterparts.
The morphological differences between the ovigerous females of form A and B were detected mostly in the relative total length of abdominal 4th to 6th somites (TL, P < 0.05) and in scaphocerite length (Sc, P < 0.001), characters which are responsible for driving force and steering respectively and which were more developed in individuals of form B. Finally, an important sexual dimorphic character was the rostral width (RW) in form A. The RW was found to significantly increase in the row males – non-ovigerous – ovigerous females (ANOVA, P < 0.001).
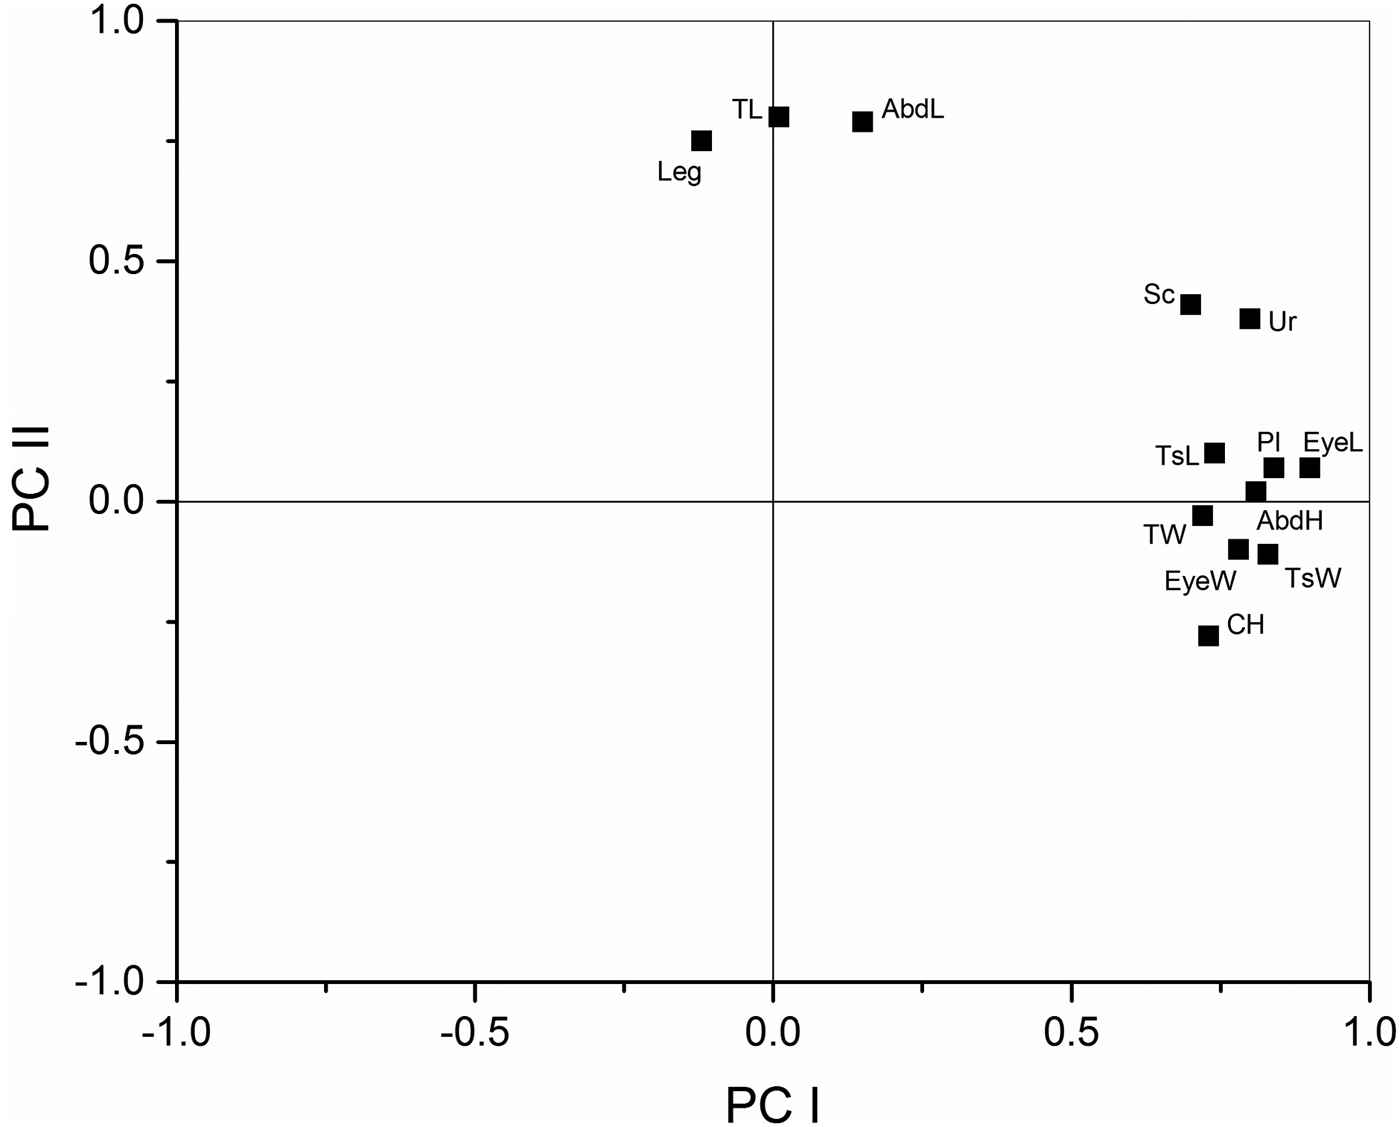
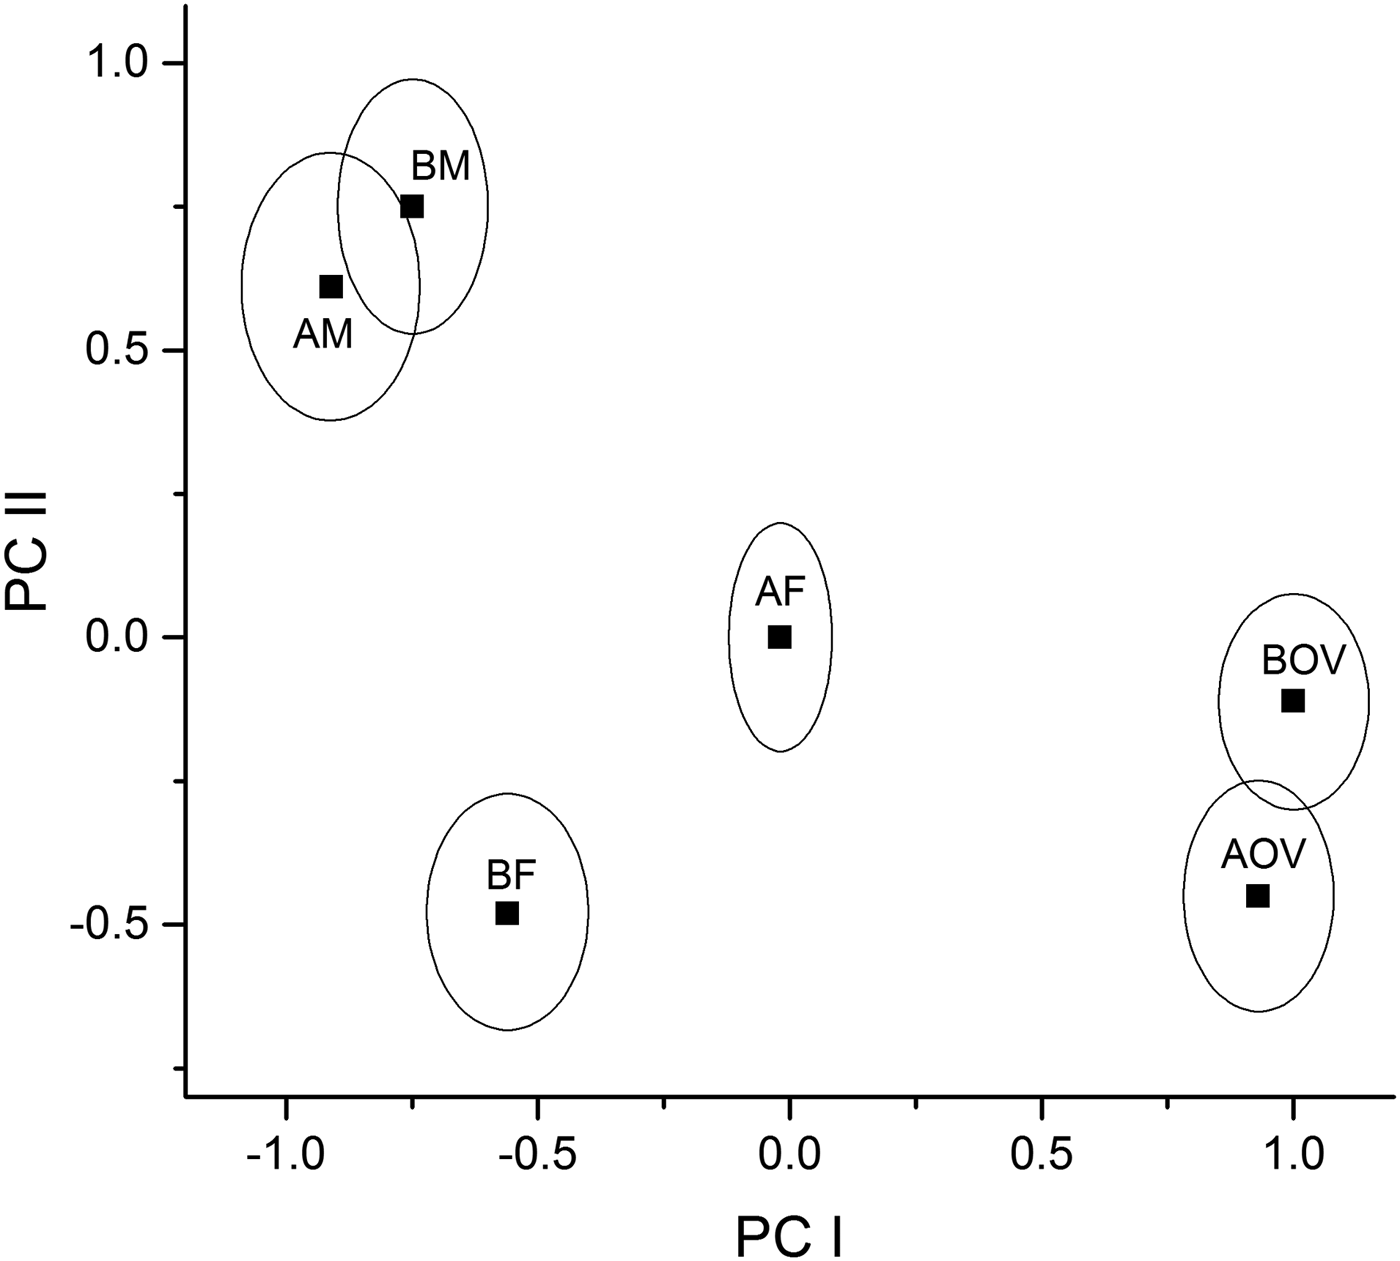
Principal component analysis (PCA), using the morphological distances as original variables, revealed two PCs (PC I and PC II, explaining the 65.3% of the total variance, Figure 3). PC I incorporated many morphological characters related to the body's lengths as well as to the shrimp's appendages, whereas the PC II was positively correlated with Leg, TL, AbdL and, to a lesser extent, with Sc and Ur (walking-swimming machinery). The mean values of the PCs along with the 95% of confidence intervals for the different sex/form groups are shown in Figure 4.
Principal component analysis loadings for the original morphometric characters.

Mean values of the PCs along with 95% confidence intervals (CI) for different sex groups. AM: form A males; BM: form B males; AF: form A non-ovigerous females; BF: form B non-ovigerous females; AOV: form A ovigerous females; BOV: form B ovigerous females.

In this concise representation, it is shown that the males of both forms have higher values of PC II, which is expected, since males are usually more active and mobile. Morphology of males of both forms was not significantly different (MANOVA, P = 0.43). Only the non-ovigerous females of form A had significantly higher values for both PCs (P < 0.001), whereas the ovigerous females of form B had a higher mean value for PCII, without reaching statistical significance (P = 0.082) because only TL and Sc were significantly different for those sex groups.
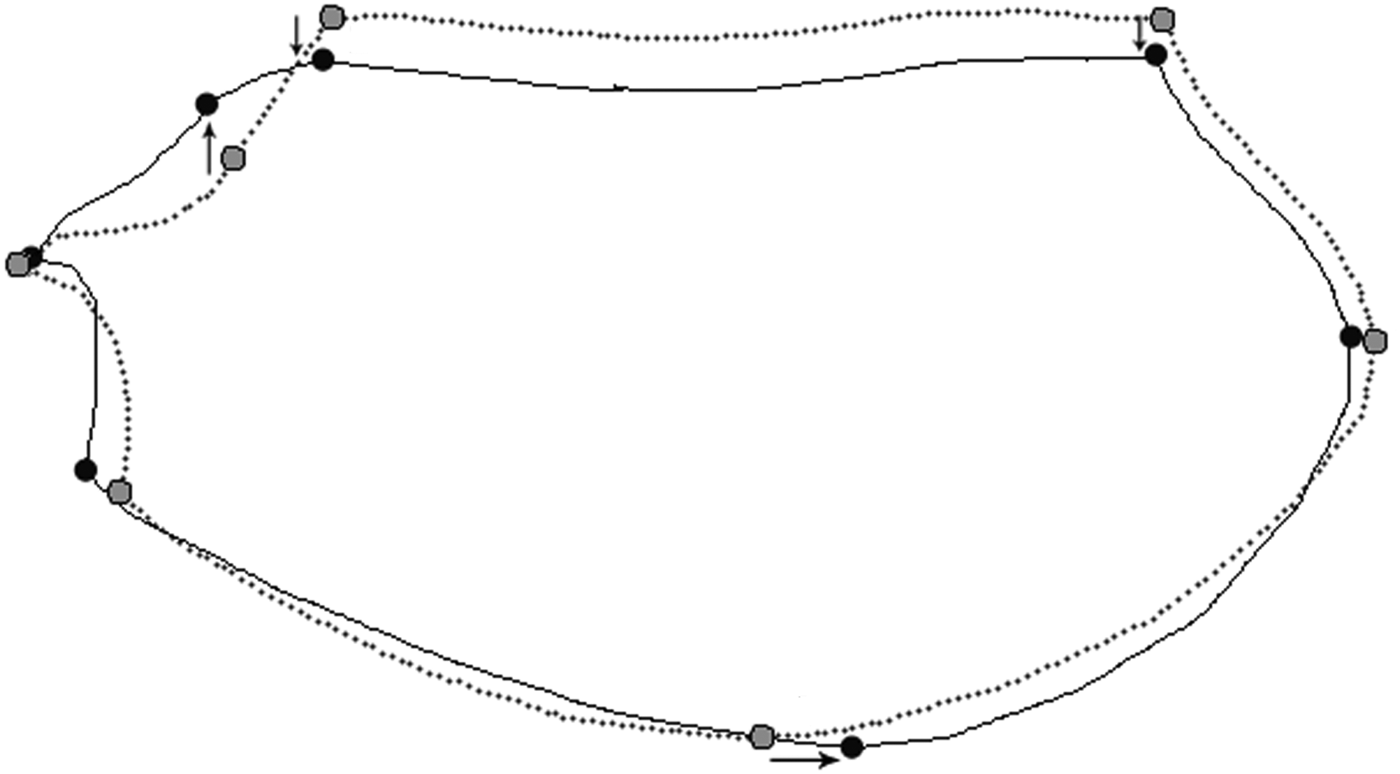
The geometric morphometric analysis did not reveal any differences in the carapace shape between A and B males. In non-ovigerous females, the carapace height (CH) was significantly higher in form A (Figure 5), whereas in ovigerous females this difference disappeared.
Mean carapace shapes (effect magnified two fold) for the non-ovigerous females after the geometric morphometric analysis. Dotted line: form A, continuous line: form B. The fleshes show statistically significant displacements.

DISCUSSION
All the morphometric characters studied showed negative allometric growth, except the rostral length (RL) in form A individuals, which is characterized by isometry, in accordance with relevant literature (Kapiris, Reference Kapiris2005). The strict isometry of the rostrum in H. sapphica indicates that this morphological character, like the carapace length, may perfectly serve as a growth and/or age marker of the species. The nearly isometric growth exhibited by the abdomen length and width, the 3rd pereiopod and the length of the 4th, 5th and 6th somites points out the great importance of the abdomen parts, and of the ‘walking/swimming machinery’ of the shrimp.
The present data show that the morphology of H. sapphica was highly influenced by sex. Sexual dimorphic characters have been widely studied across the crustacean species and may concern the rostrum (d'Udekem d'Acoz, Reference d'Udekem d'Acoz1997; Kapiris & Thessalou-Legaki, Reference Kapiris and Thessalou-Legaki2001) as well as the size and other body structures (Bertin et al., Reference Bertin, David, Cézilly and Alibert2002; Accioly et al., Reference Accioly, Lima-Filho, Santos, Barbosa, Santos Campos, Souza, Araújo and Molina2013). In our study, males had relatively more developed AbdL, TL, Leg, Sc and Ur, as PCII reveals. These characters all are related to the capacity of the escape movement and swimming. This is expected, since males are smaller, more mobile and active in many species (Correa & Thiel, Reference Correa and Thiel2003) including H. sapphica. As the body size increases in females (which are heavier than males), these characters seem to become functionally less important, i.e. the moving ability of the shrimp decreases. It can be observed, that in morphotype A, morphological differences have a clear pattern: high values of PCII in males, intermediate position of non-ovigerous females, and high values of PCI in ovigerous females. This pattern, however, is significantly blurred in B-morphotype, mainly because of female specimens.
An interesting and unexpected finding was the clear difference between the non-ovigerous females of forms A and B. More specifically, the non-ovigerous females of form A demonstrated a more developed carapace, abdomen and appendages. This could suggest that form A females develop more rapidly than their B counterparts and, therefore, may reach the reproductive age earlier. The underlying mechanisms of this difference are still unknown.
Differences between form A and B non-ovigerous females concerning the carapace height (CH) did not reach statistical significance when analysed by distance measurements (P = 0.079), but could be revealed by geometric morphometric analysis (MANOVA, P < 0.01; Figure 5). The majority of the carapace landmarks were of type II (i.e. defined geometrically, Bookstein, Reference Bookstein1991), but this should not affect the validity of our results, since the focus of our research was not to study strict homologies but the pure geometric form of the carapace. In such cases, all types of landmarks may be useful (Hingst-Zaher & de Moraes, Reference Hingst-Zaher and de Moraes2003). Therefore, our results suggest that when solid structures are under investigation, geometric morphometric means should be preferred against distance measurement analysis.
Finally, for the ovigerous female individuals, form B was characterized by relatively greater scaphocerite (Sc) and 4th to 6th somites’ lengths (TL). Tail is the structure that ensures rapid movements, whereas scaphocerite serves principally in steering (Sardà et al., Reference Sardà, Bas, Roldan, Pla and Lleonart1995). It seems reasonable to suppose that the over-development of these characters is related to the swimming needs of the form B specimens. A short rostrum, like in form B individuals, results in more turbulent water flow behind the shrimp during fast backward movements, which needs to be overcome (Burukovsky, Reference Burukovsky1972; Burukovsky & Romensky, Reference Burukovsky and Romensky1972). The observed elongation of TL and Sc morphometric characters in form B of H. sapphica may be explained in this way. Moreover, in form A individuals, the rostral width (RW) was significantly increased in the ascending order: RW (males) < RW (non-ovigerous females) < RW (ovigerous females). This result also points out the importance of a robust, wide rostrum in heavy individuals, for which a turbulent water flow becomes a problem to manage.
As has been shown previously (Liasko et al., Reference Liasko, Anastasiadou, Ntakis and Leonardos2015), the rostral morphology is probably controlled by a single locus, and individuals with long rostra have a propensity to become females, while the opposite occurs in form B specimens. In crustaceans, sex is controlled by a variety of mechanisms (Cook, Reference Cook2002) including size, since many shrimp species are protandric hermaphrodites (e.g. Zupo, Reference Zupo1994; Bauer, Reference Bauer2000; Baldwin & Bauer, Reference Baldwin and Bauer2003). The results discussed above show that this shift in the sex ratio has a clear adaptational value, since the males are not seriously affected by the short rostrum. If a molecular factor of rostral elongation is released from the brain and acts directly on the rostrum, it may also paracrinically affect the sex determination, the first step of which takes place nearby, in the eyestalk. This speculation needs to be tested in future research.
CONCLUSIONS
Eco-morphological consequences of the ‘rostral loss’ in a shrimp have been demonstrated for the first time, through the study of H. sapphica morphotypes, which was used as an animal model. The ‘rostral loss’ affects mainly the female individuals. Particularly, the non-ovigerous females develop more slowly, whereas ovigerous females are characterized by compensatory enlargement of some morphometric traits related to swimming ability, such as tail somites and scaphocerite.
ACKNOWLEDGEMENTS
The authors would like to thank undergraduate student N. Zagari for processing the samples.
FINANCIAL SUPPORT
This research received no specific grant from any funding agency, commercial or not-for-profit sectors.