Over the past four decades, the prevalence of childhood overweight and obesity has risen sharply worldwide globally(1). The WHO estimates that, by 2030, 254 million children aged 5–19 years will be affected(2). Overweight and obesity are strongly associated with numerous chronic diseases, including cardiometabolic disorders, cancers and psychosocial disorders(Reference Gurnani, Birken and Hamilton3), which together contribute substantially to healthcare costs(Reference Tremmel, Gerdtham and Nilsson4). Accordingly, preventing overweight and obesity has become a major public health priority.
Weight status is closely linked to nutritional behaviours (NB), such as physical activity (PA), sedentary behaviour (SB) and eating behaviours(Reference Kumar and Kelly5–Reference Pate, O’Neill and Liese8). For example, Poorolajal et al. demonstrated in a meta-analysis that PA reduces childhood obesity risk by 30 %, while SB and sugar-sweetened beverage consumption increase this risk by 42 % and 24 %, respectively(Reference Poorolajal, Sahraei and Mohamdadi9). In France, the national health authority recommends that childhood obesity management should focus not on weight loss but on promoting health through modifications in NB(10).
To this end, interventions have been developed to improve both weight status and NB(Reference Pearson, Pradeilles and Kingsnorth11). Evidence suggests that interventions delivered at the population level and requiring high individual engagement are generally effective, but they tend to benefit adolescents from socially more advantaged backgrounds disproportionately, thereby potentially widening social inequalities in weight status(Reference Beauchamp, Backholer and Magliano12,Reference Adams, Mytton and White13) (i.e. socially produced, unfair and systematic differences in weight status(Reference McCartney, Popham and McMaster14)). To elucidate the phenomenon of social inequalities, a number of theories have been proposed(Reference Bambra15), including cultural-behavioural approach. This approach argues that social inequalities arise from differences in health-related behaviours (e.g. NB) between socio-economic groups, and that some of these differences are the result of disadvantage. Sundmacher et al. demonstrated that the cultural-behavioural approach could account for the majority of health inequalities among male and female aged 16–35 years, in comparison with other theories(Reference Sundmacher, Scheller-Kreinsen and Busse16).
Based on this rationale, interventions based on the proportional universalism principle – that is, differentiated care management according to socio-economic status(Reference Carey, Crammond and De Leeuw17) – have been designed to reduce social inequalities in weight status among adolescents through education and NB modifications. One such intervention is the ‘Promotion de l’ALIMentation et de l’Activité Physique – INEgalités de Santé’ (PRALIMAP-INÈS) trial(Reference Briançon, Legrand and Muller18). This trial was shown to be effective in improving weight status, as reflected by a reduction in the BMI z-score (BMIz) by 0·08(Reference Briançon, Legrand and Muller18) and in reducing social inequalities in weight status(Reference Omorou, Langlois and Böhme19).
Nevertheless, further investigation is needed to assess the overall effectiveness of the intervention, not only on weight status but also on NB including PA, SB and eating behaviours. It can be hypothesised that the observed reduction in weight status is the result of an improvement in NB. However, some adolescents may have modified their NB that have not yet resulted in a change in weight status by the end of the PRALIMAP-INÈS trial, with effects on weight potentially emerging only over a longer period. This study therefore aimed to evaluate the overall effectiveness of the PRALIMAP-INÈS trial in reducing weight status and nutritional social inequalities among adolescents with overweight or obesity.
Methods
This study conforms with the CONSORT statement(Reference Hopewell, Chan and Collins20) (online Supplementary Table 1).
The PRALIMAP-INÈS trial
The present study is a secondary analysis of the PRALIMAP-INÈS trial. The PRALIMAP-INÈS trial was a mixed prospective multicentre French school-based study designed to evaluate the effectiveness of an intervention based on the proportional universalism principle in reducing social inequalities in weight status(21). The trial was conducted between 2012 and 2015 during one academic year in thirty-five middle and high schools located in the Vosges department of France. The only eligibility criterion for schools was to be a state administrative establishment in the Vosges department. Adolescents were measured (weight, height and waist circumference) by trained school nurses and/or clinical research nurses. If the immediate computer-calculated BMI indicated excess weight (i.e. BMI greater than the IOTF thresholds for overweight reduced by 1 kg/m2 for age and gender(Reference Cole, Bellizzi and Flegal22) and/or the waist circumference greater than the McCarthy cut-off values for age and sex(Reference McCarthy, Jarrett and Crawley23)), the adolescent was invited to a medical visit with a physician. During the medical visit, adolescents were invited to take part if they met the following inclusion criteria: the physician confirmed excess weight, an eating disorder was suspected and the adolescents requested excess weight management. Participants were divided into two groups according to their socio-economic status, as determined by the Family Affluence Scale: Less Advantaged (score ≤ 5) and Advantaged (score > 5)(Reference Currie, Molcho and Boyce24). The Family Affluence Scale comprises four questions pertaining to the availability of a personal bedroom, the number of family cars, the number of computers and the frequency of family holidays. The total score, which ranges from 0 to 9, is calculated by combining the responses to these questions. The group classified as advantaged received the standard intervention (i.e. five 2-h sessions were scheduled around the themes of healthy eating and PA). The group classified as less advantaged was randomly assigned to two groups: one received the standard intervention and one received the standard intervention and strengthened care (i.e. adapted activities for overcoming barriers attributable to social inequalities in diet and PA behaviours). The complete protocol and findings of the PRALIMAP-INÈS study have already been published(Reference Briançon, Legrand and Muller18,Reference Legrand, Lecomte and Langlois25) . The adolescents were included in the trial on the condition that they consented to participate and that parents did not express a written refusal to have their children participate in the interventions and consent to the anonymisation of their data for publication. The PRALIMAP-INÈS trial was approved by the French consultative committee for the treatment of information in health research (no. 12·299), the French National Commission for Data Protection and Liberties (no. 912372) and the French Persons Protection Committee (no. 2012/15) and is registered on ClinicalTrials.gov (NCT01688453).
Study sample
In total, there were 808 adolescents in the advantaged group and 415 adolescents in the less advantaged group. Given the PRALIMAP-INÈS aimed to evidence whether strengthened care management for less advantaged adolescents has an equivalent effect in reducing overweight as standard care management in advantaged adolescents, adolescents in the less advantaged group who received the standard care were not included in the current study. A total of 985 adolescents had data on weight status and NB at baseline (T0, before the intervention) and 1-year follow-up (T1, at the end of the intervention) and were included in the analysis (online Supplementary Figure 1).
Measurements
Weight status
Trained medical or paramedical personnel conducted anthropometric assessments, including measurements of weight, height and waist circumference, on the adolescents. BMI and BMIz were calculated. The BMIz was calculated as the distance between the measured BMI and the mean BMI of the WHO age- and sex-specific reference population(Reference de Onis, Onyango and Borghi26).
Nutritional behaviours
The PA and SB were quantified using a validated version of the International Physical Activity Questionnaire (IPAQ)(Reference Craig, Marshall and Sjöström27). The IPAQ is a tool that assesses the frequency and duration (min/d) of vigorous PA, moderate PA and walking time in the previous 7 d. SB was defined as leisure-time SB, namely the sitting position (min/d) adopted during screen time and leisure activities on weekdays and weekends. Eating behaviour was assessed using a French-specific FFQ, the ‘Boire, Manger, Bouger’(Reference Arrighi, Cornely and Pitot28). The frequencies of consumption per week of fruits and vegetables (FV) and sweetened products and beverages (SPB) were derived for the study.
Sociodemographic characteristics
The following variables were collected: age (year), sex (girl, boy), school type (vocational high school, general high school and middle school), age-for-grade status (delayed (due to grade retention), on-time, advanced (due to grade skipping)), school boarding status (non-boarder, half boarder and full boarder), socio-economic status (using Family Affluence Scale score) (highly less advantaged, less advantaged, intermediate, advantaged and highly advantaged), perceived family incomes (low, average and high), professional class of the family (executives, artisans farmers, intermediate professions, employees, workers and other) and number of responsible parents (none, one and two).
Outcomes
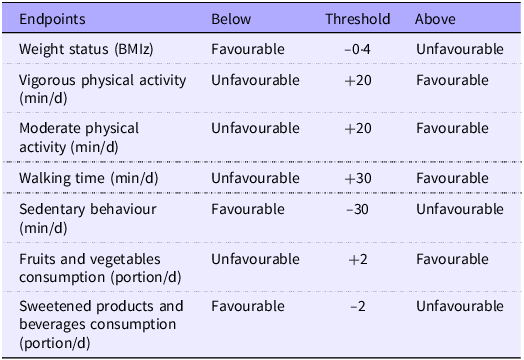
Outcomes were classified as favourable or unfavourable based on the 1-year change in BMIz and NB (Table 1). Based on Reiner et al. (Reference Reinehr, Lass and Toschke29), and on the graphical distribution of change in BMIz, a change of –0·4 units in BMIz was considered to be the threshold for a favourable outcome. Specifically, a decrease in BMIz of 0·4 units or greater was classified as ‘favourable’, whereas a decrease below this threshold was classified as ‘unfavourable’. For vigorous and moderate PA, the threshold was set at 30 min per d, in accordance with the Endocrine Society Clinical Practice Guideline(Reference Styne, Arslanian and Connor30). For walking time, the threshold was established at a value of +30 min per d. For SB, the threshold was set at a negative value of –30 min per d. The thresholds for walking time and SB were selected according to the recommendations set forth by Del Pozo-Cruz et al. (Reference Del Pozo-Cruz, García-Hermoso and Alfonso-Rosa31) The thresholds for FV and SBP consumption were set at +2 and –2 portions per d, respectively.
Values of weight and nutritional change thresholds

Table 1 Long description
A table with seven rows and three columns comparing various health and activity endpoints with their respective thresholds and outcomes. The columns are labeled 'Endpoints', 'Below', 'Threshold', and 'Above'. The row labels include 'Weight status (BMIz)', 'Vigorous physical activity (min/d)', 'Moderate physical activity (min/d)', 'Walking time (min/d)', 'Sedentary behaviour (min/d)', 'Fruits and vegetables consumption (portion/d)', and 'Sweetened products and beverages consumption (portion/d)'. Each row lists the threshold values and whether the outcomes are favorable or unfavorable based on these thresholds. For example, a decrease in BMIz of 0.4 units or greater is classified as favorable, while a decrease below this threshold is classified as unfavorable. The thresholds for vigorous and moderate physical activity are set at 20 minutes per day, with outcomes above this threshold being favorable. The threshold for walking time is set at 30 minutes per day, with outcomes above this threshold being favorable. The threshold for sedentary behavior is set at a negative value of 30 minutes per day, with outcomes below this threshold being favorable. The thresholds for fruits and vegetables consumption and sweetened products and beverages consumption are set at 2 portions per day, with outcomes above and below these thresholds being favorable and unfavorable, respectively.
BMIz, BMI z-score.
Statistical analyses
Baseline characteristics were described using the mean and standard deviations for continuous variables and percentages (numbers) for categorical variables. To assess for potential for selection bias, a comparison was made between adolescents who were present at the T1 visit (i.e. T1 completers) and those who were absent at the T1 visit (i.e. T1 non-completers) using Student’s t test or Wilcoxon signed-rank test for continuous variables and Pearson’s χ 2 test for categorical variables.
The generalised pairwise comparison (GPC) method proposed by Buyse was used to assess the overall effectiveness of the PRALIMAP-INÈS trial(Reference Buyse32). This method enables the hierarchical assessment of the intervention effect across multiple outcomes (i.e. weight status and NB) without reducing them to an arbitrary composite score. By comparing all possible pairs of adolescents between groups using predefined thresholds, GPC provides an interpretable estimate of the overall probability of benefit of the intervention. Seven outcomes were prioritised: BMIz (highest priority), vigorous PA, FV consumption, SB, SPB consumption, moderate PA and walking time (lowest priority). The priority was determined by the magnitude of the difference in the evolution of the outcomes between the less advantaged and advantaged groups. In essence, the GPC method involved a comparison between each adolescent in the less advantaged group and each adolescent in the advantaged group, resulting in a pairwise comparison. Each pairwise comparison is classified as follows: ‘favourable’ (if the adolescent in the less advantaged group had a better outcome than the adolescent in the advantaged group), ‘unfavourable’ (if the adolescent in the advantaged group had a better outcome than the adolescent in the less advantaged group), ‘neutral’ (if both adolescents had the same outcome) and ‘uninformative’ (if data were missing for at least one adolescent in the pair). The comparison is made first on the outcome with the higher priority level (i.e. BMIz). If the outcome is neither favourable nor uninformative, the comparison is performed with the next lower priority outcome, and so on until the outcome with the lowest priority (i.e. walking time) is reached. The GPC approach provides the net benefit (δ) for each outcome, which is the absolute difference between the proportion of favourable pairs and the proportion of unfavourable pairs. The sum of the δ values provides the overall net benefit (Δ). A negative net benefit indicates that the change in outcome was more favourable for the advantaged group than for the less advantaged group.
A 10 000-resampling bootstrap method was used to estimate CI and P-values with an α risk of 0·05. All analyses were performed using RStudio software (version 4.2.2) and the BuyseTest package (version 2.3.11).
Sensitivity analysis
The analysis was repeated without considering the prioritised outcomes, where all pairs were compared on all outcomes in a way that was independent of the priority of the outcome.
Results
The flow chart for the selection of the participants is shown in online Supplementary Figure 1.
Description of the study sample
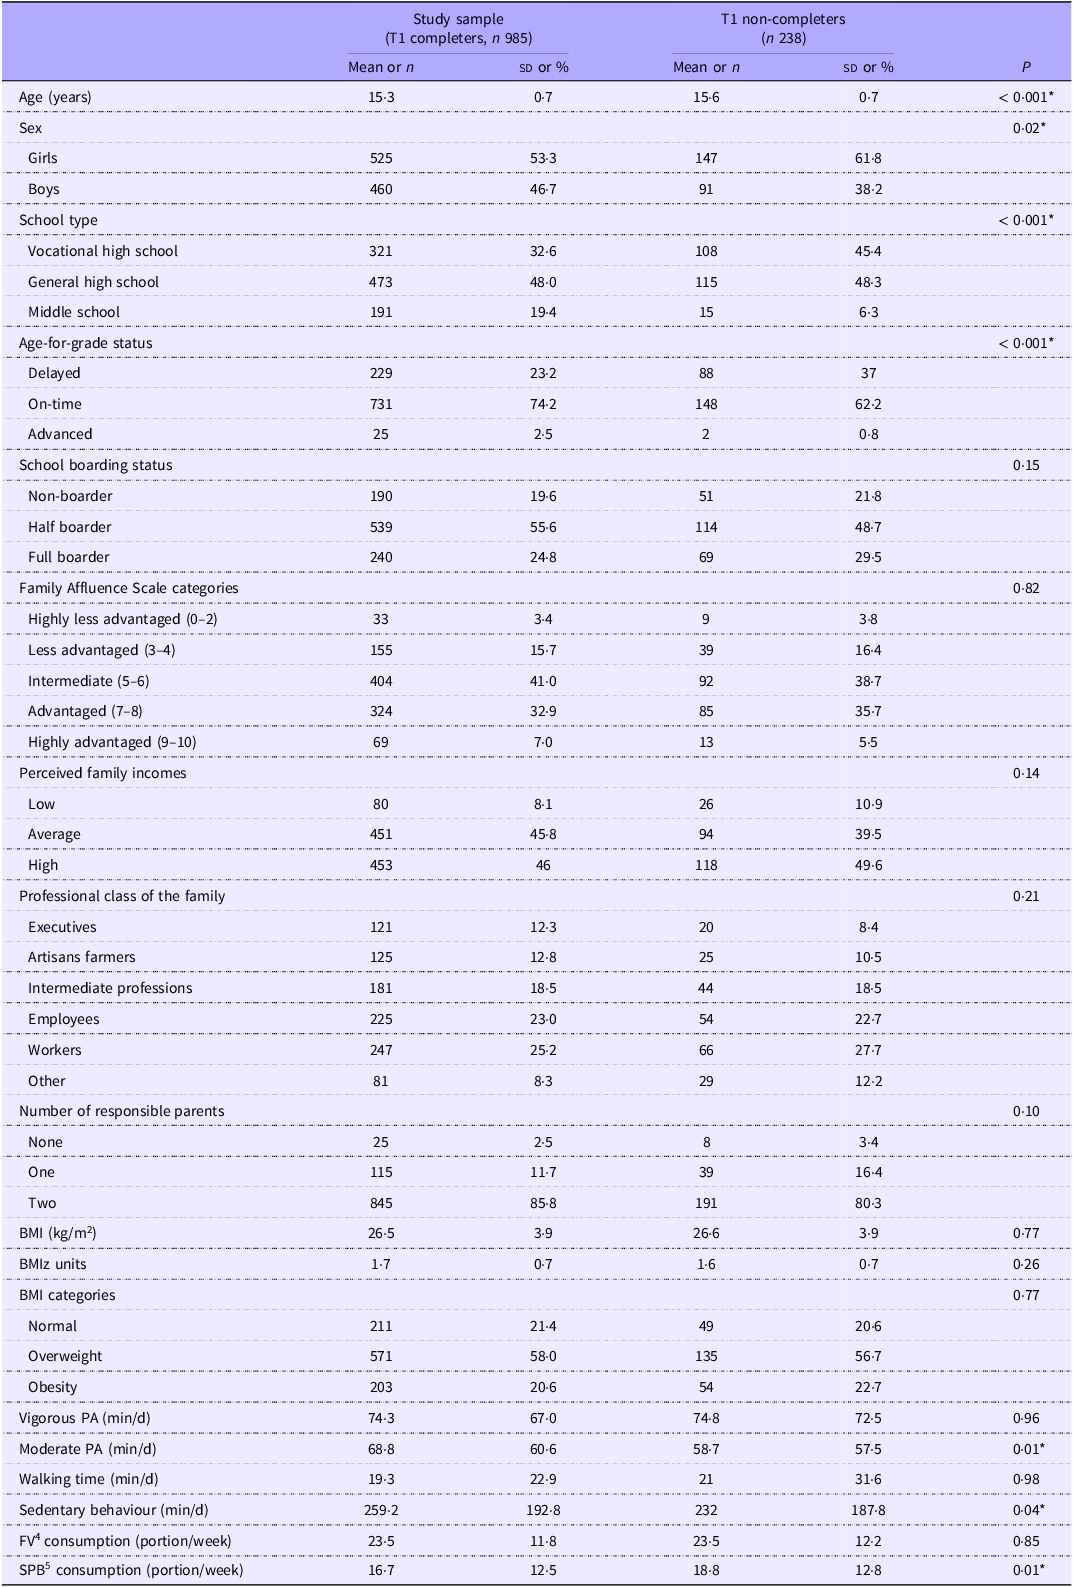
The 985 included adolescents had a mean age of 15·3 (sd 0·7) years, 53·3 % (n 525) were girls, 3·4 % (n 33) were highly less advantaged and 15·7 % (n 155) were less advantaged (Table 2). Mean (sd) BMIz, vigorous PA, SB and FV consumption were 1·7 (sd 0·7) units, 74·3 (sd 67·0) min/d, 259·2 (sd 192·8) min/d and 23·5 (sd 11·8) portions/week, respectively. T1 completers were younger, less likely to be girls, more likely to be in middle school and less likely to be delayed in their age-for-grade status than T1 non-completers. Regarding NB, T1 completers had more moderate PA and SB and consumed less SPB than T1 non-completers.
Baseline characteristics of study sample (T1 completers) and comparison with T1 non-completers

Table 2 Long description
A table comparing baseline characteristics of study sample (T1 completers) and T1 non-completers. The table has 25 rows and 7 columns. Columns are labeled as Study sample (T1 completers, n 985), T1 non-completers (n 238), and P. Rows include Age (years), Sex (Girls, Boys), School type (Vocational high school, General high school, Middle school), Age-for-grade status (Delayed, On-time, Advanced), School boarding status (Non-boarder, Half boarder, Full boarder), Family Affluence Scale categories (Highly less advantaged, Less advantaged, Intermediate, Advantaged, Highly advantaged), Perceived family incomes (Low, Average, High), Professional class of the family (Executives, Artisans farmers, Intermediate professions, Employees, Workers, Other), Number of responsible parents (None, One, Two), BMI (kg/m^2), BMI units, BMI categories (Normal, Overweight, Obesity), Vigorous PA (min/d), Moderate PA (min/d), Walking time (min/d), Sedentary behaviour (min/d), FV consumption (portion/week), SPB consumption (portion/week). Each row provides mean or number, standard deviation or percentage, and P value for the study sample and T1 non-completers.
BMIz, BMI z-score; PA, physical activity; FV, fruits and vegetables; SPB, sweetened products and beverages.
* indicates statistical significance.
Overall effectiveness of the PRALIMAP-INÈS trial
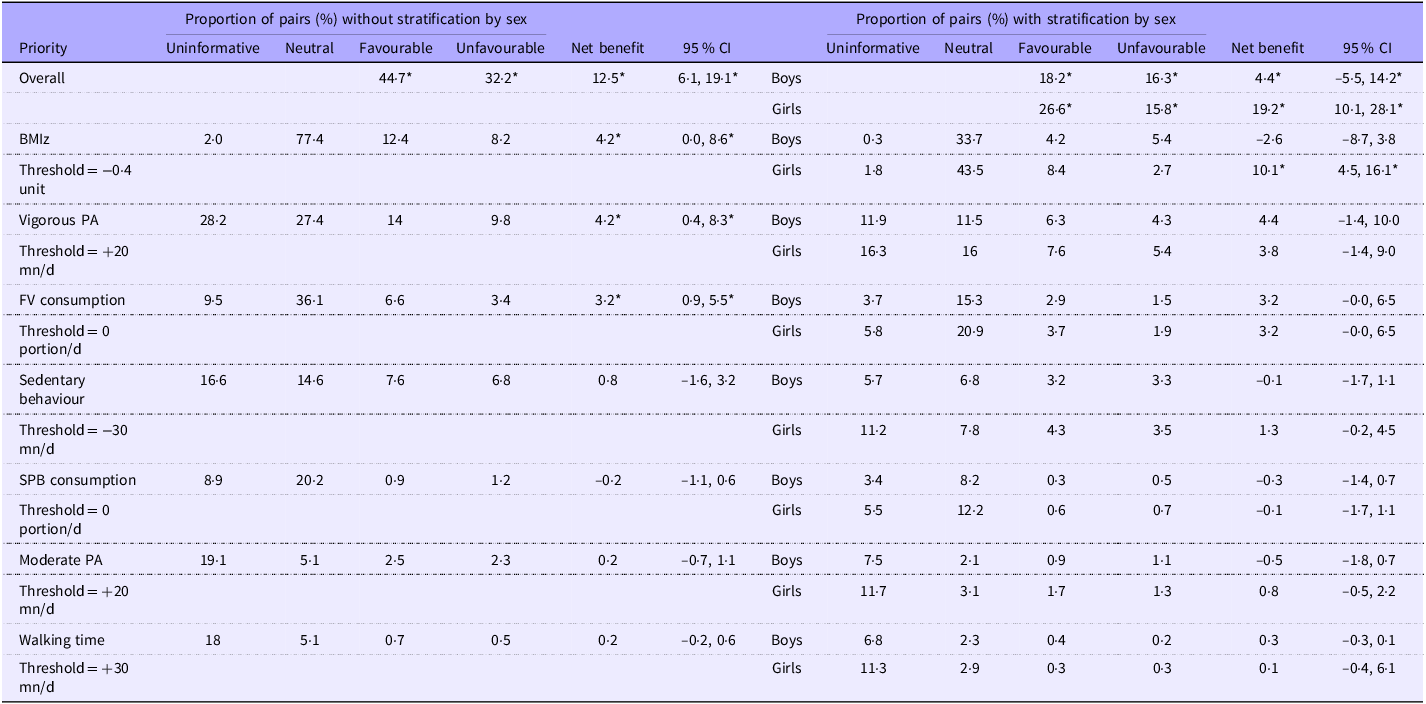
Compared with the advantaged group, adolescents in the less advantaged group were more likely to have favourable outcomes. Compared with adolescents in the advantaged group, adolescents in the less advantaged group had an overall net benefit of 12·5 % (95 % CI (6·1, 19·1)) with prioritised outcomes (Table 3, Figure 1). A total of 4·2 (0·0, 8·6) percentage points of the overall net benefit (i.e. about one-third) was related to the net benefit of weight status. The net benefits of vigorous PA, FV consumption, SB, SPB consumption, moderate PA and walking time were 4·2 % (0·4, 8·3), 3·2 % (0·9, 5·5), 0·8 % (–1·6, 3·2), –0·2 % (–1·1, 0·6), 0·2 % (–0·7, 1·1) and 0·2 % (–0·2, 0·6), respectively. In stratified analyses, compared with a girl in the advantaged group, a girl in the less advantaged group was more likely to have a favourable change in outcome (Δ = 19·2 %, (10·1, 28·1)), whereas there was no evidence for boys (Δ = 4·4 %, (–5·5, 14·2)).
Overall effectiveness of PRALIMAP-INÈS trial on weight status and nutritional behaviour changes

Table 3 Long description
A table comparing the effectiveness of a trial on weight status and nutritional behavior changes. The table has 10 rows and 14 columns. The columns are labeled as follows: Priority, Proportion of pairs (%) without stratification by sex (Uninformative, Neutral, Favourable, Unfavourable, Net benefit, 95% CI), Proportion of pairs (%) with stratification by sex (Uninformative, Neutral, Favourable, Unfavourable, Net benefit, 95% CI). The rows are labeled as Overall, BMiz, Vigorous PA, FV consumption, Sedentary behaviour, SPB consumption, Moderate PA, Walking time. Each row provides data for boys and girls separately. For example, the Overall row shows that boys have 44.7% uninformative, 32.2% favourable, 12.5% unfavourable, with a net benefit of 6.1 and a 95% CI of 1.9 to 1.1. Girls have 18.2% uninformative, 16.3% favourable, 4.4% unfavourable, with a net benefit of 5.5 and a 95% CI of 14.2. The table provides detailed data on the effectiveness of the trial across different priorities and sex stratifications.
PRALIMAP-INÈS, Promotion de l’ALIMentation et de l’Activité Physique – INEgalités de Santé; BMIz, BMI z-score; PA, physical activity; FV, fruits and vegetables; SPB, sweetened products and beverages.
* indicates statistical significance.
Net benefits of each prioritised outcome and stratification by sex and overall net benefit. Net benefits for each sex and global net benefit for each prioritised outcome: blue column for boys, pink column for girls and black column for global net benefit. Overall net benefit for boys: blue dashed line with blue squares. Overall net benefit for girl: pink dashed line with pink points. Global overall net benefit: black dashed line with black triangles. BMIz, BMI z-score; PA, physical activity; FV, fruits and vegetables; SB, sedentary behaviour; SPB, sweetened products and beverages.

Figure 1 Long description
Panel A: A bar graph comparing the net benefits of various health outcomes for boys, girls, and globally. The horizontal axis lists categories: B M I z, Vigorous P A, F V consumption, S B, S P B consumption, Moderate P A, and Walking time. The vertical axis measures Delta percent. The graph includes blue bars for boys, pink bars for girls, and black bars for global net benefit. Panel B: A line graph showing overall net benefits for boys, girls, and globally. The horizontal axis lists the same categories as Panel A. The vertical axis measures Delta percent. The graph includes a blue dashed line with squares for boys, a pink dashed line with points for girls, and a black dashed line with triangles for global net benefit.
Sensitivity analysis
Without prioritised outcomes, compared with the advantaged group, adolescents in the less advantaged group were more likely to have favourable outcomes, with an estimated overall net benefit of 19·7 % (9·1, 30·6 %) (online Supplementary Table 2). When stratified by sex, the overall net benefit was not significant for boys (Δ = 7·5 %, (–8·6, 23·5)) and significant for girls (Δ = 29·6 %, (15·5, 43·9)).
Discussion
The findings of this study demonstrate the overall effectiveness of the PRALIMAP-INÈS trial in reducing social inequalities in weight status and NB. In particular, less advantaged adolescents were 12·5 % more likely to experience a favourable change in weight status and NB than advantaged adolescents.
Differences between the GPC with prioritised outcomes and the GPC without prioritised outcomes suggest some correlation between NB(Reference Manz, Mensink and Finger33, Reference Parker, Salmon and Brown34). For example, with prioritised outcomes, the net benefit for FV consumption was 3·2 %, meaning that among adolescents who had neither a favourable nor unfavourable change in BMIz and vigorous PA, less advantaged adolescents were 3·2 % more likely to have a better outcome for FV consumption than advantaged adolescents. Without the prioritised outcomes, the net benefit of FV consumption was 6·3 % (about twice as high as with the prioritised outcome), meaning that among all adolescents, less advantaged adolescents were 6·3 % more likely to have a better FV consumption outcome than advantaged adolescents. This suggests that a relatively high proportion of less advantaged adolescents who had better FV consumption also had better changes in BMIz and vigorous PA. The same observation can be made for the walking time (net benefit of walking time was 0·2 % with prioritised outcome and net benefit of walking time was 1·9 % without prioritised outcome). From an intervention perspective, as favourable changes in FV consumption, PA and BMI appear to be correlated, multicomponent programmes targeting all this NB simultaneously may produce synergistic effects in reducing social inequalities in weight status.
Stratified analyses showed that the overall net benefit was not statistically significant in boys and was statistically significant in girls. These results are consistent with the main results of the PRALIMAP-INÈS trial, which found a non-superior change in BMIz in boys and a non-inferior change in BMIz in girls(Reference Briançon, Legrand and Muller18). In a meta-analysis, Mast et al. found no sex differences in the change in weight status after a lifestyle intervention(Reference Mast, Peña and Bolch35). However, this meta-analysis did not evaluate NB changes and did not consider socio-economic status. Our analysis provided the additional probability of having a better outcome compared with someone of the same sex, rather than the average effect size of the modification, and this may explain these inconsistent results. Sundmacher et al. found that the cultural-behavioural approach (including ‘exercise’ and ‘weight problems’) accounted for a higher proportion of social inequalities in health among women than men aged 16–35 years(Reference Sundmacher, Scheller-Kreinsen and Busse16). As the PRALIMAP-INÈS intervention used this approach to reduce the social inequalities in weight status, this may explain the difference in effectiveness between boys and girls. For example, for the prioritised outcomes, the net benefit on BMIz was –2·6 % for boys and 10·1 % for girls. Given the existing difference between boys and girls in their NB (e.g. higher levels of PA in boys than girls)(Reference Guthold, Stevens and Riley36,Reference Spencer, Rehman and Kirk37) and its association with weight status, it is possible that the cultural-behavioural approach may contribute disproportionately more to reducing social inequalities for girls than for boys. To improve the effectiveness of further interventions, levers and brakes need to be identified for each sex, and sex needs to be taken into account in their design(Reference Mast, Peña and Bolch35,Reference Guthold, Stevens and Riley36,Reference Clayton38) . For example, intervention on NB could be adapted to the PA and food preference of boys and girls. Boys might prefer more unstructured PA, high-fat and sugary foods, meat, fish and poultry and consume more energy content from sugar-sweetened beverages, whereas girls might prefer organised PA and FV but consume more energy content from fast food(Reference Mast, Peña and Bolch35).
Limitations of this study include the number of adolescents lost to follow-up (19·5 %), which could lead to a potential selection bias, and limit the generalisability of our results. The use of self-administered questionnaires could lead to a potential reporting bias. However, it did not seem technically feasible to use any other approach to estimate PA levels or eating behaviours in adolescents. Prioritisation was chosen according to the effect size of the changes in NB components and could influence the results of the GPC, but the literature does not answer the question of which NB component is more important to change to improve the weight status. Also, analyses without prioritised outcomes did not change the direction of the results, which could give confidence in our findings. Strengths of the study include the longitudinal design of PRALIMAP-INÈS, the sample size and the objective measurement of the weight status, which give confidence in the reliability of the results. The consideration of multiple NB and anthropometric outcomes strengthens the robustness of the findings. GPC is a new approach that allows multiple outcomes to be considered in one analysis, thus estimating the overall benefit of the PRALIMAP-INÈS intervention, not just the change in weight status. Furthermore, this approach does not provide the average change in outcome for each group, but the trend for the less advantaged group to have a better outcome than the advantaged group, that is, the potential of the PRALIMAP-INÈS intervention potential to reduce the social inequalities in weight status. The prioritised structure of the GPC made it possible to estimate the change in NB in adolescents who did not change their weight status. A long-term effectiveness of the intervention could be expected, not only on weight status but also on health in general, with healthier eating behaviours and PA. Furthermore, according to the ‘fat but fit’ paradigm, these health benefits could be expected even if there is no change in weight status(Reference Ortega, Ruiz and Labayen39–Reference Weisstaub, Gonzalez Bravo and García-Hermoso41).
Conclusion
Overall, this study provides evidence that school-based interventions grounded in a proportionate universalism approach could reduce social inequalities in both weight status and NB. It showed an overall beneficial effect of the PRALIMAP-INÈS trial in reducing social inequalities in weight and NB among adolescents with overweight or obesity. The short-term effectiveness of the PRALIMAP-INÈS trial on both weight status and NB outcomes suggests that long-term effectiveness on weight status could be expected from NB changes (if they are maintained over time). In general, these findings suggest that the evaluation of the effectiveness of health promotion trials should not be limited to a single outcome but should instead consider intermediate outcomes to estimate their potential long-term benefit.
Supplementary material
For supplementary material/s referred to in this article, please visit https://doi.org/10.1017/S0007114526107211
Acknowledgements
Many people worked together selflessly and enthusiastically to make the PRALIMAP-INÈS trial a success. The PRALIMAP-INÈS trial group warmly acknowledges the students and their parents who participated in the measurements and interventions and the school professionals (nurses, teachers, administrative staff and headmasters’ staff) who contributed to the recruitment of students and delivery of the interventions.
This work was supported by the French National Cancer Institute (Institut National du Cancer). It also received support from the public sector (Conseil Régional de Lorraine and Agence Régionale de Santé).
A. D.: Methodology, Visualisation, Data curation, Formal analysis and Writing – Original draft preparation; J. L.: Writing – Review and Editing; P. B.: Writing – Review and Editing; E. L.: Writing – Review and Editing; K. L.: Writing – Review and Editing; E. S.: Writing – Review and Editing; S. B.: Writing – Review and Editing; F. M.: Conceptualisation, Methodology, Formal analysis, Writing – Review and Editing, and Supervision; A. Y. O.: Conceptualisation, Methodology, Writing – Review and Editing, and Supervision. All authors read and approved the final manuscript.
There are no conflicts of interest.
The data underlying this article cannot be shared publicly due to the privacy of individuals who participated in the study.