Introduction
The diamondback moth (DBM), Plutella xylostella (L.) (Lepidoptera: Plutellidae), is one of the most destructive insect pests of Brassica vegetable and oilseed crops worldwide (Zalucki et al., Reference Zalucki, Shabbir, Silva, Adamson, Liu and Furlong2012; Furlong et al., Reference Furlong, Wright and Dosdall2013) and it can be particularly problematic in parts of China (Li et al., Reference Li, Feng, Liu, You and Furlong2016). Females are oligophagous, laying eggs on a wide range of host plant genera in the Brassicaceae (Zhang et al., Reference Zhang, Lü, Zalucki and Liu2012). DBM larvae feed on the foliage of their host plants from the seedling stage to harvest, greatly reducing the yield and quality of produce (Furlong et al., Reference Furlong, Wright and Dosdall2013). It is estimated that the worldwide annual DBM management costs and lost production amount to approximately US$ 4–5 billion (Zalucki et al., Reference Zalucki, Shabbir, Silva, Adamson, Liu and Furlong2012).
The pest status of DBM appears to have increased since the large-scale widespread application of chemical insecticides to vegetable crops that has occurred over the past 50 years (Talekar & Shelton, Reference Talekar and Shelton1993; Furlong et al., Reference Furlong, Wright and Dosdall2013) and the pest has evolved resistance to every class of insecticide used to date (Heckel, Reference Heckel, Endersby and Ridlands2004; Feng et al., Reference Feng, Li, Wu, Chen, Wu, Hou, He, Li, Xie, Zhang, Fu, Ma, Srinivasan, Shelton and Collins2011; Furlong et al., Reference Furlong, Wright and Dosdall2013). Ecological studies have investigated the causes of DBM mortality in the field through the construction of life-tables (e.g., Harcourt, Reference Harcourt1963; Iga, Reference Iga1985; Wakisaka et al., Reference Wakisaka, Tsukuda, Nakasuji and Talekar1991) or the exclusion of natural enemies (e.g., Furlong et al., Reference Furlong, Shi, Liu, Guo, Lu, Liu and Zalucki2004a , Reference Furlong, Shi, Liu and Zalucki b , Reference Furlong, Kim, Pak, Jo, Ri and Zalucki2008). These studies show that parasitoids and predators can exert strong effects on DBM populations, and successful classical biological control of DBM can be achieved if broad-spectrum insecticide use is reduced (Furlong et al., Reference Furlong, Wright and Dosdall2013). This suggests that DBM is an induced or secondary pest, at least in temperate areas and in the cooler high altitude regions of the tropics where Brassica vegetable crops are typically grown.
For such a major pest, surprisingly little research has been conducted on long-term population dynamics and the forecasting of populations (but see Zalucki & Furlong, Reference Zalucki, Furlong, Shelton, Collins, Zhang and Wu2008, Reference Zalucki, Furlong, Srinivasan, Shelton and Collins2011). DBM abundance can vary greatly among years (Zalucki & Furlong, Reference Zalucki, Furlong, Shelton, Collins, Zhang and Wu2008, Reference Zalucki, Furlong, Srinivasan, Shelton and Collins2011), and the great difficulties in its management have resulted in the occurrence of population outbreaks and insecticide resistance (e.g., Endersby & Ridland, Reference Endersby, Ridland, Sivapragasam, Loke, Hussan and Lim1997; Shelton, Reference Shelton, Endersby and Ridlands2004; Shelton et al., Reference Shelton, Collins, Zhang and Wu2008; Feng et al., Reference Feng, Li, Wu, Chen, Wu, Hou, He, Li, Xie, Zhang, Fu, Ma, Srinivasan, Shelton and Collins2011). Timely forecasts of abundance, particularly outbreaks, would be useful for determining insecticide budgets, hiring additional crop scouts or making strategic decisions on which crops to plant. However, in practice, such forecasts are difficult to achieve, in part due to the difficulty of defining initial conditions or appropriate ‘bio-fixes’ and the difficulty in forecasting weather (Maelzer & Zalucki, Reference Maelzer and Zalucki1999, Reference Maelzer and Zalucki2000).
As for all insects, climate has a major effect on DBM distribution and abundance (Zalucki & Furlong, Reference Zalucki, Furlong, Shelton, Collins, Zhang and Wu2008, Reference Zalucki, Furlong, Srinivasan, Shelton and Collins2011; Li et al., Reference Li, Zalucki, Bao, Chen, Hu, Zhang, Lin, Yin, Wang and Feng2012) and it also affects its seasonal phenology and population dynamics (Collier & Finch, Reference Collier, Finch, Endersby and Ridland2004; Mohandass & Zalucki, Reference Mohandass, Zalucki, Endersby and Ridlands2004; Marchioro & Foerster, Reference Marchioro and Foerster2011). Further, rainfall can have dramatic effects on DBM populations (Harcourt, Reference Harcourt1963; Iga, Reference Iga1985; Annamalai et al., Reference Annamalai, Ito and Saito1988; Wakisaka et al., Reference Wakisaka, Tsukuda, Nakasuji and Talekar1991). In the tropics, the species' short generation time and the year round availability of host plants mean that populations can build up to high levels, even when temperatures are high. Liu et al. (Reference Liu, Chen and Zalucki2002) showed that both extreme high and low temperatures can be deleterious to immature survival, and adult fecundity is adversely affected when immature DBM are reared at temperature extremes (e.g., Lu et al., Reference Lu, Chen and Zhu1988).
Interpreting insect population dynamics is difficult because many factors influence abundance (see e.g., Yonow et al., Reference Yonow, Zalucki, Sutherst, Dominiak, Maywald, Maelzer and Kriticos2004; Zalucki & Furlong, Reference Zalucki and Furlong2005; Schellhorn et al., Reference Schellhorn, Pierce, Bianchi, Williams and Zalucki2008; Muthuthantri et al., Reference Muthuthantri, Maelzer, Zalucki and Clarke2010). Long-term population data sets based on counts of adult DBM in light or pheromone traps are confounded as the series represent the effects of local climate, cropping patterns, natural enemies and insecticide use. Further, as DBM can migrate (e.g., Wei et al., Reference Wei, Shi, Gong, Jin, Chen and Meng2013), the effects of these factors in source regions can also influence abundance in regions into which DBM moves (Zalucki & Furlong, Reference Zalucki, Furlong, Srinivasan, Shelton and Collins2011)! However, well-crafted models that describe the effects of climate on population dynamics can be used as an aid in the interpretation of population changes and the impacts that management practices might have (e.g., Carriere et al., Reference Carriere, Ellers-Kirk, Sisterson, Antilla, Whitlow, Dennehy and Tabashnik2003).
Zalucki & Furlong (Reference Zalucki, Furlong, Shelton, Collins, Zhang and Wu2008, Reference Zalucki, Furlong, Srinivasan, Shelton and Collins2011) developed a CLIMEX model for DBM and estimated its potential global geographical distribution. They then used this model to analyse independent seasonal abundance (phenology) data for DBM at various locations, historical population dynamics of DBM in Hangzhou China, and DBM outbreak events in the British Isles that have occurred since 1950. Li et al. (Reference Li, Zalucki, Bao, Chen, Hu, Zhang, Lin, Yin, Wang and Feng2012) used the same model to interpret DBM population dynamics in Guangdong, China. Here we describe and verify an age-structured population model for DBM written in DYMEX (Maywald et al., Reference Maywald, Kriticos, Sutherst and Bottomley2007) using historical pheromone trap data from eastern China. We then use the model to analyse and interpret patterns of DBM abundance data from 2000 to 2012 across a wide latitudinal gradient from the tropical southeast (Haikou, 20.02°N) to the cold temperate northeast (Chifeng, 49.00°N).
Methods
In order to investigate the relative contribution of climate and crop management practices on the population dynamics of this pest we first summarize historic pheromone trapping data of this pest across a wide latitudinal range in China. We then present the DYMEX population model for DBM. We use the model to simulate within and between year variations in DBM abundance for the same sites as the pheromone trapping data, using climate data for each site from 2000 to 2012. We run simulations with and without a parasitoid and with and without insecticide sprays, for various immigration scenarios. For one location, Guangzhou, we investigate the effect of crop planting and hygiene.
Historical population dynamics of DBM in China
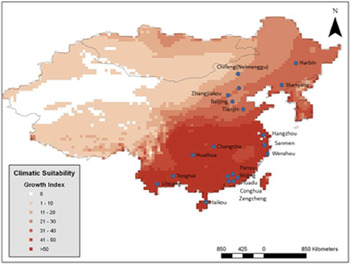
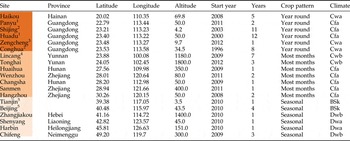
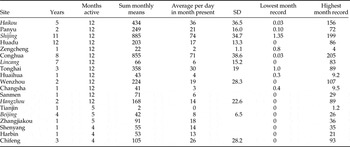
At each of 19 locations that span a wide range of climatic conditions and farming practices in China (table 1; fig. 1), the number of male moths captured in three traps baited with female DBM sex pheromone (supplied by the Chinese National Agricultural Technology Extension and Service Centre of the Ministry of Agriculture) was recorded (fig. 1). The traps were cleared daily or weekly and the data expressed as catch per day as estimates of DBM abundance. The longest data series were for Shijing (11 years) and Huadu (12 years), both in Guangdong Province, but for many sites data were only available for 1–4 years (table 1). These data were used to describe seasonal phenology at each site by expressing monthly totals as a percentage (%) of the total catch for the year. We summarize measures of abundance at each site as the sum of the average catch per day per month (if more than 1 year was available) or, if only 1 year of data were available, as the average catch per day (±SD) and the average catch per day in the lowest and highest months.
Location of population sampling sites plotted on GI, climate suitability for population growth, from a CLIMEX model for Plutella xylostella; see Li et al. (Reference Li, Zalucki, Bao, Chen, Hu, Zhang, Lin, Yin, Wang and Feng2012) for details. At all sites male DBM were sampled using pheromone traps for at least 1 year (see table 1 for details). Climate data for sites marked with a star were used simulation of DBM population dynamics (see text for details).

Location of male DBM pheromone trapping sites (City name, Province, latitude, longitude and altitude (m) and details of data available (year data collection started and years of record)), cropping pattern and brassica production systems in the vicinity of the traps if known (see footnotes). Sites are ordered by latitude from south to north. Climate classification based on Koppen–Geiger system; see fig. 1 and Kriticos et al. (Reference Kriticos, Webber, Leriche, Ota, Bathols, Macadam and Scott2012) for details.

1 Commercial operation.
2 Small farmers.
3 Organic production system.
4 Production break used.
5 City municipality
Modelling climate, cropping patterns, natural enemies and insecticide effects
In the present model, we wish to capture the general trends in variation in DBM abundance within and between years for different regions with different climatic conditions, and the effects of climate on management (the number of insecticide applications necessary to ‘control’ DBM) and the effects of the pattern of cropping both with and without natural enemies (=notional parasitoid). Consequently, the model has four key ‘modules’:
-
1. a notional crop that is planted and harvested and that influences egg laying and the survival of different DBM life history stages;
-
2. a DBM life cycle where the key processes of development, survival and fecundity are influenced by temperature, rainfall, the notional parasitoid and application of insecticide;
-
3. a notional parasitoid life cycle based on the life-history of Diadegma semiclausum Hellén (Hymenoptera: Ichneumonidae); and
-
4. additional management modules, described by insecticide application events that can target immature stages of DBM.
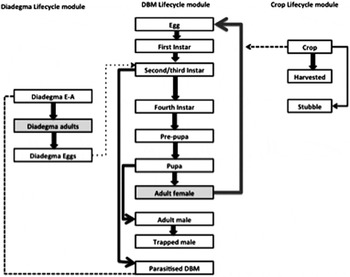
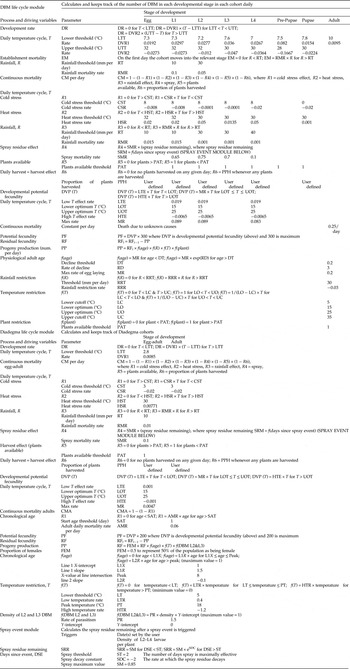
Each of these key modules and their parameterization (based on data from the literature) is described below (see also Fig. A1 and Table A1). In some cases, function parameters were based on expert best guesses; these are duly noted and justified. In nearly all cases, we have kept equations that describe processes as simple linear functions above and below thresholds (Table A1), bounded so as not to produce biologically implausible values (e.g., negative mortalities or proportions greater than 1).
The crop module
The crop lifecycle comprises three life-stages: crop, harvested and stubble. It is a very simple lifecycle with few processes, in which the user defines the planting date and number of plants in a crop. The number of plants is notional as we are modelling population size in the region as a whole and crop presence simply means hosts are available for laying eggs, for larvae to feed on and to calculate a population density in order to time insecticide applications (see below) if they are required. The duration of a crop is based on its physiological age, and crop development is a two-segment linear function of the daily temperature cycle (see Table A1). When temperatures exceed a 0°C minimum threshold the crop develops at a rate of 0.001 day−1 per degree day above 0°C until a maximum temperature threshold of 27°C is reached, whereupon the rate of development declines at a rate of −0.01 day−1 per degree day above 27°C. The parameter values describe a short season crop, with plants taking 30–50 days to mature under Guangzhou conditions (Chen et al., Reference Chen, Lu, Zhuang, Chen, Liu, Zheng, Gao and Li2014). A proportion of individuals (user specified) transfers to the harvested life-stage when the crop has matured (when they reach a physiological age of 1), with the remainder transferring to the stubble life-stage. With the default setting of stubble proportion =0.1, this means that 90% of the crop transfers to the harvested life-stage, and 10% transfers to stubble. At some time later (user specified) the stubble is ‘cleaned up’ or removed. We use this to simulate different crop management strategies, from a production break to strict or lax crop hygiene. Brassica vegetable crops are generally produced year round in many areas, and we simulate such a scenario with continuous sequential plantings or adjust the crop parameters to essentially have a crop available for 365 days. A production break (=no crop available) means eggs cannot be laid and the population will die out if that break is long enough. Leaving a large proportion of the crop unharvested for some time before clean up simply enables DBM to continue developing unabated. We simulate the effects of different extreme crop management scenarios on DBM population dynamics. Harvesting removes a fraction of the immature population from the system. At this point there is no insect–plant interaction in the model in the sense that larvae do not reduce leaf area or interact with each other.
DBM lifecycle module
The DBM lifecycle module contains all of the developmental, mortality and reproductive functions that define the way in which the DBM life-stages interact with their environment. The lifecycle consists of seven stages: an egg stage; first instar (L1), second and third instars combined (L2–L3), fourth instar (L4); pre-pupae, pupae and adults (Fig. A1).
DYMEX is based on the concept of cohorts within a life stage. Cohorts are created in each time step (daily) in which one or more individuals enter a life stage, and the status of each cohort is tracked independently on a discrete time step basis (in our case daily). Processes defined in the model, such as development and mortality, or transfer from one life stage to the next, act at the cohort level, not the life stage level. Cohorts have a number of properties, or state variables; some are pre-defined, whilst others are user-defined. Cohort properties track particular processes or attributes within the relevant life stages (e.g., number, age, stress accumulation, thermal accumulation) and can drive other processes (e.g., development, mortality, reproduction) in the same or subsequent life stages. The concept of cohort properties provides an elegant mechanism to account for the range of responses to the different conditions experienced by members of a population (Yonow et al., Reference Yonow, Zalucki, Sutherst, Dominiak, Maywald, Maelzer and Kriticos2004).
Development rates for the immature DBM stages are taken directly from Liu et al. (Reference Liu, Chen and Zalucki2002) and are modelled as simple two segment linear functions with a lower development threshold and slope to an upper threshold, after which development declines (Table A1). The development rate is driven by the 12 steps per day daily temperature cycle, which is generated in the Circadian Module provided by DYMEX. Using daily maximum and minimum temperatures and day-length (generated from a location's latitude and the day of year), the module generates a daily temperature cycle by applying a 12-segmented sine plus exponential curve between the daily maximum and minimum temperatures. All of the temperature dependent development and mortality functions in the model are calculated using these temperatures interpolated within a day.
For all immature stages, the transfer from one stage to another is a simple step function. When a cohort attains a physiological age of 1, all surviving individuals transfer to the next stage. Mortality functions for rainfall, temperature, harvest and insecticide application, and if relevant, a notional parasitoid, are included for each of the immature stages (Table A1).
In general, immature stages will die at a certain rate (see Table A1) on a daily basis if it is too hot (heat stress accumulates at temperatures above 32°C for eggs, L1–L4) or too cold (cold stress accumulates at temperatures below 8°C), if there is too much rain (when rain exceeds certain threshold, see Table A1), if the crop is harvested, if there are fewer than 0.1 plants available, and/or if the density of L2–L4 is too high, as determined by the user and an insecticide application event is triggered. Mortality due to insecticide residues will only occur if this module is initialized and an insecticide application event is triggered.
Larvae are particularly susceptible to the effects of rainfall immediately after hatching and before they establish a mine and when they emerge from mines around the second instar (e.g., Wakisaka et al., Reference Wakisaka, Tsukuda, Nakasuji and Talekar1991; MPZ & MJF, unpublished data). Consequently, we have included an ‘establishment mortality’ process driven by rainfall that affects L1 and L2–L3 on their first day of existence. Older larvae are subject to some rainfall effects but at a higher threshold level of rainfall with a lower level of effect (Harcourt, Reference Harcourt1963) (Table A1).
Harvest mortality operates on all immature stages by removing the same proportion of immatures from the population as the proportion of the crop harvested. Crop residues that harbour immature stages can remain after harvesting. The proportion of immatures removed by harvesting can be adjusted within the model, but here we use 90% of immature insects in all scenarios.
The sex ratio at adult emergence is assumed to be 1:1. The adult males can be trapped to represent population sampling similar to the use of pheromone traps to monitor populations. A constant arbitrary proportion of males (0.25) is trapped and removed from the population daily.
Potential egg production of females is calculated as a function of temperatures experienced by a cohort during immature development, and both accumulated heat and cold stresses reduce potential fecundity (see verification below) from a notional maximum of 300 eggs per female. Fecundity records for DBM based on laboratory studies range from 100 to 400 eggs per female depending on a range of factors (Muhamad et al., Reference Muhamad, Tsukuda, Oki, Fujisaki and Nakasuji1994; Golizadeh et al., Reference Golizadeh, Kamali, Fathipour and Abbasipour2009; Zhang et al., Reference Zhang, Shu, Wu, Dicke and Liu2009; Marchioro & Foerster, Reference Marchioro and Foerster2012; Soufbaf et al., Reference Soufbaf, Fathipour, Zalucki and Karimzadeh2013). Our value is at the upper end of this range and implies that adults have access to food (Sarfraz et al., Reference Sarfraz, Dosdall and Keddie2009). Potential egg production is a user-defined cohort variable that was fitted to the results of laboratory studies in which DBM were reared under various temperatures and fecundity was recorded (see below).
After a specified pre-oviposition period (0.2 of adult physiological age completed to allow for mating), the realized egg production rate is at a maximum and then declines with the physiological age of the adult. Both temperature and rainfall affect egg laying on any particular day (Table A1). Mortality for the adult stage is specified as a constant proportion per day, 0.25 of the population due to unknown causes (Annamalai et al., Reference Annamalai, Ito and Saito1988), resulting in approximately 5% survival after 10 days. All individuals in a cohort are removed when adults reach physiological age of 1.
Biological control
To simulate biological control, we include a notional larval parasitoid that parasitizes L2–L3 stage DBM larvae and is loosely modelled on D. semiclausum. The Diadegma life cycle module consists of three stages: Diadegma E-A, Diadegma Adults and Diadegma Eggs Available (Fig. A1). The Diadegma E-A, represents the development and mortality processes of Diadegma from eggs to when they emerge as adults (essentially the parasitized DBM larvae). This life-stage is subject to all factors that affect DBM larval mortality. Thus, immature Diadegma will die on a daily basis if it is too hot or too cold for DBM, if there is too much rain, if the crop is harvested, if there are fewer than 0.1 plants available, and/or if the density of L2–L3 DBM is too high, triggering insecticide application. Parasitoid development is a linear function above a threshold (2.8°C) with a slope of 0.0085 day−1. Diadegma E-A cohorts transfer to the Diadegma adult life-stage when they reach a physiological age of 1. As with DBM, parasitoid fecundity is determined by rearing temperatures, exactly the same as for DBM (above) but with a maximum potential fecundity of 200. Diadegma adult mortality is a linear above threshold function of chronological age: threshold = 1; slope = 0.06 day−1 (giving rise to a type 3 survivorship curve), and the sex ratio is 1:1. Progeny production (=eggs available to parasitize larvae or the Diadegma Eggs Available stage (see Fig. A1) is a function of temperature, increasing from 5 to 18°C and declining at temperatures above 18°C; chronological age, peaking at about 4–5 days of age; and the number of L2–L3 larvae available to parasitize. The rule used to calculate progeny production (number of eggs laid on any 1 day) is defined as the minimum value of the first four factors or L2–L3 larvae available. In other words, the number of eggs laid will be restricted either by how many eggs can be laid or by the number of small DBM larvae (L2–L3 DBM instars) available to be parasitized. Parasitism increases with L2–L3 density. Parameters for the parasitoid were taken from Dosdall et al. (Reference Dosdall, Zalucki, Tansey and Furlong2012), Wang et al. (Reference Wang, Duff, Keller, Zalucki, Lui and Bailey2004), and Soufbaf et al. (Reference Soufbaf, Fathipour, Karimzadeh and Zalucki2014).
Insecticide application
The insecticide management option can be based on a threshold density of L2–L3 plus L4 larvae per plant, L1 larvae per plant, or on a time-scheduled basis. The remaining residue that kills larvae is based on three parameters that determine the number of days the insecticide effect lasts once an event is triggered: the number of days that the insecticide is maximally effective, an exponential decay rate, and a scaling factor that determines the maximum effect. As with all parameters, the user can choose different values that notionally represent how well insecticides are applied (coverage, formulation, application, etc.) and hence the likely effect of the treatment. The effectiveness of the application can also be adjusted for each life stage, to represent the susceptibility of different instars, and to represent insecticide resistance (Table A1).
Initialization
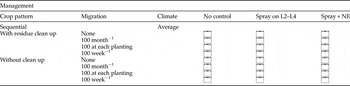
Initialization of the model defines the scenario being simulated. Again, there is a great flexibility available. One can initialize with adults immigrating into a field once at the start and/or at different times, and/or with different numbers of DBM in all stages of development. The former represents a scenario wherein a field is planted and moths arrive from elsewhere, while the latter might represent a region with an established population age structure present. Modules such as Insecticide application and Biological control can either be used or excluded. Comparisons of simulations with and without the particular module give an indication of how effective the contribution of that process is to manage DBM populations. For simulations, we run individual years for each location starting with a mixed age structure; eggs (465), L1 (400), L2 and L3 larvae (350), L4 (310), pupae (300) and adults (150 of each sex); that represents a low infestation level for 1000 plants generally starting on 1 January in each year. The relative abundance of the various stages is based on (Ke & Fang, Reference Ke and Fang1979) and approximates the mixed age structure at the beginning of the year in a region where DBM persists. For Beijing, the population is initialized with migrant adults only on 1 April. Crops are available continuously throughout the year (table 2a) in a comparison of expected dynamics at sites that are representative of different climatic regions. For simulations with sequential cropping cycles we initiate with 100 adult females and males at the start and investigate various migration scenarios (table 2b) using the average climate experienced in Guangzhou for the period 2000–2012.
Scenarios simulated to illustrate the effect of climate, cropping pattern, addition of natural enemy (NE) and spraying regime on the population dynamics of Plutella xylostella for Haikou, Guangdong, Lincang, Hangzhou and Beijing. Initial condition at start of the simulation was a mixed age structure of Eggs (465), L1 (400), L2-L3 (350), L4 (310), Pupae (300) and adults (150 of each sex).

Scenarios simulated to illustrate the effect of crop hygiene and timing of migration on the management and population dynamics of Plutella xylostella for Guangdong. Initial condition at start of each simulation was 100 adult females.

Climate input and model running
All climate data entered into the model are from standard meteorological sources and uses daily minimum and maximum temperatures (°C) and rainfall (mm) sourced from China Meteorological Data Sharing Service System. We use climate data for five locations to represent the range of conditions experienced by DBM from the south to the north: Haikou (E110.35, N20.02), Guangzhou (E113.23, N23.16), Lincang (E100.09, N23.88), Hangzhou (E120.19, N30.26) and Beijing (E116.46, N39.92). We take Guangzhou as being representative of three nearby trapping locations: Panyu, Shijing and Huadu (table 1, fig. 1). Lincang is inland and more elevated and is used for Tonghai (a nearby trapping location). It is unlikely that the daily temperature cycle calculated within the model reflects accurately the temperatures experienced by DBM in the field. True maximum temperatures are likely to be much higher, while minimum temperatures may be lower; although this will depend on the stage being modelled and the age of crops (Mohandass & Zalucki, Reference Mohandass, Zalucki, Endersby and Ridlands2004).
DYMEX offers enormous flexibility in scenarios that can be simulated, and we specifically investigate scenarios with and without the parasitoid, and with and without insecticide sprays (table 2). We use daily climate data from 2000 to 2012 for five sites to represent the range of conditions for which we have reasonable population data (table 1). For these simulations we use the extreme of year round cropping, except for Beijing where it is not possible to grow brassicas outside a glasshouse in the winter. For one location, Guangzhou, we investigate the effect of crop planting regime and hygiene (table 2).
Verification and assessment of model
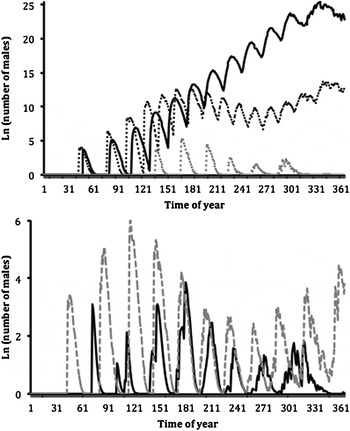
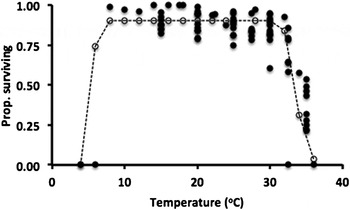
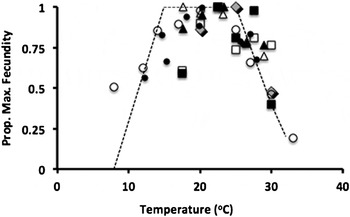
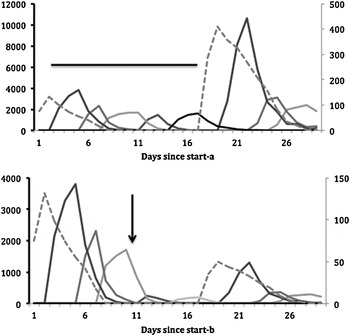
To verify our model, we generated age structure and development times for cohorts for the five locations over an average year (fig. 2). The number of generations based on peaks in catches of males accords well with observations at these locations (Ke & Fang, Reference Ke and Fang1979). We also ran the model at a range of constant temperatures (from 8 to 35°C) to reproduce laboratory data on survival (fig. 3) and potential fecundity effects (fig. 4). The model simulates these processes reasonably well. We do not believe that fitting more refined non-linear functions is warranted at this stage, as the level of precision in observed data (for both field and laboratory) is low. We show a short piece of output for the development of an age-structured population over time (fig. 5a). Insecticide application, not surprisingly decreases abundance and the numbers in targeted and subsequent stages (fig. 5b). For our simulation and analysis of DBM population dynamics under various scenarios we present output and summaries based on trapped adult males, as this is the monitoring data we have available.
Development of DBM generations shown as the Ln (number of males) across seasons under average climate conditions starting with adults colonizing a field on day 1(1 January) for Guangzhou (dark dotted line) and Lincang (solid line), but day 93 (1 April) for Beijing (stippled grey line) (top panel) and day 1 for Haikou (grey dashed line) and Hangzhou (solid line) (bottom panel). The generations per year are evident for Haikou (11 generations) Guangzhou (15 generations), Lincang (12generations), Hangzhou (8–9 generations) and Beijing (6 generations). The time from peak to peak accords well with observed generation times for each time of year (see text for details).

Proportion DBM immatures surviving from egg to adult at a range of constant temperatures. The solid circles are observed data points taken from various laboratory studies (Yadhav et al., Reference Yadhav, Sachan and Yadhav1983; Yamada & Kawasaki, Reference Yamada and Kawasaki1983; Sarnthoy et al., Reference Sarnthoy, Keinmeesuke, Sinchaisri and Nakasuji1989; Kandoria et al., Reference Kandoria, Lal and Singh1994; Dan et al., Reference Dan, Liang and Pang1995; Liu et al., Reference Liu, Chen and Zalucki2002; Golizadeh et al., Reference Golizadeh, Kamali, Fathipour and Abbasipour2009). The open circles and dashed line show the survival generated by our DBM DYMEX model for those temperatures (±0.5°C) and parameter values in Table A1.

Proportion of maximum fecundity recorded with each of a number of studies where the females were reared at the indicated temperatures: open and closed squares (Yamada & Kawasaki, Reference Yamada and Kawasaki1983), open and closed triangles (Sarnthoy et al., Reference Sarnthoy, Keinmeesuke, Sinchaisri and Nakasuji1989), diamonds (Chung et al., Reference Chung, Park, Cho and Shin1989), closed circle (Park et al., Reference Park, Koh, Lim, Hyon and Song1993) and open circle (Dan et al., Reference Dan, Liang and Pang1995). The dashed line shows the values generated by our DBM DYMEX model for this process at the same range of temperatures and parameter values in Table A1.

Example of population age structure generated by our DBM DYMEX model. The dashed line is the number of adult females (secondary scale), the others in order are numbers of eggs, L1 larvae, L2–L3 larvae, L4 larvae, pupae. Pre-pupae have been omitted for clarity. The climate is taken from Haikou and the expected number of days from egg to adult is indicated as a bar (a). The bottom panel (b) is for the same population but with a spray applied on day 11 indicated by the arrow based on the density of L2–L4 larvae (note the scale change).

Results
DBM population dynamics: the trapping data
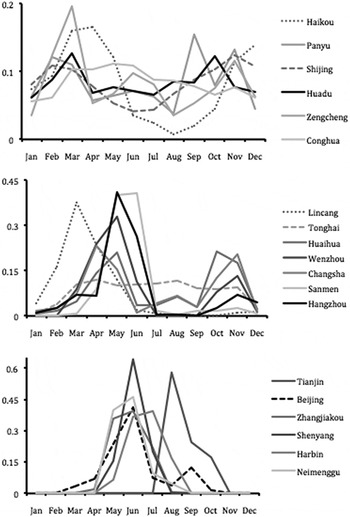
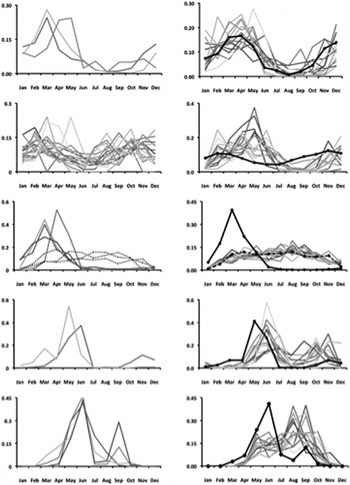
The effect of climate is apparent in the average phenology of DBM across trapping sites as one goes from the south to the north of China (fig. 6). In the tropical south DBM populations are present year round, doing best in the ‘cooler’ months and generally declining in the summer (fig. 6a). In more temperate areas numbers tend to peak in the spring and autumn (fig. 6b). The apparent exception is Lincang (fig. 6b) but the observed pattern reflects the strong effects of a production break from spring to autumn (below). Tonghai, which is climatically similar to Lincang, shows high abundance through the summer (fig. 6b). In the colder north DBM is only active from late spring to autumn; winters being too cold for both the moth and its host plant (fig. 6c). The abundance of moths generally reflects climate effects (table 3a) with a south-to-north gradient in abundance. Southern locations average 441 moths per month over a year, central and temperate locations average 139 and northern sites 58 moths per month. However northern sites have similar trap numbers 13 moths per night to central sites 12 moths per night while southern sites average 37 moths per night. The variability amongst trapping locations (table 3a) reflects in part local management practices and possibly migration effects. The variability over time is a mixture of these effects and climate (below).

Summary of observed population abundance data for DBM for 19 sites across China showing number of years data available (see table 1 for further details), months of DBM ‘activity’, sum of the mean monthly average catch per day for a year, average moths per day during months when present, SD of this measure, average lowest and highest catch per day recorded in any one month. Italicized sites are used to simulate dynamics based on daily climate data.

DBM model simulations
The effect of climate, spraying and natural enemies
As might be expected, simulations of year round host plant production with no control lead to exponential population growth in most years in southern locations, and large DBM populations (fig. 2, table 3b). In general the largest populations occur in Lincang, followed by Haikou and Guangzhou (table 3b). Numbers are lower in Hangzhou and Beijing as climate becomes less suitable further north. These same trends are evident when spraying is added to the scenario based on a density threshold of ten L2–L4 larvae per plant. This is a situation analogous to most management practices in China (Zhao & You, Reference Zhao and You2001). These simulations capture both the mean level of abundance at each location (tables 3a, b), as well as the general phenology of the species and its variation (fig. 7). If we take the abundance observed at Panyu, Shijing and Huadu (37 moths day−1 on average, table 3a) as indicative of Guangzhou, this compares very favourably with 34 moths day−1 simulated (table 3b). The values are 34 day−1 observed at Haikou versus 37 day−1 simulated. Beijing (8 versus 5) and Hangzhou (14 versus 18) are similar (table 3b). The exception is Lincang where the observed is 7 moths day−1 and the simulated is 28 day−1. The caveat here is that because of DBM pest pressure, Brassica crops are no longer produced in the summer months and observed adult abundance reflects this lack of hosts (fig. 7). The simulated abundance agrees very well with that recorded at nearby Tonghai, where there is no production break (28 day−1 simulated versus 30 day−1 observed). The number of insecticide applications (table 3b), reflects DBM pest pressure and the climatic suitability of the location. Lincang/Tonghai is the stand out with 28 applications, followed by Haikou (12), Guangzhou (10), Hangzhou (5) and Beijing (4) (table 3). These application numbers simply illustrate the relative suitability of a location for DBM. The variability in phenology over the year (fig. 7) illustrates the variable effect of climate.
Observed seasonal phenology (left hand panels) based on pheromone trap data for Haikou, Guangzhou (Shijing and Huadu data shown), Lincang (including Tonghai), Hangzhou and Beijing (see table 1 for details of data sets). Corresponding simulated phenology for these same locations using climate data from 2000 to 2012 are in the corresponding right hand panels. The solid lines with symbols indicate the average observed phenology.

Simulated population abundance for five locations using climate data from 2000 to 2012. Average per day is from the observed trapping data (table 3a), simulations are for year round crop production with no control (as natural log of mean simulated abundance), average per day with sprays, number of sprays shown and % reduction in sprays if biological control is added (see table 2).

1 Guangzhou average per day is an average of Panyu, Shijing and Huadu sites from table 3a.
2 Lincang has a production break; Tonghai has a similar climate but no production break.
The simulated variation in phenology amongst years agrees very favourably with the observed patterns in general terms (fig. 7). The average phenology agrees remarkably well for Haikou (fig. 7a), Lincang (using Tonghai data, fig. 7c) and Hangzhou (fig. 7d). Guangzhou is close (fig. 7b), and discrepancies may reflect management practices (cropping patterns and insecticides use, see below). Beijing (fig. 7e) appears to have higher population earlier than local field breeding would allow, suggesting that these moths are coming from elsewhere.
Adding a parasitoid, such as D. semiclausum, at the start of each simulation, even though the species cannot persist at southern coastal (too hot) and northern sites (too cold), illustrates the effect of natural enemy mortality on DBM population dynamics. The reduction in spray use can be potentially very large (table 3b). Lincang is climatically suitable for D. semiclausum and the species can persist (Li et al., Reference Li, Yin, Zhao and Chen2013). Again the savings in insecticide use can be large (table 3) ranging from 80 to 41%, although this will depend on cropping patterns and DBM migration (below).
The effect of cropping pattern, migration and resistance
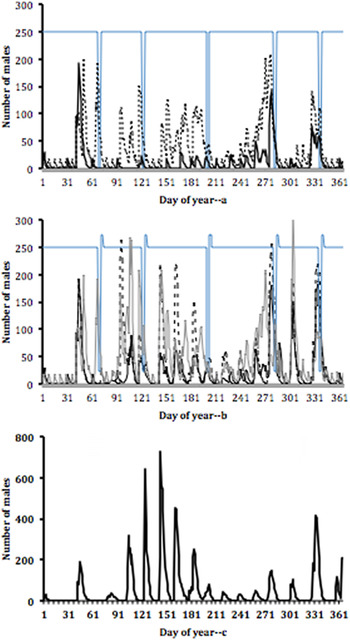
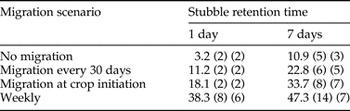
The effect of harvest and when the next crop is planted on pest pressure depends on how long stubble (crop residue) is retained and the timing of additional migration input (table 4, fig. 8). Cleaning up stubble immediately following crop harvest effectively removes an infesting population, and DBM does not persist in the field except with migration input (fig. 8a). With no migration the population goes extinct in early summer (data not shown). In fact with strict crop hygiene the only insecticide applications required for most migration scenarios were to manage the population in the initial crop, except when migration was weekly (table 4) as this level of pest pressure required more management. Leaving stubble for a week greatly increased pest pressure (table 4) both in terms of mean abundance and the need to manage with insecticide. Adding natural enemies reduced insecticide requirements (table 4) as expected. The timing of migration input is critical. The pest problem is bigger if moths colonize each new crop at its planting compared with regular monthly input (fig. 8b). This is because harvest and clean-up effectively removes the population in the crop, whereas colonization at planting allows DBM to sometimes complete more than one generation and the population to build up. Not surprisingly, weekly migration input leads to bigger problems (table 4, fig. 8b).
Population dynamics of DBM as measured by the number of males based on climate for an average recent year in Guangzhou (average temperatures and rainfall for 2000–2012). In all cases the simulation started with 100 gravid females on day 1. Various migration scenarios (see table 2) are shown with spraying L2–L4 larvae: (a) has complete harvest and clean up within a day and a new crop planted 3 days later with 100 DBM females moving into the crop every 30 days (solid line) and weekly (stippled line); (b) has 90% harvest and the stubble or crop residue is not cleaned up till 1 week later. The new crop is planted after 3 days. Three DBM migration scenarios are shown: solid line is for 100 females every 30 days and the dashed line for 100 females at planting of each crop, grey line is for weekly migration, and (c) crop as in (b) with weekly migration but the spray is no longer as effective reflecting possible resistance (stippled bars indicate spray applications).

Pest status of DBM expressed as the average number of males per day over the year and number of sprays required based on an L2–L4 density of 10 per plant for an average climate year in Guangzhou for two cropping regimes; rapid clean-up of residues (1 day retention) and stubble remaining for 7 days for each of four migration scenarios: no migration except on day 1, migration input of 100 females every 30 days, migration on at the initiation of each crop and weekly (see fig. 8 for population traces and crop phenology). First value in brackets is the number of sprays required over the year, the second is with biological control added.

We simulated the effect of ineffective insecticide applications either due to poor coverage, poor application or insecticide resistance by simply reducing the level of mortality in any single spray event. Not surprisingly under the worst case scenario of sequential cropping combined with poor hygiene and weekly DBM migrations, the number of insecticide applications increased to 24. The highest population generated (51 moths per night) was under a sequential cropping scenario with poor crop hygiene for Guangzhou (fig. 8c). Insecticide application following typical farmer practice of an application once per week (Feng et al., Reference Feng, Chen, Lü, Mo, Lu, Xie and Zhang2001) from February, assuming an ineffective spray increased the average population to 281 day−1 and required 48 insecticide applications! This result highlights the need for well-timed, effective insecticide applications.
Discussion
Using DYMEX to model population dynamics allows us to investigate age-structured population dynamics as influenced by climate for a wide range of scenarios at any location. Insects have discrete generations with known effects of temperature on development times, survival and reproduction (e.g., Liu et al., Reference Liu, Chen and Zalucki2002). Different stages can have very different susceptibilities to extreme climate variables of temperature and rainfall (e.g., Yonow et al., Reference Yonow, Zalucki, Sutherst, Dominiak, Maywald, Maelzer and Kriticos2004), and host plant effects (e.g., Soufbaf et al., Reference Soufbaf, Fathipour, Karimzadeh and Zalucki2010a , Reference Soufbaf, Fathipour, Karimzadeh and Zalucki b ). These life stages may or may not be present in the population when the events occur. Similarly, timing of management events is critical to their subsequent population effects.
DBM shows wide variation in abundance and timing of population peaks across the full latitudinal gradient in China (fig. 2). From the tropical south to the extreme cold of the north, the patterns of variation suggest broad climatic effects: summer in the south and central coastal areas are generally too hot, resulting in slowed development (fig. 2) and declining populations (fig. 7). Elevated inland areas (e.g., Tonghai) have high populations in the summer, as temperatures are favourable for high fecundity and development. Further north, winters are too cold and populations can only persist in the warm months, but populations that migrate seasonally to Beijing type climates can do very well in summer months. These observations are consistent with our earlier analysis of climate effects using CLIMEX (Li et al., Reference Li, Zalucki, Bao, Chen, Hu, Zhang, Lin, Yin, Wang and Feng2012). Even without a threshold-based spray regime (fig. 2), which is analogous to a density limitation (e.g., fig. 7), the simulations capture population trends. In fact, in some areas the average climate alone can limit populations: e.g., Beijing is too cold for persistence, in Hangzhou potential fecundity effects of high and low temperatures restrict populations and in Haikou high temperatures affect development and fecundity and hence population size.
Our DYMEX model captures both these temporal and spatial patterns (fig. 7), with some anomalies suggesting that management practices, particularly production breaks, have important influences on population abundance. Thus, the climate in Lincang is very favourable for DBM: both the simulated and observed populations are high, and peak in summer unless a production break is enforced (comparing Lincang with Tonghai). Historically, pesticide use in Yunnan province has been high, and reflects the pest pressure (Feng et al., Reference Feng, Li, Wu, Chen, Wu, Hou, He, Li, Xie, Zhang, Fu, Ma, Srinivasan, Shelton and Collins2011). Similarly in Haikou and Guangzhou, where pest pressure is high (fig. 2, tables 1 and 3), insecticide use has historically been high, but not as high as in Yunnan. However our simulation suggested that adding biological control can reduce the need for insecticide by more than half. D. semiclausum can persist in Lincang (Li et al., Reference Li, Yin, Zhao and Chen2013), and does so in our simulations. It does not persist in other locations because of hot summers, but as expected (e.g., Liu et al., Reference Liu, Shi, Zalucki and Liu2014) the introduction of natural enemies can benefit management (table 3 and 4).
Although there is a climate signal in both the observed and simulated population data, there are also indications of strong management and migration effects. The production break in Lincang changes DBM dynamics; the lack of a host crop means that no moths can develop; a similar finding to elsewhere when production breaks have been practiced (Deuter, Reference Deuter1989). Comparing the simulated with observed dynamics for Beijing points to migration input as an important factor for pest dynamics early in the cropping season.
Our simulations highlight the importance of crop hygiene. They capture the dynamics for the organic production farm at Zengcheng that exports to the Hong Kong market versus farms that produce for local consumption. With strict hygiene, as occurs on the organic farm, DBM only becomes problematical with high migration input (weekly), and even then it is manageable with appropriately timed sprays. Whereas, leaving crop residues, as occurs on farms in Huadu and Shijing, effectively doubles to quadruples the management spray requirements, depending on the migration pressure (table 4). Timely applications of insecticide based on appropriate thresholds and with good spray application (see e.g., Guo et al., Reference Guo, Geitz, Franklin, Liu, Furlong, Zalucki and Cooper2004) are essential to good management. Spraying once a week with an ineffective spray leads to the highest population pressure.
Management of DBM has largely been based on the heavy use of insecticides with consequent development of resistance problems. In Guangdong, resistance levels are so high to some insecticides (Bt, abamectin, Chlorfenapyr, Fipronil, Spinosad, Emamectin benzoate, Indoxacarb and recently chlorantraniliprole) that field failures have been reported from Zengcheng, Foshan, Panyu and Huizhou (Hu et al., Reference Hu, Chen, Li, Zhang, Yin, Lin, Bao, Zhou and Feng2011; Wang & Wu, Reference Wang and Wu2012). Management of DBM has remained possible only because farmers have simply switched to a new insecticide over the years or reverted back to mixtures of old ones.
The necessary responses are fairly obvious: better cultural control or crop hygiene (as in the organic farm at Zengcheng), sampling of populations and spraying only if required, targeting the right stage (small larvae not large), using appropriate spray equipment (Guo et al., Reference Guo, Geitz, Franklin, Liu, Furlong, Zalucki and Cooper2004) and preferably using insecticides that are biocontrol friendly (Furlong et al., Reference Furlong, Kim, Pak, Jo, Ri and Zalucki2008). Above all, it is important to rotate chemicals (e.g., Heckel, Reference Heckel, Endersby and Ridlands2004) as part of an Insecticide Resistance Management (IRM) strategy. This is the standard Integrated Pest Management (IPM) mantra of the sample, spray and pray (SSP) kind (Zalucki et al., Reference Zalucki, Adamson and Furlong2009) and it generally works (e.g., Furlong et al., Reference Furlong, Shi, Liu, Guo, Lu, Liu and Zalucki2004a , Reference Furlong, Shi, Liu and Zalucki b ; Liu et al., Reference Liu, Shi, Guo, Chen, Zhang, Lu, Wang, Deuter, Zalucki, Endersby and Ridlands2004, Reference Liu, Shi, Zalucki and Liu2014). The problem, as always, is implementation and adoption (Heisswolf et al., Reference Heisswolf, Holding, Deuter, Sivapragasam, Loke, Hussan and Lim1997; Furlong et al., Reference Furlong, Wright and Dosdall2013).
One area of research that may assist in IPM adoption is the provision of timely forecasts (e.g., Maelzer & Zalucki, Reference Maelzer and Zalucki1999, Reference Maelzer and Zalucki2000; Ridland & Endersby, Reference Ridland, Endersby, Shelton, Collins, Zhang and Wu2008) so as to better time sampling and sprays if needed. We have gone part way to doing this in the analysis presented here by developing an age structured, process-based population model. The DYMEX model appears to capture both the phenology and the population abundance of DBM reasonably well across a broad range of climates in China. It lends itself to being employed in an operational setting to provide localized pest forecasts for DBM in a similar manner to that used by the Australian Plague Locust Commission (http://www.agriculture.gov.au/pests-diseases-weeds/locusts). A key ingredient here is the use of periodic bio-fixes for each region, providing the model with timely re-initialization.
Migration of DBM into specific crops and regions will be problematic for managers to identify and to reac quickly, as occurs in many insects (Chapman et al., Reference Chapman, Reynolds, Smith, Riley, Pedgley and Woiwood2002). Monitoring is the key and being able to identify moths originating in situ, those from nearby crops and those from further afield will be a challenge to researchers.
We believe at this stage that our model is too simple. Despite many years of previous research on DBM, reflected in part by the seven workshops held and the 1300 odd publications since the 1970s (e.g., You & Wei, Reference You and Wei2007), we found it difficult to find experimental studies and good data that quantified rainfall effects and estimates of realized fecundity under field conditions. Our intention is to better reproduce the actual observed dynamics for any one site over a number of years. We have shown here that initialization of the model is important. To better capture crop dynamics and migration of both DBM and natural enemies we will incorporate ‘demes’- essentially sub-populations that interact. We will need to refine our parasitoid attack functions and the effect of rainfall on the DBM dynamics. We leave that to a subsequent paper.
Acknowledgements
The authors would like to thank Aidong Chen, Qingjun Wu, Jinming Zhang and Shenghua Xie for the data of population dynamics in the field. The project was funded by the Special Fund for Agro-scientific Research in the Public Interest (201103021), Science and Technology Planning Project of Guangdong Province (2013B050800019 and 2014B070706017) and President Foundation of Guangdong Academy of Agricultural Sciences (201514).
Appendix
Stylized and simplified representation of the main life cycle modules in the DBM Dymex model: crop, DBM and Diadegma. The crop life cycle affects many of the DBM life cycle stages (egg laying and all immature stages due to harvest) so these are enclosed in a box with a dashed arrow from crop to indicate the interactions. Diadegma parasitizes the L2–L3 instars of DBM and this is indicated by the dashed arrow from Diadegma eggs to L2–L3. Diadegma eggs are a holding stage of potential eggs to be laid. These eggs are distributed and generate parasitized DBM larvae. The development of immature stages of the parasitoids is captured in Diadegma E-A. Thick arrows represent major transitions from one stage of a life cycle to the next. Adult DBM reproduction is indicated by the thick grey line. All the processes determining stage transitions, mortality, reproduction and interactions are detailed in Table A1.

Details of the structure of key modules in the DBM Dymex model: The DBM life cycle module, Diadegma life cycle module and spray event module. Process and driving variables and parameter values shown for each stage represented in the model including the equations used to calculate values.