Introduction
Nilagiri sheep, native to the Nilagiri hills of Tamil Nadu (Acharya, Reference Acharya1982) is known for its adaptability to high altitude, low input system of rearing and dual utility (fine wool and meat). Sandyno sheep (Iyue, Reference Iyue1993; Bhatia and Arora, Reference Bhatia and Arora2005) is a synthetic breed developed from Nilagiri sheep. The demand for wool in the region is less and the selling price doesn't even match the cost of shearing. Hence, these animals are primarily maintained for meat and therefore, the growth traits are economically important in both these sheep breeds.
Intensive use of small numbers of sires and dams, due to selection and closed nature of flocks can lead to an increase in inbreeding and reduction in genetic variability within livestock populations. Decreased performance in traits related to production, reproduction and health due to inbreeding have been reported in sheep by many authors (Lamberson and Thomas, Reference Lamberson and Thomas1984; Ercanbrack and Knight, Reference Ercanbrack and Knight1991; Boujenane and Chami, Reference Boujenane and Chami1997; Mandal et al., Reference Mandal, Pant, Rout, Singh and Roy2002; Casellas et al., Reference Casellas, Piedrafita, Caja and Varona2009; Pedrosa et al., Reference Pedrosa, Santana, Oliveira, Eler and Ferraz2010; Zadeh, Reference Zadeh2012). This decrease is called inbreeding depression, which is more pronounced in traits related to fitness (Falconer and Mackay, Reference Falconer and Mackay1996). Review of earlier studies on inbreeding in sheep indicates presence and absence of such a depressive effect for growth traits (Lamberson and Thomas, Reference Lamberson and Thomas1984). A meta-analysis by Leroy (Reference Leroy2014) provides general result on inbreeding impact on growth traits. Both, Nilagiri and Sandyno sheep have been maintained as closed flocks under purebreeding for over 25 years and hence, depression due to inbreeding in these flocks is very much a possibility.
Most of the previous studies on the effect of inbreeding were on the influence of the traditional inbreeding coefficient (F; Wright, Reference Wright1931) on different growth traits (Lamberson and Thomas, Reference Lamberson and Thomas1984; Leroy, Reference Leroy2014). However, F is not linear over generations and can lead to varying conclusions depending on the pedigree depth (Falconer and Mackay, Reference Falconer and Mackay1996; Gonzalez-Recio, de Maturana and Gutierrez, Reference Gonzalez-Recio, de Maturana and Gutierrez2007). Pedigree or genealogical information could influence the inference drawn on the same level of inbreeding. An alternative measure called individual increase in inbreeding (ΔF i ) (Gonzalez-Recio, de Maturana and Gutierrez, Reference Gonzalez-Recio, de Maturana and Gutierrez2007; Gutiérrez et al., Reference Gutiérrez, Cervantes, Molina, Valera and Goyache2008) adjusts for the variation in depth of pedigree. This approach not only directly accounts for differences in pedigree knowledge and completeness at the individual level, but also indirectly for the effects of mating policy, drift, overlap of generations, selection, migration and different contributions from a different number of ancestors as a consequence of their reflection in the pedigree of each individual, in the analysed population (Gutiérrez et al., Reference Gutiérrez, Cervantes, Molina, Valera and Goyache2008).
The objective of the present study was to evaluate the effect of inbreeding on growth in the Nilagiri and Sandyno populations. The traditional F and the equivalent inbreeding (EF), calculated from ΔF i , had their effects estimated on different growth traits in these two populations.
Materials and methods
Data and flock
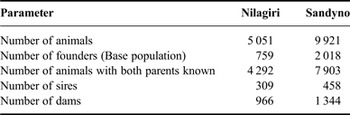
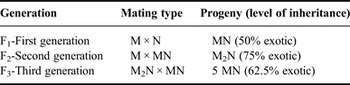
Pedigree information available from 1965 to 2012 on Nilagiri and Sandyno sheep (Table 1) maintained at the Sheep Breeding Research Station, Sandynallah were utilized for the study. In 1986–87, a few Nilagiri animals were introduced from farmers' flock. Since then, the flock has been maintained as a closed herd for more than 25 years. The breed composition and formation of the Sandyno breed of sheep is presented in Table 2. They were developed by crossbreeding the local Nilagiri breed with Stavropol Merino and Rambouillet sheep. The crossbreds with 75 and 62.5 percent exotic inheritance were merged into a single group of Nilagiri synthetic, called Sandyno. The pedigree information of Sandyno animals were recorded up to the founding purebred parents. Growth data available from 1992 to 2012 was used for the analysis of effect of inbreeding on different growth traits.
Pedigree information for Nilagiri and Sandyno sheep populations.

Formation of the Sandyno sheep.

Merging of genetic groups with 62.5 and 75 percent exotic inheritance to form Sandyno breed.
M, Exotic Stavropol Merino/Rambouillet; N, Nilagiri.
The system of management was semi–intensive with concentrate at the rate of 150 g/animal/day fed in addition to grazing. Based on the climatic conditions, lambing was planned for two seasons in a year. The main lambing season was from February to March and remaining animals lambed during the period from September to October. Individual selection based on 6 months body weight was practiced.
Inbreeding
The inbreeding coefficient (F), defined as the proportion of loci carrying alleles that are identical by descent from a common ancestor was calculated (Wright, Reference Wright1931). Coefficients of individual increase in inbreeding were calculated as per Gutierrez, Cervantes and Goyache (Reference Gutierrez, Cervantes and Goyache2009). For each animal (i), the individual increase in inbreeding (ΔF i ) was computed as follows:
 $$\Delta {F_i} = 1 - \root {_{{\rm Eq}{{\rm G}_i} - 1} } \of {1 - {F_i}}$$
where, “EqG i ” is the equivalent complete generation for individual “i” calculated as
 $${\rm Eq}{{\rm G}_i} = {\displaystyle{1 \over 2}^n}$$
where “n” is the number of generations separating the individual from each known ancestor (1 = parents, 2 = grandparents, and so on), and the sum being computed across all known ancestors of “i” (Maignel, Boichard and Verrier, Reference Maignel, Boichard and Verrier1996). Equivalent inbreeding coefficients (EF) were obtained as a product of ΔF i and average equivalent number of generations for the pedigree (Panetto et al., Reference Panetto, Gutiérrez, Ferraz, Cunha and Golden2010).
Individual inbreeding coefficients, number of equivalent complete generations, percentages of known ancestors by generation and individual increase in inbreeding coefficients were computed using ENDOG version 4.8 (Gutierrez and Goyache, Reference Gutierrez and Goyache2005).
Analysis
Growth traits analysed in this study were weight at birth (BW), 3 (WW), 6 (6W), 9 (9W), 12 (YW) and 18 (18W) months of age and pre and post-weaning average daily gain (ADG). Weaning was practiced at 90 days of age and post-weaning period was up to 1 year of age. Separate analyses were done for F and EF in both the breeds by fitting a general linear model including different fixed effects. The various fixed effects included were contemporary groups (CG) of lambs born during a particular year and season, the age of dam at lambing with six levels (<2 years, 3 years, 4 years, 5 years, 6 years and >6 years), litter size at birth (single, twins and triplets), sex of lamb and inbreeding. The effect of inbreeding (individual and ewe) was first included as a fixed covariate of inbreeding coefficients (F and EF). Then, both these inbreeding parameters for individual alone were included as a fixed class with five levels (0, up to 3.125, >3.125 up to 6.25, >6.25 up to 12.5 and >12.5 percent) to understand the influence of level of inbreeding on growth. All analyses were carried using SAS.
Results and discussion
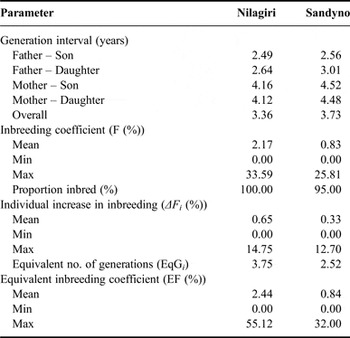
Table 3 presents the results of pedigree analysis in Nilagiri and Sandyno populations. Previous studies have demonstrated that the completeness of pedigree information has an effect on the estimates for F within a breed (Lutaaya et al., Reference Lutaaya, Misztal, Bertrand and Mabry1999; Cassell, Adamec, and Pearson, Reference Cassell, Adamec and Pearson2003). The value of EqG i and percent ancestral knowledge gives an indication of pedigree depth in a population. In the present study, EqG i for the Nilagiri and Sandyno sheep were 3.75 and 2.52, respectively. The details of pedigree analysis for the Nilagiri population have been reported earlier (Venkataramanan et al., Reference Venkataramanan, Subramanian, Sivaselvam, Sivakumar, Sreekumar, Anilkumar and Iyue2013). EqG i of 2.26 reported for Santa Ines sheep was slightly lower than those found in the present study (Pedrosa et al., Reference Pedrosa, Santana, Oliveira, Eler and Ferraz2010). Comparatively higher EqG i of 4.95 for Bharat Merino sheep was reported by Gowane et al. (Reference Gowane, Prakash, Chopra and Prince2013).
Population parameters from pedigree analysis of Nilagiri and Sandyno sheep populations.

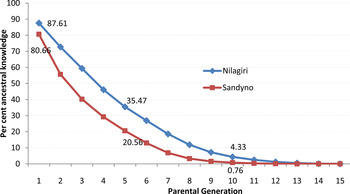
The percent ancestral knowledge for the first and fifth parental generations (first parental generation, fathers; second parental generation, grandfathers; and so on) in Nilagiri sheep were 88 and 36 percent, respectively, and corresponding values for Sandyno sheep were 81 and 21 percent, respectively (Figure 1). Gowane et al. (Reference Gowane, Prakash, Chopra and Prince2013) observed 91 and 58 percent ancestral knowledge for the first and fifth parental generations, respectively, in their study on Bharat Merino sheep. In the present study, among the Nilagiri and Sandyno populations, Sandyno was lower in ancestral knowledge as well as EqG i .
Percent ancestral knowledge in Nilagiri and Sandyno sheep populations.

The average F and EF for the Nilagiri population were 2.17 and 2.44, respectively (Table 3). The Sandyno population was less inbred with F and EF values of 0.83 and 0.84, respectively. This could be due to the breeding programme involved in the formation of the Sandyno breed (Table 2). Several genetic groups with varying levels of exotic inheritance were maintained separate and finally the groups with 75 and 62.5 percent exotic inheritance were merged to form the breed.
The mean ΔF i as a proportion of F was 30 percent (Table 2) in the Nilagiri population compared with 40 percent in Sandyno. Thus the magnitude of difference narrowed down in the Sandyno population, where individual increase in inbreeding adjusts for differences in pedigree depth. The regular inbreeding coefficient, F increases from generation to generation in a non-linear fashion (Gonzalez-Recio, de Maturana and Gutierrez, Reference Gonzalez-Recio, de Maturana and Gutierrez2007). The individual F values are again non-linearly dependent on the pedigree depth of each individual. The differences in pedigree depth could lead to different conclusions concerning inbreeding depression, as noted by Smith, Cassel and Pearson (Reference Smith, Cassel and Pearson1998), Cassell, Adamec and Pearson (Reference Cassell, Adamec and Pearson2003), and Gonzalez-Recio, de Maturana and Gutierrez (Reference Gonzalez-Recio, de Maturana and Gutierrez2007). The equivalent inbreeding coefficient, EF is a function of individual increase in inbreeding, ΔF i which take into account the equivalent number of generation, EqG i. . The use of ΔF i , adjusted for pedigree depth of the individual permits the distinction between two animals with the same inbreeding, but with differences in the number of generations in which this level of inbreeding had occurred (Gonzalez-Recio, de Maturana and Gutierrez, Reference Gonzalez-Recio, de Maturana and Gutierrez2007; Gutiérrez et al., Reference Gutiérrez, Cervantes, Molina, Valera and Goyache2008; Panetto et al., Reference Panetto, Gutiérrez, Ferraz, Cunha and Golden2010).
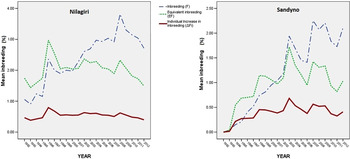
The trend of mean F and EF over years is presented in Figure 2. In both the populations, the line for F surpasses that of EF in the later years, after 2003. The higher values of F could be due to greater depth in ancestral knowledge during later generations. Since EF adjusts for the differences in pedigree, it is high for the earlier periods when pedigree knowledge is sparse. The individual inbreeding rate used for calculating EF avoided potential overestimation in the recent generations attributed to increased numbers of known generations (Gonzalez-Recio, de Maturana and Gutierrez, Reference Gonzalez-Recio, de Maturana and Gutierrez2007; Panetto et al., Reference Panetto, Gutiérrez, Ferraz, Cunha and Golden2010).
Inbreeding and equivalent inbreeding in Nilagiri and Sandyno sheep, according to the year of birth.

Even though substantial inbreeding has occurred in Nilagiri and to some extent in Sandyno, the values are below critical levels. Other studies have shown that inbreeding levels higher than 10 percent could lead to inbreeding depression based economic losses (Lamberson and Thomas, Reference Lamberson and Thomas1984; Ercanbrack and Knight, Reference Ercanbrack and Knight1991; Wiener, Lee and Woolliams, Reference Wiener, Lee and Woolliams1992; Boujenane and Chami, Reference Boujenane and Chami1997; Norberg and Sorensen, Reference Norberg and Sorensen2007). In spite of higher proportion of inbred animals in Nilagiri (increase from 0 to 100 percent in the 15th generation) and Sandyno (increase from 0 to 95 percent in the 15th generation) sheep, the average inbreeding levels were low for these populations. Negussie, Abegaz and Rege (Reference Negussie, Abegaz and Rege2002) observed an overall inbreeding of 0.78 percent in a population of tropical fat-tailed Horro sheep, in which the proportion of inbred animals increased to 81 percent.
The fixed factors of CG, sex and litter size had significant (P < 0.05) influence on all the body weight traits, while age of dam at lambing influenced the weights at earlier ages up to 9 months. With respect to the growth efficiency traits, CG and sex influenced pre- and post-weaning ADG, while type of birth and age of dam at lambing influenced only the pre-weaning ADG.
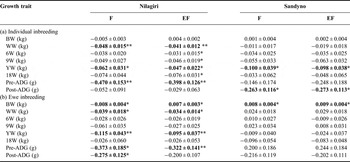
The partial regression coefficients of different growth traits on individual inbreeding (F and EF) in Nilagiri and Sandyno sheep are presented in Table 4a. Except for a few negligible values of BW, all other regression coefficients were negative and indicative of depression due to inbreeding. An overview of most studies before 1984 on inbreeding in sheep indicate that, on average, there was a decrease in early growth traits with inbreeding (Lamberson and Thomas, Reference Lamberson and Thomas1984). In Nilagiri sheep, significant effects of F were observed for WW (P < 0.01), YW (P < 0.05) and pre-weaning ADG (P < 0.01). In addition to these traits, 6W, 9W and 18W were also found to be influenced (P < 0.05) by EF. In Sandyno sheep, the later growth traits (YW and post-weaning ADG) were influenced (P < 0.05) by F and EF. More number of traits were affected by inbreeding in the Nilagiri sheep and this could be due to higher inbreeding levels in the population. Among the significant effects of inbreeding, the depression in growth per 1 percent increase in inbreeding ranged from 0.04 kg in weaning weight to 0.100 kg in yearling weight. Between-breed and within-breed variation in the effect of inbreeding on a particular trait have been observed (Ercanbrack and Knight, Reference Ercanbrack and Knight1981; Boujenane and Chami, Reference Boujenane and Chami1997; Analla, Montilla and Serradilla, Reference Analla, Montilla and Serradilla1998; Pedrosa et al., Reference Pedrosa, Santana, Oliveira, Eler and Ferraz2010; Zadeh, Reference Zadeh2012; Leroy, Reference Leroy2014).
Partial regression of growth traits on inbreeding (F) and equivalent inbreeding (EF) in Nilagiri and Sandyno populations.

BW, birth weight; WW, weaning weight; 6W, 6 months weight; 9W, 9 months weight; YW, yearling weight; 18W, 18 months weight; pre, preweaning; post, postweaning; ADG, average daily gain.
*P < 0.05; **P < 0.01.
In the present study, BW was not affected by F or EF in both the breeds. BW was one of the traits reviewed for effect of inbreeding by Lamberson and Thomas (Reference Lamberson and Thomas1984). Studies on Ossimi, Hampshire and No-tail breeds showed absence of significant effects; while the Merino population showed significant depression with 0.015 kg decrease per 1 percent increase in F. Boujenane and Chami (Reference Boujenane and Chami1997) reported contrasting results for two Moroccan sheep breeds, Sardi and Beni Guil. In Sardi sheep, the individual inbreeding did not have a significant influence on BW, while an increase of 1 percent F decreased BW by 0.0061 kg in Beni Guil breed of sheep. Significant effects of inbreeding of the lamb on birth weight (−0.010 ± 0.003 kg per percent F) in another Indian breed of sheep, Muzaffarnagari, was reported by Mandal et al. (Reference Mandal, Pant, Rout, Singh and Roy2002).
The decrease of 0.048 kg WW per 1 percent increase in F observed in this study was similar to that found by Boujenane and Chami (Reference Boujenane and Chami1997) in Beni Guil and Mandal et al. (Reference Mandal, Pant, Rout, Singh and Roy2002) in Muzaffarnagri sheep. The review by Lamberson and Thomas (Reference Lamberson and Thomas1984) reports the average decrease in weaning weight as 0.111 kg per 1 percent inbreeding, with a range from 0.036 to 0.177 kg per percent F. Higher values of depression in WW than those found in the present study were reported in literature (Ercanbrack and Knight, Reference Ercanbrack and Knight1991; Dorostkar et al., Reference Dorostkar, Faraji Arough, Shodja, Rafat, Rokouei and Esfandyari2012).
Kumar et al. (Reference Kumar, Prince, Mishra and Arora2008) noticed that inbreeding did not affect birth weight, weaning weight or 6 months body weight in the Chokla breed of sheep significantly. In Iranian Moghani sheep, the body weight traits at birth, 3, 6, 9 and 12 months of age were negative but non-significant for values of inbreeding depression (Dorostkar et al., Reference Dorostkar, Faraji Arough, Shodja, Rafat, Rokouei and Esfandyari2012). Zadeh (Reference Zadeh2012) observed significant effects of inbreeding on birth, 3, 6 and 12 months body weight for the same Moghani sheep. But negative effects were noticed only in the case of birth and 12 months weight. Hussain et al. (Reference Hussain, Akhtar, Ali, Younas and Shafiq2006) found significant negative effects of inbreeding on early weight traits (birth and 60 days weight), but the effect diminished as age advanced and a non-significant depression was noticed in the weight at 90 days. Mandal et al. (Reference Mandal, Pant, Rout, Singh and Roy2002) found significant influence of F on pre-weaning ADG. Non-significant influence of F on pre- and post-weaning daily gains in Hissardale sheep from Pakistan were reported by Akhtar et al. (Reference Akhtar, Khan, Mohiuddin and Abdullah2000). The various studies reviewed above are for the effect of inbreeding coefficient F.
Very few studies were available for the effect of ΔF i on growth in sheep. Pedrosa et al. (Reference Pedrosa, Santana, Oliveira, Eler and Ferraz2010) observed significant influence of ΔF i on BW and 6W. The reduction per percent increase in ΔF i was found to be 0.0034 and 0.204 kg, respectively. Gowane et al. (Reference Gowane, Prakash, Chopra and Prince2013) reported non-significant effect of ΔF i on growth in Bharat Merino sheep. The inclusion of individual increase in inbreeding was found to be adequate for quantification of inbreeding depression in growth of Brazilian Marchigiana and Bonsmara breeds of cattle (Santana et al., Reference Santana, Oliveira, Eler, Gutierrez and Ferraz2012). Panetto et al. (Reference Panetto, Gutiérrez, Ferraz, Cunha and Golden2010) also observed significant effects of inbreeding on age at first calving, average daily milk yield and calving interval by using F and EF as measures of inbreeding in Gyr cattle.
The effect of ewe inbreeding on lamb growth traits is presented in Table 4b. In Nilagiri sheep, F and EF had significant influence on BW, WW, YW and pre-weaning ADG. In addition to these traits, F had influence on post-weaning ADG also. All the significant effects were found to be negative with maximum depression of about 0.1 kg in YW per 1 percent increase in inbreeding. The review by Lamberson and Thomas (Reference Lamberson and Thomas1984) also indicate depressive effect of ewe inbreeding on growth traits and greater influence was noticed in BW. Boujenane and Chami (Reference Boujenane and Chami1997) also found negative effect of inbreeding of dam on early growth traits up to 30 days of age. In contrast, both F and EF caused a negligible increase of 0.008 and 0.009 kg, respectively, per 1 percent increase in inbreeding. In this population, none of the other traits were affected by ewe inbreeding. As explained earlier, Sandyno was a more heterogenous population with lower average inbreeding coefficient.
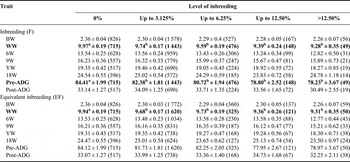
With respect to the effect of level of inbreeding, in Nilagiri sheep (Table 5), both inbreeding (F) and equivalent inbreeding (EF) classes had significant (P < 0.05) influence on WW. In addition, F was found to influence (P < 0.05) pre-weaning ADG. The class with zero inbreeding was significantly different and superior to other classes for WW and pre-weaning ADG. The least-squares mean for inbreeding level above 12.5 percent was found to be the lowest in all the traits. As seen in earlier studies (Lamberson and Thomas, Reference Lamberson and Thomas1984), earlier growth traits were affected by F and EF in Nilagiri sheep.
Estimated mean growth traits for different classes of inbreeding and equivalent inbreeding in Nilagiri sheep.

Traits with significant effects are in bold. Subclass means bearing different superscripts are different (P < 0.05) from each other.
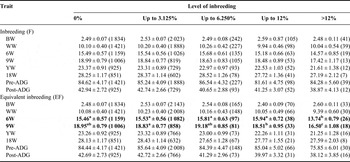
In Sandyno sheep (Table 6), none of the traits were affected by F, while EF caused significant (P < 0.05) depression in 6W and 9W. Lowest means in these traits were noticed in the fifth level with inbreeding above 12.5 percent. In general, the traits declined with increase in inbreeding and in most of the cases the fifth levels of inbreeding class with more than 12.5 percent of inbreeding showed lower mean values. In earlier studies, the levels of individual inbreeding coefficient, above which depression on growth traits were found to be maximum were reported as 10 percent (Norberg and Sorensen, Reference Norberg and Sorensen2007), 15 percent (Ercanbrack and Knight, Reference Ercanbrack and Knight1991), 25 percent (Wiener, Lee and Woolliams, Reference Wiener, Lee and Woolliams1992) and 30 percent (Boujenane and Chami, Reference Boujenane and Chami1997).
Estimated mean growth traits for different classes of inbreeding and equivalent inbreeding in Sandyno sheep.

Traits with significant effects are in bold. Means bearing different superscripts within a row are different (P < 0.05) from each other.
Among the traits for which inbreeding classes had significant influence, weightage given to individuals based on the differences in EqG i resulted in changes in the distribution of data between inbreeding classes of F and EF. Compared with frequency distribution of F classes, EF classes showed an increase in the number for the extreme classes 2 and 5 (<3.125 percent and >12.5 percent) and decrease in number for the intermediate classes 3 and 4 (from 3.125 up to 12.5 percent), in both the populations. This difference was more evident in the Sandyno breed, with lesser pedigree information.
In the present study, the two populations, Nilagiri and Sandyno showed variations in the magnitude and type of traits affected by inbreeding. More traits, especially those at early age were affected by inbreeding in the Nilagiri population, in which inbreeding was high (Table 4). The average inbreeding (both F and EF) in the Sandyno was lesser than that of Nilagiri population. Probably, in the Sandyno population inbreeding has not reached sufficient levels to cause depression in the unaffected traits. Moreover, the Nilagiri breed is more uniform and has been under selection for a longer period of time, while Sandyno is a newer breed, more heterogenous than Nilagiri sheep (Table 2).
Inbreeding depression was noticed in some of the growth traits in Nilagiri and Sandyno breeds of sheep. Magnitude of depression was more with levels of inbreeding greater than 12.5 percent inbreeding. Inbreeding depression was found in more number of traits in the Nilagiri population, which was more inbred and less heterogenous than the Sandyno population. Even though inbreeding is usually known to affect fitness traits, depressive effects are also evident in production traits like growth. EF was higher than F for individual animals with lesser pedigree depth during earlier generations in both the populations. The trend of F and EF over years indicates that EF adjusts for the differences in pedigree knowledge and prevents overestimation of inbreeding during later generations, when individuals have greater depth in their pedigrees. In Sandyno sheep with lesser pedigree information, EF as covariate showed greater magnitude of depression and EF included as fixed classes showed more traits to be significant compared with F. EF can be used as an alternative measure of inbreeding, especially when deficiency in ancestral knowledge could lead to potential bias in the values of traditional F.
Acknowledgements
The authors thank the Director of the Centre for Animal Production Studies, TANUVAS for permitting to utilize the data from SBRS, Sandynallah for this study, which is part of Ph.D. programme of the first author at Madras Veterinary College, TANUVAS, Chennai. The contributions of the staff of animal breeding at the research station in recording and maintenance of data is acknowledged.