
THE VALUE AND DIFFICULTY OF MEASURING
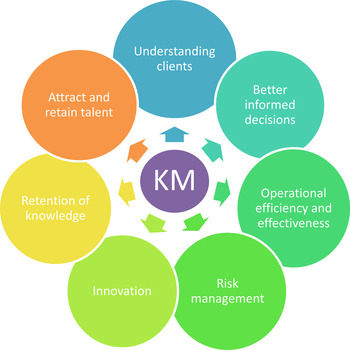
There are many ways that knowledge artifacts and flows can benefit organizations (see Figure 1).
The benefits of Knowledge Management.

Measuring the numbers of knowledge artifacts or activities is not usually difficult. You could probably easily find out how many articles you have in your firm's database or how many training meetings took place last month. The difficulty lies in understanding how those artifacts/activities are acting on your firm to help or hinder it, in its goals; understanding the quality of those knowledge artifacts/activities and whether they provide a good return on investment.
When considering the effect of artifacts and activities, there are usually many complex factors at play. The effects of a single knowledge project are intricately entwined with other business systems and affected by serendipitous events and events outside the organization's control.
For example, a lawyer is mulling over a complex issue and is planning to look at the firm's knowledge bank before drafting a complex document. He decides to get a coffee first. Whilst making his coffee he chats to another lawyer and discovers that she has recently dealt with the same issue, researched it intensively and found a neat solution which her client was delighted with.
This is clearly a successful knowledge activity/interaction: the first lawyer finds a solution in an efficient and effective way which will please his client and the second lawyer is not particularly inconvenienced. What, however, would be measured and what would this interaction tell us about this firm's KM systems? Nothing would be recorded in any database viewing/download figures and it may not be recalled by either lawyer during an annual knowledge survey. Is this a success for the knowledge-sharing culture, a failure of the knowledge database, neither or both?
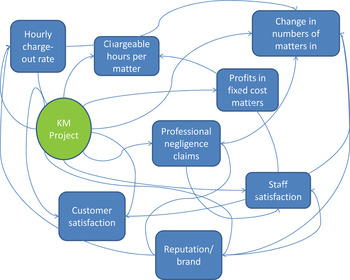
Similarly, when lawyers are trying to understand whether it is more cost-effective to impose a particular workflow or checklist, this may have a more complicated result than a simple change in billings or profits (see Figure 2). There could be lower chargeable hours per matter and lower billing levels in the short term, but higher quality advice, higher customer satisfaction, lower professional negligence claims, lower attrition rates and more matters undertaken or higher profit fixed fees in the long term.
The effects of Knowledge Management projects.

How well KM activities work in a law firm depends greatly on its culture, history and the dedication of the individuals involved, as well as factors outside the firm's control.
Although it is undoubtedly difficult to value ‘knowledge’ and knowledge activities and systems, the pragmatic truth is that those who run organizations need to understand what return on investment they will get for their spending on KM, which projects or schemes ought to be rolled out more widely and which projects or activities should be changed.
WHERE TO START WITH KM MEASUREMENT
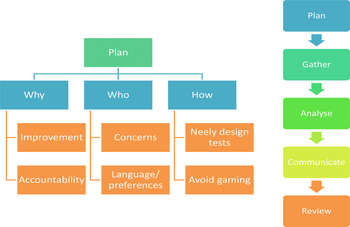
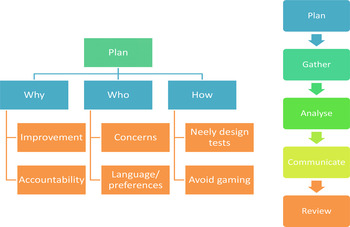
Figure 3 shows the process for designing and planning a measurement system for a particular KM project.
How to create and use measurement systems in KM.

I recommend that you start with the following:
-
1. Why: what is the purpose in measuring
-
2. Who: who is your audience for the measurement
-
3. How: understand the practicalities of measuring for an accurate result.
You should also keep in mind these two truisms:
‘What is measured gets managed’ Footnote 1
What is measured within a business tends to get noticed and improved. Things that aren't measured often languish on the ‘to do’ pile.
“You get what you measure” Footnote 2
Measurement itself can have unexpected and often negative results, with employees focusing on improving figures themselves rather than the business case behind those measurements.
‘WHY’: UNDERSTANDING YOUR PURPOSE
Your first task is to understand your purpose for the measurement:
-
1. What is the business benefit of knowing this answer?
-
2. What are you going to do with the results?
You need to take the appropriate level of measurements to inform and support your decision-making and action. There is no point in measurement for measurement's sake and too many measurements can be counterproductive as they can create confusion.
If you can't take action based on the measurement in relation to that KM project or activity, don't waste time and money on that aspect unless you are gathering evidence for a known future action.
If you are unsure whether your measurement is actionable, ask yourself whether you want the measurement to go up, down or stay flat. If you don't know which way you want the measurement to go, or don't know what you will do in each situation, the measurement is not actionable.
Common reasons for measuring KM activities are:
-
• Improvement/quality and
-
• Judgment/accountability
For example, most KMers will be measuring to find out:
-
• If their actions or an investment are adding value to the organization.
-
• If a particular implementation is on track, a particular approach is working and to identify gaps in their approach.
-
• If they should expand a pilot KM project, tweak it or shelve it.
-
• What their users/stakeholders natural modes of working are, in order to design KM activities which suit them and so are more likely to be adopted.
-
• If their stakeholders are fulfilling their part of the “KM-bargain”, and if not, how the system can be adapted to encourage more participation.
-
• Identify the key barriers to engagement.
Your ‘purpose’ for measuring will drive the development of your measurement systems.
Given how difficult it is to understand the effect of KM activities and projects on business outcomes (see Figure 2), I recommend that you take a balance of measurements. The complexity of your measurement system will depend upon the size and nature of the project and budget, but I recommend that you at least include qualitative and quantitative, leading and lagging measurements for even small projects. Whether you measure across all four perspectives of the Balanced Scorecard (see Box 1) depends on the project and its budget. Too many measurements are as unhelpful as too few.
The Balanced Scorecard
The balanced scorecard, proposed by Kaplan and Norton in Reference Kaplan and Norton1992 Footnote 3 and updated in 2000,Footnote 4 is one of the most influential business ideas in relation to business drivers over the last 75 years. They had found that traditional financial accounting measures, such as earnings per share and return on investment were giving misleading signals and negatively affecting business's ability to innovate and improve continuously.Footnote 5
The balanced scorecard emphasizes a simple but balanced perspective, using a handful of hard and soft measures and leading and lagging indicators, built around four key areas:
-
1. How do customers see us? (customer perspective)
-
2. What must we excel at? (internal business perspective)
-
3. Can we continue to improve and create value? (innovation, knowledge and learning perspective)
-
4. How do we look to shareholders and financially? (financial stewardship perspective)
It aims to act like ‘dials in a cockpit’ so that managers can take in complex information from all four perspectives at a glance and ensure that improvements in one area (say, financial) are not at the expense of other areas (say, customer perspective or innovation/learning), keeping the organization on track against its strategy.
It is easier to measure what has happened in the past, but this will only tell you whether past actions have worked or not, not whether what you are currently doing will be a success. For this reason, the balanced scorecard also blends ‘looking back’ and ‘looking forward’ to keep organizations on track.
‘Looking back’ measures are ‘lagging indicators’ and are output measures, such as changes to profitability, and tell you what has already happened.
‘Looking forward’ measures are ‘leading indicators’ and are input measures, such as the ongoing costs (of staff, of IT) and activity measures such as level of participation (web page views, amount of activity on a wiki), and give you ‘early warning’ of what might happen.
Both leading and lagging factors can be quantitative or qualitative.
For example, you run knowledge creation and acquisition projects as part of your KM work and you would like to trial a change to a training and learning programme by swapping from in-person training lunches based on lectures, to online videos and quizzes. You could wait until the programme has run its course, had a positive or negative effect on the knowledgeability of your staff and led to a measurable change in numbers of clients and profitability, or you could take leading measurements to give you early warning if the programme isn't working. Leading measurements in this case could include the numbers of people taking, finishing or passing the online courses. If the numbers of people wanting to start the course drops, word may have spread that people do not feel the courses are worth investing time in. If people are keen to start and finish, but fail the quizzes, you will get an early warning that something is not right with the content or delivery of the knowledge.
WHO: UNDERSTANDING THE AUDIENCE FOR THE MEASUREMENT
You measure your KM projects in order to take some form of action, so it doesn't really matter how sound your dataFootnote 6 is, if you cannot communicate the results in a way that is persuasive for those who need to take action.
Common audiences for the measurement are:
-
• Those running KM activities or projects;
-
• Users, stakeholders or communities your KM activities/projects serve;
-
• Managers and directors at various levels in the firm and those who allocate resources.
Once you've clarified your audience, you need to ask yourself:
“For the purpose I've identified, what does this audience ‘care’ about?”
Concentrate on the measurements or KPIs within the four Balanced Scorecard perspectives that your audience cares particularly about. You can look at financial stewardship in several ways, but your senior managers probably have a favourite measurement they always take notice of. No matter how great you think your measurements are, if they don't persuade your audience, who will need to take action, they haven't fulfilled their purpose.
If you are uncertain about your audience's preferences, ask them. This isn't a matter of ‘sexing up’ data to mislead. It is about avoiding wasting time measuring one aspect when a different but similar one would have a more persuasive effect on that audience. Even if their preferred measurement isn't the perfect one in your opinion, still use it. It has the benefit of being established and authoritative to your audience. If you really can't use it, explain how your measurements link to it.
For example, you are measuring to demonstrate that a particular KM project is making a difference to profitability and ought to be rolled out more widely and your audience is senior partners and your Executive Board.
Ask yourself:
-
• What do those senior partners care about? What keeps them up at night?
-
• What data have they previously taken notice of?
-
• What “language” do they listen to and speak?
This audience may worry about profitability, levels of innovation when new competitors enter their market, or key staff attrition after a merger, depending on what is happening in the firm at the time. They may mainly care about profit per equity partner or they may be focused on market position and client satisfaction surveys.
Alternatively, if you are using a measurement to help you understand whether a smaller KM project appears to be a beneficial use of your own limited time, you may focus on measurements which you personally find compelling. For example, you think a project relating to serendipitous conversation will improve trusting networks and person-to-person knowledge sharing. It isn't a complex, expensive, unpopular or onerous project, so you may want to minimize the cost of measurement and focus on a simple one-off qualitative measurement, such as a survey or focus group. Once you have satisfied yourself that the project appears to be working and is worth rolling out further, you may widen measurements across the four balanced scorecard perspectives to ensure that there are no unanticipated negative results which could steer your firm off course and which will include measurements meaningful for the new audience, who may not be persuaded by a focus group, but may be persuaded by a reduction in early notification of potential professional negligence claims or an increase in client satisfaction measurements in relation to knowledgeability of staff.
Try also, where possible, to gather stories which illustrate your data, as well as the data itself. Whilst an increase in general client satisfaction measurements may be compelling, hearing the audio file of the actual interview with a client expressing in their own words how the knowledgeability of staff persuaded them to place more orders is even more compelling.
HOW: DECIDING ON THE PRACTICALITIES OF MEASUREMENT
Once you are clear on the purpose of your measurement and its audience, you will need to decide on the practicalities. Your measurements should be reliable and valid and, for larger projects, you should spell out your methodology.
You need to be clear about:
-
• What measurements you are going to take and how you are going to take them;
-
• Who will collect the data;
-
• How, when and how often will they collect it.
You will also need to consider how much you can afford to spend on measurement. Some measurements will be collected in any event so are low in cost (although don't forget that you'll still need to analyze the results) and some will cost money to arrange, collect and analyse. The nature of your KM project and its potential to affect your organization will determine your budget for measurement.
As you are only measuring in order to take action in relation to your KM project and activities, you need to have a trustworthy baseline from which to note changes. You must also ensure you take the same measurements in the same way before and after the change for the results to be reliable (comparing ‘apples with apples’).
A balance of measurements (using qualitative and quantitative, leading and lagging, across the four facets of the balanced scorecard) can get us closer to understanding what is happening because of our activities and overcoming the difficulties outlined above. It will also help us to even out any gamingFootnote 7 (see Box 2).
User surveys are extremely valuable for qualitative research, but can't be used too often because of user-fatigue. Surveys can include both qualitative and quantitative elements and can focus on one project or activity or combine questions about several. Where you would like to distil an opinion into an easily comparable figure, I recommend using a Likert Scale (where your respondents rate their response from 1 to 5, 1 being ‘strongly disagree’ and 5 being ‘strongly agree’). There is more advice on how to write a good survey at Annex 4. Informal discussions are just as important as formal soundings, so also get to know what people think by talking to them.
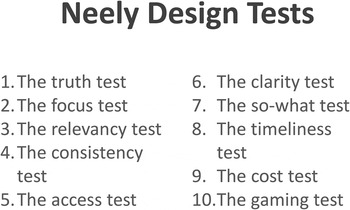
At this point, I recommend that you take a moment to read and understand the ten measurement design tests (Figure 4 and Annex 3) described by Professor Andrew Neely, Pro-Vice-Chancellor, Enterprise and Business Relations, University of Cambridge and expert in designing KPIs and measuring business performance.
The Neely Design Tests.

Whilst not all KM projects will be sufficiently large to warrant measurements which fulfil all these design tests, these tests are a great checklist to ensure that:
-
• You measure only what is necessary and relevant at the time that it is needed;
-
• Your measurements are the easiest and cheapest measurements to take, and remain consistent whoever gathers the data;
-
• You continue to measure only what you set out to measure.
You need to understand what is truly important to the firm to ensure that you concentrate on the right aspects. Once you have your data, remember that all measurements are not equal in value: ‘non-chargeable time saved’ within a law firm is unlikely to be more important than quality, firm reputation or new business won, unless the changes are sizeable.
Unintended consequences and “gaming”
Measurement systems can cause distortions and unexpected consequences, particularly where they are linked to performance. These distortions can be conscious or subconscious, as people change their behaviour to meet the targets set for them or the measurement systems applied to them.
There are numerous examples of unintended consequences to measurement systems in everyday life: teachers teaching to the test for SATs, not to benefit pupils’ needs, but to improve their school's ranking or avoid criticism by Ofsted; GPs refusing to book patients in for appointments at all, even when patients are happy to wait, so as not to breach government rules about patients waiting 48 hours for an appointment.
People are nearly always more intelligent than systems. Your users and particularly your subject matter experts are likely to spot any weaknesses in your measurement systems and work out how to ‘game’ the results that affect them. Quantitative measurements are particularly susceptible to gaming and so should always be balanced with qualitative measurements.
For example, in a law firm, you decide to measure numbers of submissions to a KM database as part of your measurements to try to understand the value of that database and the knowledge-sharing attitude of your lawyers. You wish to promote knowledge sharing, so you also reward this, perhaps by noting it during annual appraisals. You find an annual spike of submissions shortly before performance reviews. Of course, this is not a problem if the quality is good, although it would be easier to manage if submissions were spread out throughout the year, but quality is unlikely to be good if ‘box ticking’ is the motivator. The firm ‘gets what it measures’, in that it emphasizes other aspects of profitability all year, then switches to ‘softer’ aspects at appraisal time.
Gaming can be minimized by approaching measurement using different angles and by keeping an eye out for unusual results or improvements in quantitative results which don't reflect an improvement in quality, or are not matched by qualitative comments.
ANALYSIS OF DATA
As part of this practical guide, I won't be delving deeply into statistical analysis. My own experience has been that, in most cases, only simple tools are needed. You are primarily looking for relationships and trends, i.e. when X happens, what happens to Y? You will usually just need percentages, averages, ratios and divergence from the mean/median/mode. If the picture you uncover appears to be more complex, I recommend you tap into your network for help from someone with the right data analysis skills.
REPORTING RESULTS
No matter how carefully you collate your data, you will need to communicate your results in a compelling way for it to be persuasive.
-
• Engage with your audience's needs and wants.
-
• Give enough context so that people can understand the results.
-
• Include the human face to the figures – a story or anecdote will have impact on your audience.
-
• Decide where and how to publicise the results. If you plan to release the results on to the intranet, who will see it? Do you want all the results available to everyone or do you want a detailed version for the Executive Board and a slimmed down version for the whole organisation? What state of mind will your audience be in when they receive your results? How can you maximize their understanding?
UPDATING YOUR MEASUREMENTS
As you gain experience in measuring your KM projects/activities, you will need to revise and update your measurement system. This could be for many reasons, but the most common are:
-
• Some of the goals (the ‘Why’) need refining.
-
• Your firm has grown, merged, adapted to different customers, changed its IT systems or similar.
You will need to identify any overlapping measurements and simplify them and you will need to replace measurements that are proving to be unhelpful, or those that have become too costly to justify. You will also learn which measurements work particularly well with which audiences.
All the time you will need to keep a delicate balance between keeping measurements the same (so you can identify trends over time, measuring ‘apples against apples’), adapting to new circumstances, and simplifying and focusing your measurements.
I recommend that you revisit your measurements and the Neely design tests at suitable intervals, perhaps annually, and adapt the measurements as appropriate.
SUMMARY
Use Figure 3 page to help you plan and implement your measurement systems.
-
1. Define the business objectives of measurement and understand what success will look like;
-
2. Identify those being measured and the audience for the results—each stakeholder views KM and defines success differently;
-
3. Decide what data will be collected and how. Use Neely's measurement design tests to ensure your measurements are appropriate;
-
4. Analyze and communicate the measures in the language of your audience;
-
5. Take action in relation to business objectives based on the results;
-
6. Review your combination of measures to ensure the right balance of quantitative and qualitative, leading and lagging measurements, and adjust as your goals develop;
-
7. Keep under review unexpected consequences and ‘gaming’ the system of measurement;
-
8. Do not measure everything—focus on what's important.
Further Reading
Books
Clare, M. and Detore, A. (2000) Knowledge Assets: A Professional Guide to valuation and Finance Management.
Maister, D. (2003) Managing the Professional Services Firm, Simon & Schuster UK: London.
Rumizen, M. (2002) The Complete Idiot's Guide to Knowledge Management, CWL Publishing Enterprises: Madison.
Wise, R. (2013) Managing with Measures, Ellicott Press.
Articles/Papers/Websites
APQC (2011) How Mature is Your KM Program? https://www.apqc.org/knowledge-base/download/250280/K03302_Understanding%20the%20APQC%20KM%20CAT.pdf (accessed November 2016).
Iftikhar, Z. (2003) Developing an Instrument for Knowledge Management Project Evaluation Electronic Journal of Knowledge Management 1:1 55–62.
Kaplan, R. and Norton, D. (1992) The Balanced Scorecard – Measures that Drive Performance Harvard Business Review Jan/Feb 71–79.
Kaplan, R. and Norton, D. (2001) Transforming the Balanced Scorecard from Performance Measurement to Strategic Measurement: Part 1 Accounting Horizons 15:1.
Lopez, K. et al. (2001) Measurement for Knowledge Management, Knowledge Management October 2001.
Milton, N. Metrics in Knowledge Management http://www.knoco.com/Knoco%20white%20paper%20-%20KM%20Metrics.pdf (accessed November 2016).
ANNEX 1: Summary of potential ways of measuring KM systems
Summary of potential ways of measuring KM systems.

-
Quantitative: relating to/based on the amount or number of something
-
Qualitative: relating to/based on the quality or character of something
-
Leading measures: input indicators that drive performance and give you early warning
-
Lagging measures: output measurements of what has already happened at the end of a set time period
-
Customer Perspective: How do customers see us?
-
Internal Business Perspective: What must we excel at?
-
Knowledge and Learning Perspective: Can we continue to improve and create value?
-
Financial Stewardship Perspective: How do we look to shareholders and financially?
ANNEX 2: The big list of potential ways to measure KM systems
Quantitative:
-
1. System user statistics;
-
2. Hits on a webpage;
-
3. Load times of web pages;
-
4. Dwell times (how long a user stays on a page);
-
5. Numbers of unique users;
-
6. Repeat visitors to a page;
-
7. Usage of externally provided KM;
-
8. % of total employees using a system;
-
9. Uses of a precedent/the precedent database;
-
10. Numbers of contributions to knowledge database;
-
11. Numbers of questions asked on a discussion forum;
-
12. Frequency of updates by users;
-
13. Numbers of active community members;
-
14. Frequency of AAR meetings;
-
15. Numbers of calls to Information Services professionals;
-
16. Numbers of queries raised and responded to;
-
17. Time taken to respond to queries;
-
18. Numbers of people trained in KM;
-
19. Numbers of KM champions or sponsors;
-
20. Training events prepared/attended;
-
21. Length of time devoted to certain activities (e.g. preparing tenders or client seminars);
-
22. Non-chargeable time recorded;
-
23. Speed of document production;
-
24. Time to create new knowledge;
-
25. Number of repeat complaints;
-
26. Professional indemnity insurance claims;
-
27. Number of identified experts;
-
28. Number of people active in Communities of Practice (COPs);
-
29. Number of new employees;
-
30. Level of staff retention;
-
31. Retention of key staff;
-
32. Numbers of clients lost to leaving staff;
-
33. Number of knowledge debriefs;
-
34. Number of knowledge stories;
-
35. Invitations to speak at conferences/seminars, etc;
-
36. Number of publications in relevant literature;
-
37. Number of contacts with knowledge institutes;
-
38. Benchmarking against suppliers, customers and peer businesses;
-
39. KM budget availability;
-
40. Proportion of employees making new idea suggestions;
-
41. Time to develop new ideas;
-
42. Ratio of new ideas generated to new ideas implemented;
-
43. % of sales earned with new knowledge;
-
44. Savings by knowledge re-use;
-
45. Support staff cost reductions;
-
46. Reduction in cost of quality;
-
47. Information maintenance costs;
-
48. KM IT tool outage levels;
-
49. Level of leverage within a department;
-
50. % profit from fixed fee work;
-
51. Utilization level within a department;
-
52. Realization levels within a department;
-
53. Change in ranking in expert directories (such as Legal 500 or Chambers);
-
54. Level of understanding of KM within business plan/KM vision.
Qualitative:
Could be measured by surveys (of users, of support staff, of supervisors), focus groups, consultations etc.
-
55. Ease of access;
-
56. Quality of document production (that is, fewer mistakes);
-
57. Ease of location of an expert;
-
58. User (both user and support staff) satisfaction;
-
59. Confidence in the systems (success stories);
-
60. Quality of contributions to knowledge databases;
-
61. Sharing and use of best practices;
-
62. Ease of employing quality staff;
-
63. General employee satisfaction (both user and support staff);
-
64. Tool availability;
-
65. Knowledge user complaints;
-
66. Knowledge user satisfaction;
-
67. Client satisfaction in quality of legal work;
-
68. Client satisfaction in supporting client-facing KM (portals, newsletters, seminars);
-
69. Perceived usefulness surveys – how KM tool helps users accomplish their objectives;
-
70. Effectiveness of sharing communities;
-
71. Perceived attitudes to failure;
-
72. Perceived attitudes to knowledge hoarding or other barriers to knowledge sharing.
ANNEX 3: Ten Measure Design TestsFootnote 8
-
1. The truth test – are we really measuring what we set out to measure?
-
2. The focus test – are we only measuring what we set out to measure?
-
3. The relevancy test – is it the right measure of the performance measure we want to track?
-
4. The consistency test – will the data always be collected in the same way whoever measures it?
-
5. The access test – is it easy to locate and capture the data needed to make the measurement?
-
6. The clarity test – is any ambiguity possible in interpreting the results?
-
7. The so-what test – can and will the data be acted upon?
-
8. The timeliness test – can the data be accessed rapidly and frequently enough for action?
-
9. The cost test – is the measure worth the cost of measurement?
-
10. The gaming test – is the measure likely to encourage undesirable or inappropriate behaviour?
ANNEX 4: Survey checklist
Design
-
• Plenty of open space and clear formatting
-
• Easy to read font
-
• Reasonable total length or divided into sections
-
• Start with easy questions
Questions
-
• Short and succinct
-
• Free of jargon
-
• Clear and specific
-
• More options than Yes/No (i.e. a 5 point Likert scale + ‘don't know’)
Avoid
-
• Double negatives
-
• Over-reliance on respondents’ memories
-
• Leading questions
-
• Loaded questions
-
• Double-barrelled questions
-
• Splitting questions over 2 pages
ANNEX 5: Example and template