INTRODUCTION
Testing the hypothesis of panmixia can provide valuable insight into the ecology and evolution of parasite populations. A panmictic population is one in which every individual has an equal chance of mating with another individual. Disruption of panmixia can happen at several scales, and ultimately leads to genetic structuring. For example, inbreeding (matings between relatives) increases homozygosity among individuals and isolation among geographical subpopulations will result in allele frequency divergence due to genetic drift. Because the pattern of genetic structuring depends on the ecological mechanism that generates the disruption, population genetics data can be used to elucidate these disruptive mechanisms and hence provide indirect inferences on population biology such as mating systems, dispersal patterns, or historical processes (e.g., population growth/decline). Consequently, population genetics data are of special relevance to parasitic organisms where the direct observation of population dynamics or even species identification is often precluded, and thus cryptic in nature, due to their small sizes, sites of infection on or in a host, life-cycle complexities, or limited intra- or interspecific morphological variability (Nadler, Reference Nadler1995; Criscione et al. Reference Criscione, Poulin and Blouin2005; de Meeûs et al. Reference de Meeûs, McCoy, Prugnolle, Chevillon, Durand, Hurtrez-Bousses and Renaud2007a). Moreover, genetic structuring can affect the evolutionary potential of populations (e.g., inbreeding increases the efficiency of directional selection; Hedrick, Reference Hedrick2005). Thus, population genetics data are needed to develop predictive hypotheses about parasite evolutionary dynamics (e.g., evolution of resistance to host immunity or anti-parasitic drugs). As in free-living organisms, non-panmixia in parasite populations may occur at the scale of individuals (non-random mating within populations) or among geographical locations (disruption of gene flow). What is unique and intriguing about the parasitic lifestyle is that panmixia can be further disrupted by 2 additional mechanisms that function within a localized geographical area: separation among sympatric host species and non-random transmission among individual hosts (i.e., infrapopulations; cf. Bush et al. Reference Bush, Lafferty, Lotz and Shostak1997) of a single host species population.
Here we provide a review of population genetic studies that address local-scale panmixia in metazoan parasites of animals. Certainly, many of the topics we cover are likely to be applicable to parasites of plants and protozoan parasites. The taxonomic restriction is largely a reflection of our laboratory's research interest rather than biological and is meant to provide a more concise review. It is clear that parasite life-history traits, host vagility, and/or historical processes (e.g., vicariance or colonization events) can disrupt panmixia over a geographical landscape (e.g., Criscione and Blouin Reference Criscione and Blouin2004, Reference Criscione and Blouin2007; Nieberding et al. Reference Nieberding, Morand, Libois and Michaux2006; Whiteman et al. Reference Whiteman, Kimball and Parker2007; Wielgoss et al. Reference Wielgoss, Taraschewski, Meyer and Wirth2008; Štefka et al. Reference Štefka, Hypša and Scholz2009). However, it is probably less well-appreciated that factors other than inbreeding can lead to or explain non-panmictic patterns at local scales in parasites. By local scale we are referring to what one might consider to be a single host population or a small geographical area where a parasite (of a given life stage) infects sympatric host species. We highlight the evolutionary significance of non-panmixia on local scales and the genetic patterns that have been used to identify the different factors that may cause or explain deviations from panmixia on a local scale. Geographical patterns are only discussed if they help support the local-scale conclusions. We also discuss how tests of local-scale panmixia can provide a means to infer parasite population dynamics and epidemiology of medically relevant parasites.
At the heart of testing for deviations from panmixia is the principle of Hardy-Weinberg equilibrium (HWE). Deviations from panmixia will alter genotypic proportions expected under HWE. These deviations can be quantified with the fixation indices F IS and F ST that were designed by Wright (Reference Wright1969). For the sake of brevity, we refer readers to de Meeûs et al. (Reference de Meeûs, McCoy, Prugnolle, Chevillon, Durand, Hurtrez-Bousses and Renaud2007a) and Hedrick (Reference Hedrick2005) for in-depth explanations of these indices (see also definitions in Table 1). Briefly, these indices measure the proportional change in heterozygosity (expected under HWE) that is due to non-random union of gametes in a subpopulation (F IS) or subdivision of a population into subpopulations (F ST). F IS can range from −1 to 1, where 0 indicates HWE within the subpopulation. Negative values (excess heterozygotes) can result from inbreeding avoidance, small population sizes, and asexual reproduction (de Meeûs et al. Reference de Meeûs, McCoy, Prugnolle, Chevillon, Durand, Hurtrez-Bousses and Renaud2007a). Positive values (excess homozygotes) can be generated by matings between relatives (e.g., biparental inbreeding or inbreeding from self-mating in hermaphrodites) and when 2 genetically diverged populations (often unrecognized) are analysed as 1 (the Wahlund effect, Table 1). F ST ranges from 0 to 1 where 0 indicates no genetic subdivision among subpopulations (e.g., equal allele frequencies among subpopulations) and increasing values indicate a trend toward fixation of different alleles in different subpopulations (see Meirmans and Hedrick (Reference Meirmans and Hedrick2011) for discussion on standardizing F ST). F ST is largely affected by genetic drift and gene flow and, in the case of metazoan parasites, can be influenced by non-random transmission among infrapopulations (Criscione et al. Reference Criscione, Poulin and Blouin2005). Because F IS requires measures of observed and expected heterozygosity, our review is restricted to studies that use co-dominant, neutral genetic markers (e.g., allozymes, single copy-nuclear microsatellites).
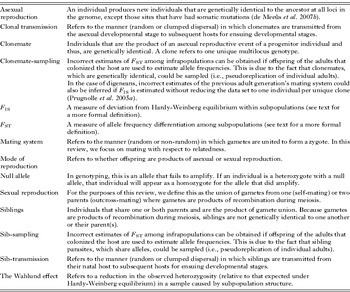
Glossary of terms in review

| Asexualreproduction | An individual produces new individuals that are genetically identical to the ancestor at all loci in the genome, except those sites that have had somatic mutations (de Meeûs et al. Reference de Meeûs, Prugnolle and Agnew2007b). |
| Clonal transmission | Refers to the manner (random or clumped dispersal) in which clonemates are transmitted from the asexual developmental stage to subsequent hosts for ensuing developmental stages. |
| Clonemate | Individuals that are the product of an asexual reproductive event of a progenitor individual and thus, are genetically identical. A clone refers to one unique multilocus genotype. |
| Clonemate-sampling | Incorrect estimates of F ST among infrapopulations can be obtained if offspring of the adults that colonized the host are used to estimate allele frequencies. This is due to the fact that clonemates, which are genetically identical, could be sampled (i.e., pseudoreplication of individual adults). In the case of digeneans, incorrect estimates of the previous adult generation's mating system could also be inferred if F IS is estimated without reducing the data set to one individual per unique clone (Prugnolle et al. Reference Prugnolle, Liu, de Meeûs and Balloux2005a). |
| F IS | A measure of deviation from Hardy-Weinberg equilibrium within subpopulations (see text for a more formal definition). |
| F ST | A measure of allele frequency differentiation among subpopulations (see text for a more formal definition). |
| Mating system | Refers to the manner (random or non-random) in which gametes are united to form a zygote. In this review, we focus on mating with respect to relatedness. |
| Mode of reproduction | Refers to whether offspring are products of asexual or sexual reproduction. |
| Null allele | In genotyping, this is an allele that fails to amplify. If an individual is a heterozygote with a null allele, that individual will appear as a homozygote for the allele that did amplify. |
| Sexual reproduction | For the purposes of this review, we define this as the union of gametes from one (self-mating) or two parents (outcross-mating) where gametes are products of recombination during meiosis. |
| Siblings | Individuals that share one or both parents and are the product of gamete union. Because gametes are products of recombination during meiosis, siblings are not genetically identical to one another or their parent(s). |
| Sib-sampling | Incorrect estimates of F ST among infrapopulations can be obtained if offspring of the adults that colonized the host are used to estimate allele frequencies. This is due to the fact that sibling parasites, which share alleles, could be sampled (i.e., pseudoreplication of individual adults). |
| Sib-transmission | Refers to the manner (random or clumped dispersal) in which siblings are transmitted from their natal host to subsequent hosts for ensuing developmental stages. |
| The Wahlund effect | Refers to a reduction in the observed heterozygosity (relative to that expected under Hardy-Weinberg equilibrium) in a sample caused by subpopulation structure. |
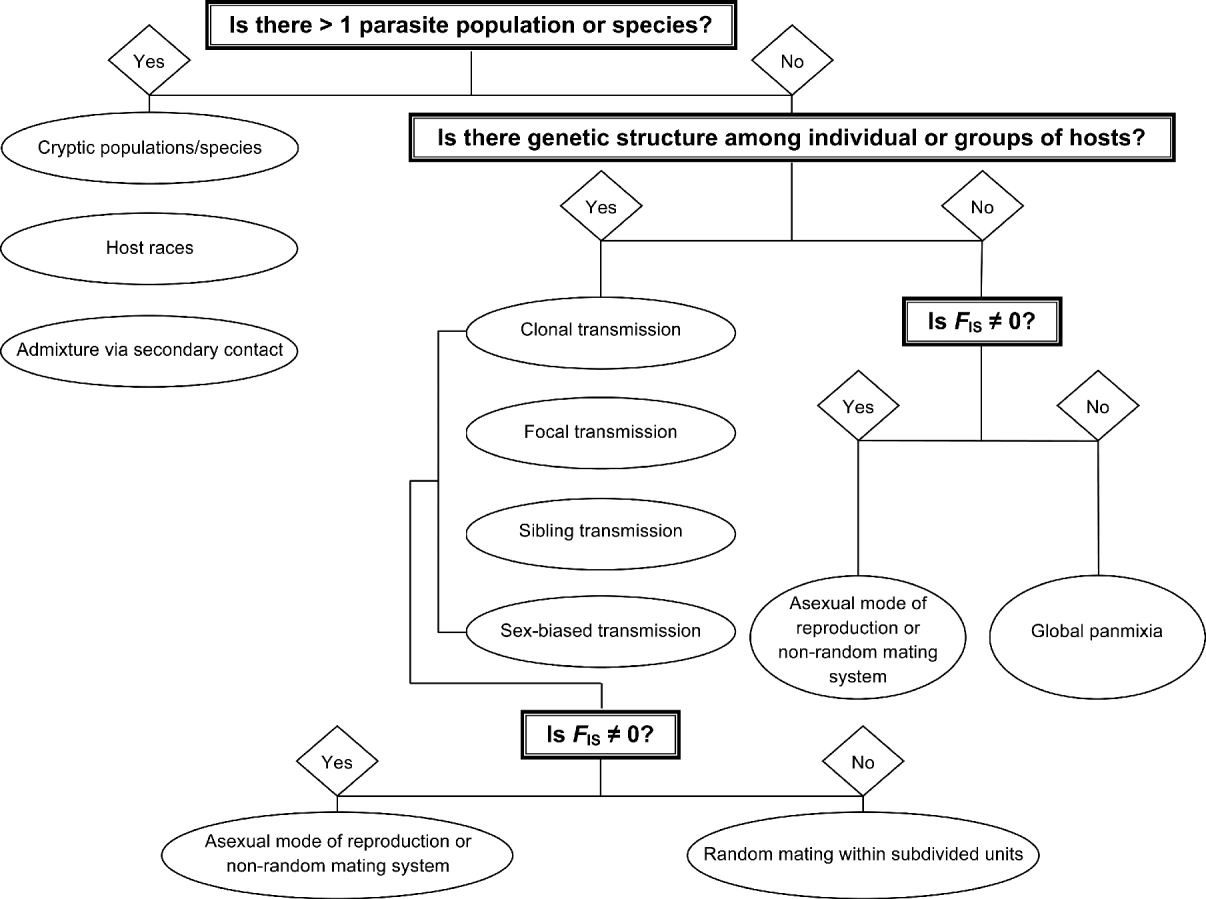
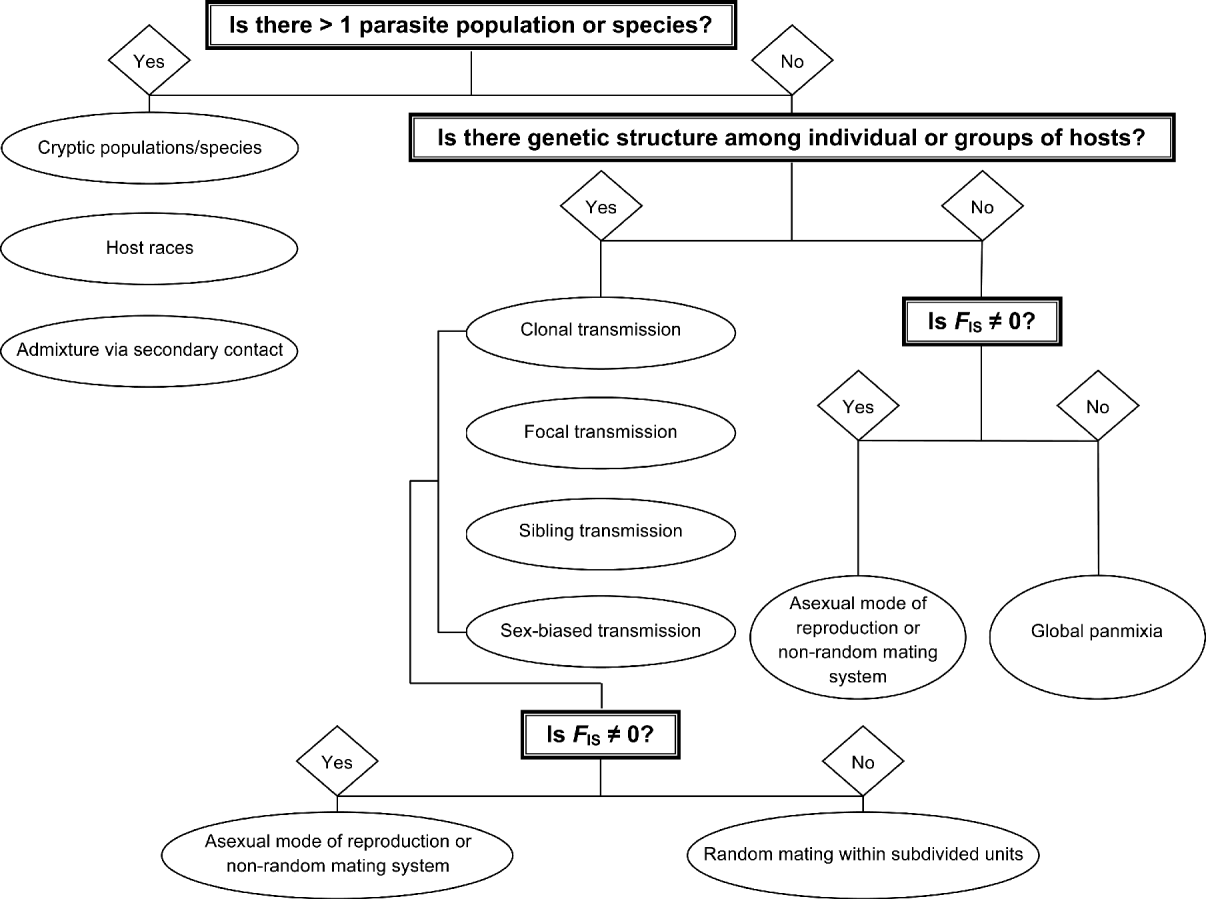
We present the review in a hierarchical approach starting at the top (Fig. 1) because if one fails to recognize any upper level structure, then inference at the lower levels will be confounded. For example, one might incorrectly conclude that deviations from panmixia occurred due to non-random mating among individuals within subpopulations when in reality, deviations from HWE occurred because of unrecognized cryptic species in the sample (i.e., the Wahlund effect). Figure 1 outlines 3 tiered questions to ask at the local scale: is there greater than 1 parasite population/species, is there genetic subdivision among infrapopulations within a host population, and is F IS ≠0 (i.e., is there asexual reproduction or a non-random mating system) within the lowest level of subdivided units? Although we present our review as 3 discrete tiers and as discrete categories within tiers, we recognize that there is likely a continuum in patterns of genetic structuring once panmixia is disrupted. Thus, analyses of F IS and F ST among loci are often conducted concurrently. Moreover, structuring events at one level may not be mutually exclusive of dynamics at another level (e.g., inbred organisms also tend to show high genetic subdivision among subpopulations; Charlesworth, Reference Charlesworth2003).
Outline of the 3 tiered questions (in bordered boxes) to ask when testing for panmixia in local-scale analyses of parasite populations. Ovals below the ‘Yes’ answers designate the potential reasons behind the observed deviations from panmixia and are addressed in detail within each subheading of the review. F IS quantifies the deviation from expected heterozygosity under Hardy-Weinberg equilibrium.
IS THERE MORE THAN 1 POPULATION/SPECIES?
It is critical to identify the boundaries of a parasite population to correctly infer the ecological dynamics of parasite populations, to understand host-parasite interactions and co-evolution, and to identify mechanisms influencing the within population mating system. Moreover, failure to recognize the presence of distinct parasite species may lead one to draw incorrect conclusions on parasite epidemiology (including control strategies), pathogenicity, biodiversity, and systematics (see Nadler and Pérez-Ponce de León, Reference Nadler and Pérez-Ponce de León2011). We present 3 scenarios in which the local-scale structure would be influenced by the presence of more than 1 parasite population/species: (1) limited morphological variation precludes species or population recognition, (2) infection of sympatric host species results in divergence between host-affiliated parasite populations, and (3) recognized parasite species/populations become admixed.
Cryptic populations/species
It is increasingly recognized that the limited morphological characteristics of many parasitic taxa can lead to an underestimation of the number of parasitic species (Pérez-Ponce de León and Nadler, Reference Pérez-Ponce de León and Nadler2010; Nadler and Pérez-Ponce de León, Reference Nadler and Pérez-Ponce de León2011; Poulin Reference Poulin2011). This underestimation is evident in studies that initially aimed to investigate the population genetics of a presumed single parasite species, but ended up discovering cryptic species (morphologically similar but genetically distinct). Below, we describe examples of such studies with emphasis on how deviations from panmixia revealed the cryptic species/populations.
Fixed allelic differences at allozyme loci led Renaud and Gabrion (Reference Renaud and Gabrion1988) and Reversat et al. (Reference Reversat, Renaud and Maillard1989) to conclude that there was more than 1 species in the taxon under investigation (cestode and digenean species, respectively). For example, at 2 loci with 2 alleles each, only homozygous individuals were observed among a sample of the presumed single cestode species Bothrimonus nylandicus (Renaud and Gabrion, Reference Renaud and Gabrion1988). These marine cestodes could be separated into 2 groups based on the homozygous genotypes (i.e., fixed alleles between species). Given the absence of heterozygotes in the 2 populations, they concluded that there was reproductive isolation between these morphologically indistinguishable groups (Renaud and Gabrion, Reference Renaud and Gabrion1988). A third locus with 2 alleles did show heterozygotes. Within the 2 designated groups, this locus was in HWE; however, a collective analysis of all samples showed significant reductions in heterozygotes (i.e., the Wahlund effect). Interestingly, both of these cryptic species can infect the same host species, but they show marked differences in their seasonal dynamics of infection. This latter result highlights how parasite ecology can easily be misinterpreted if one fails to recognize the presence of more than 1 species. Additional examples where fixed allelic differences have identified cryptic parasite populations are given in Nadler and Pérez-Ponce de León (Reference Nadler and Pérez-Ponce de León2011).
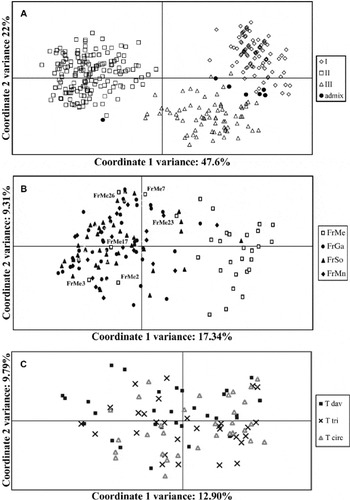
Depending on the molecular markers and the time since divergence, fixed allelic differences, may not always be found. As a consequence, additional patterns have been used to identify cryptic populations. For instance, in an allozyme study on the marine digenean Lecithochririum fusiforme, F IS values were highly variable across loci within infrapopulations and across infrapopulations for a given locus (Vilas et al. Reference Vilas, Paniagua and Sanmartin2003). The authors postulated that the Wahlund effect might explain this variation as an inbred mating system was unlikely to produce such extensive variation in F IS values among loci. This prediction was based on a qualitative correlation where allozyme loci with high average within-infrapopulation F IS also had high F ST among infrapopulations (see Criscione et al. Reference Criscione, Vilas, Paniagua and Blouin2011 for a discussion about what generates this pattern). Unfortunately, Vilas et al. (Reference Vilas, Paniagua and Sanmartin2003) could not test their hypothesis because the amount of tissue needed for allozyme typing precluded the ability to obtain multilocus genotypes (MLGs) for individual worms. Criscione et al. (Reference Criscione, Vilas, Paniagua and Blouin2011) revisited the system with microsatellite loci and observed the same patterns among loci as Vilas et al. (Reference Vilas, Paniagua and Sanmartin2003). This time, the ability to obtain MLGs enabled the use of individual-based Bayesian and multivariate clustering methods to test for cryptic population structure (Fig. 2A). Indeed, most of the deviations from panmixia (e.g., variable average within infrapopulation F IS and pairwise infrapopulation F ST) were driven by the presence of 3 cryptic populations (possibly species) that had variable and intermingled distributions across 12 sampled infrapopulations. A different approach led Grillo et al. (Reference Grillo, Jackson, Cabaret and Gilleard2007) to conclude there was a cryptic species of the nematode Teladorsagia circumcincta in their samples. Nematodes were collected from 4 French goat farms. Among 3 farms there was no genetic differentiation (F ST=0); however, the fourth farm was divergent from the other 3. A multivariate clustering method on the MLGs of individual worms demonstrated that this farm contained a mixture of mostly individuals of a cryptic species (as first suggested by sequence data in Leignel et al. Reference Leignel, Cabaret and Humbert2002) and a few individuals of the ‘standard’ T. circumcincta species (Fig. 2B).
Results from individual based Principle Coodinate Analyses (PCoA) used to test for possible underlying cryptic genetic strucuture in parasite populations. (A) PCoA revealed 3 clusters within a sample of trematodes (Lecithochririum fusiforme). Shapes correspond to the 3 cryptic populations identified by Bayesian cluster analyses. There is near complete agreement between the two analyses in the assignment of individuals to the 3 clusters. (B) Shapes correspond to the population of origin for Teladorsagia circumcincta collected from 4 French goat farms. Samples to the right of the figure separate out and represent the cryptic species. Notice that farm FrMe is largely composed of the cryptic species, but also has several worms that cluster with the ‘standard’ species. There was significant F ST between all comparisons of farm FrMe to the other 3 farms, but there was no genetic differentiation among the other 3 farms. (C) Shapes represent the 3 morphotypes of Teladorsagia circumcincta. Notice there is no underlying pattern of structure between the 3 groups, indicating a single species. All 3 studies used nuclear microsatellite markers. Figures were reproduced with permission from Criscione et al. (Reference Criscione, Vilas, Paniagua and Blouin2011); Grillo et al. (Reference Grillo, Jackson, Cabaret and Gilleard2007); and Grillo et al. (Reference Grillo, Craig, Wimmer and Gilleard2008), respectively.

The examples above highlight how limited morphology can inhibit species discovery. Conversely, extensive intraspecific morphological variation or environmentally induced (e.g., host environment) phenotypic plasticity may lead to the over-designation of species (Perkins et al. Reference Perkins, Martinsen and Falk2011). Tests of panmixia among morphotypes can be used to determine whether a species status is warranted. For example, Grillo et al. (Reference Grillo, Craig, Wimmer and Gilleard2008) found that 3 sympatric morphological variants in the nematode genus Teladorsagia (previously recognized as 3 species) did not show genetic differentiation among one another (Fig. 2C), thus indicating that the 3 morphotypes were of the same species.
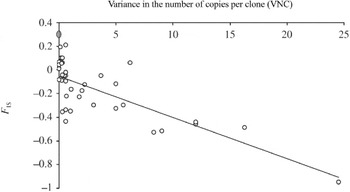
Relationship between the variance in the number of copies per clone (VNC) observed in natural infrapopulations of Schistosomes mansoni and F IS. Notice that as VNC increases F IS becomes more negative. VNC was used as a proxy for the variance in reproductive success of clones. Infrapopulations where only 1 clone was present were omitted from this data set because it is not possible to compute VNC for such infrapopulations (see Prugnolle et al. Reference Prugnolle, Roze, Theron and de Meeûs2005b). Reproduced with permission from Prugnolle et al. (Reference Prugnolle, Roze, Theron and de Meeûs2005b).

Host races
Many parasites can exploit more than 1 host species at a given developmental stage in their life cycle. When a panmictic parasite population becomes subjected to 2 or more sympatric host species, host-race associated subpopulations may evolve. Genetic subdivision among parasites in different host species could arise through extrinsic (e.g., ecological separation of life cycles) or intrinsic (e.g., host-induced selection against hybrid parasites) mechanisms (McCoy, Reference McCoy2003). Tests of parasite panmixia among multiple sympatric host species can help determine whether a presumed generalist parasite actually shows some degree of host affiliation.
In a series of publications centred on a seabird-tick system, McCoy and colleagues (McCoy et al. Reference McCoy, Boulinier, Tirard and Michalakis2001, Reference McCoy, Chapuis, Tirard, Boulinier, Michalakis, Le Bohec, Le Maho and Gauthier-Clerc2005; Kempf et al. Reference Kempf, Boulinier, de Meeûs, Arnathau and McCoy2009) determined the presence of morphologically indistinguishable, but genetically distinct tick subpopulations that were associated with different seabird host species in sympatry. Host-associated patterns were originally detected by comparing F ST between ticks (Ixodes uriae) on sympatric host species with F ST between allopatric populations of the same host species. They found that ticks infecting the same avian host species in allopatric habitats were more genetically similar to one another than ticks occupying different host species within the same habitat (McCoy et al. Reference McCoy, Boulinier, Tirard and Michalakis2001). Subsequent studies demonstrated that this pattern of host race formation occurred multiple times and in different hemispheres, and is likely a recent phenomenon (McCoy et al. Reference McCoy, Chapuis, Tirard, Boulinier, Michalakis, Le Bohec, Le Maho and Gauthier-Clerc2005; Kempf et al. Reference Kempf, Boulinier, de Meeûs, Arnathau and McCoy2009). Experimental host transplantations suggest these ticks have a quick local adaptive response, and thus may explain the recurrent host-race formation patterns (McCoy et al. Reference McCoy, Boulinier, Schjorring and Michalakis2002). Testing for deviations from panmixia has important epidemiological implications as these ticks are a vector for Lyme disease. Indeed, it was found that the different tick races had different infection intensities of bacteria of the Borrelia burgdorferi s.l. complex. After accounting for these differences among tick races, the overall estimated prevalence of the bacterial pathogen was higher than previously suspected (Gomez-Diaz et al. Reference Gomez-Diaz, Doherty, Duneau and McCoy2010). A similar rapid host-associated (deer and cattle) divergence pattern was detected for the cattle tick Rhipicephalus microplus (de Meeûs et al. Reference de Meeûs, Koffi, Barre, de Garine-Wichatitsky and Chevillon2010). In this study, F ST based analyses coupled with genetic effective population size estimates and tests of population bottlenecks confirmed that the cattle tick was introduced to New Caledonia after the introduction of deer. Thus, the differentiation between ticks on cattle and deer had occurred in as few as 244 tick generations (de Meeûs et al. Reference de Meeûs, Koffi, Barre, de Garine-Wichatitsky and Chevillon2010).
Tests of parasite panmixia among host species also have an important epidemiological application for human parasites. For example, there is always concern that human parasites could be maintained in non-human hosts, such that these non-human hosts serve as a recurrent source (i.e., reservoir) of new parasite infections. Tests of genetic differentiation between human and non-human collected parasites can address whether non-human hosts are serving as reservoir hosts. In the Philippines, Rudge et al. (Reference Rudge, Carabin, Balolong, Tallo, Shrivastava, Lu, Basanez, Olveda, McGarvey and Webster2008) carried out such tests with the blood fluke Schistosoma japonicum and found no evidence of parasite genetic structure between humans and dogs. Thus, they concluded that future control programmes should account for transmission among dogs as well as humans. In contrast, similar studies in China revealed variable patterns in which some villages showed low but significant differentiation while others showed no differentiation among human and non-human hosts (rodents, dogs, cattle). Thus, in some villages rodents, dogs, and cattle may be reservoir hosts (Rudge et al. Reference Rudge, Lu, Fang, Wang, Basanez and Webster2009). A related question of whether domestic (sheep) or sylvatic (macropods) intermediate hosts of Echinococcus granulosus harboured separate strains of the parasite was addressed by Lymbery et al. (Reference Lymbery, Thompson and Hobbs1990). There was no genetic differentiation among parasites from intermediate hosts in sympatry.
Admixture via secondary contact
Above, we focused on addressing whether a presumed single parasite population was composed of cryptic species or host-associated populations. Here, we address studies that ask if there is potential secondary contact between 2 recognized parasite species/populations. Given there is secondary contact, an additional question of interest is whether this secondary contact leads to hybridization and possibly panmixia (i.e., homogenization) among the recognized parasite populations/species.
In Wielgoss et al. (Reference Wielgoss, Hollandt, Wirth and Meyer2010), the potential for admixed parasite populations due to re-stocking of the eel host was tested. A previous analysis of geographical structure of the eel nematode Anguillicola crassus found significant genetic structure among 15 sampled locations in Europe (Wielgoss et al. Reference Wielgoss, Taraschewski, Meyer and Wirth2008). This genetic divergence should therefore enable one to detect deviations from panmixia in a population where nematodes were introduced via eel re-stocking. Indeed, in a stream with natural eel recruitment, HWE was observed in the nematode population. In contrast, in a river with a history of re-stocking, there was significant positive F IS, which could be driven by the admixture of genetically diverged nematode populations (i.e., the Wahlund effect). The hypothesis of admixture of nematode populations was supported via genetic assignment tests that provided evidence of first-generation migrant nematodes mixed among local population nematodes.
Relative to free-living organisms, hybridization studies among metazoan parasites have not received extensive attention (Detwiler and Criscione, Reference Detwiler and Criscione2010). The potential for gene introgression between the 2 populations/species is significant especially in relation to the potential for the introgression of novel host infectivity genes or genes that may play a role in drug-resistance evolution (Barton, Reference Barton2001). We are aware of only 2 studies that used co-dominant markers to test for contemporary hybridization in sympatric populations. Sympatric populations of Schistosoma mansoni (blood fluke of humans) and S. rodhaini (blood fluke of rodents) were not panmictic, but rather showed high genetic divergence (Steinauer et al. Reference Steinauer, Hanelt, Mwangi, Maina, Agola, Kinuthia, Mutuku, Mungai, Wilson, Mkoji and Loker2008). Nonetheless, Bayesian clustering analyses with microsatellites confirmed contemporary hybridization where introgression appears asymmetric going from S. rodhaini to S. mansoni. The other example of contemporary hybridization is between human and pig-associated populations (which also show strong divergence) of roundworms (traditionally referred to as Ascaris lumbricoides and A. suum, respectively) (Criscione et al. Reference Criscione, Anderson, Sudimack, Peng, Jha, Williams-Blangero and Anderson2007). Bayesian clustering methods revealed hybridization in sympatric populations within both Guatemala and China. These studies on Ascaris and Schistosoma highlight the epidemiological importance of panmixia tests in parasites with secondary contact. For instance, the results of both these studies indicate that although there is genetic divergence, there is still some contemporary interbreeding. Therefore, there is necessarily recent cross-transmission among host species.
IS THERE GENETIC STRUCTURE AMONGST INDIVIDUAL OR GROUPS OF HOSTS?
A common life-cycle feature among many metazoan parasites is that breeding adults are subdivided among infrapopulations (i.e., definitive hosts). The adults release offspring (eggs or larvae) from the definitive host into the external environment and, in general, do not multiply within or on their definitive host (Hudson et al. Reference Hudson, Rizzoli, Grenfell, Heesterbeek and Dobson2002). If transmission leads to a large mixing or dispersal of parasite offspring before infection of definitive hosts, then adult parasites will be randomly distributed among infrapopulations (i.e., F ST among hosts will be 0). However, non-random transmission among individual or groups of hosts will cause a disruption of panmixia (F ST among hosts significantly > 0) (Criscione and Blouin, Reference Criscione and Blouin2005, 2006).
Testing for significant genetic structure among individual hosts is important for 2 reasons. First, the direct observation of parasite dispersal among individual hosts is nearly impossible. Tests for random transmission amongst hosts, however, provide an indirect means to infer the degree of mixing and the factors influencing among-host dispersal itself. Second, disruption of panmixia due to non-random transmission has evolutionary consequences for parasite populations. For example, under HWE the frequency of a rare homozygous genotype is q 2. However, Wright's (Reference Wright1969) models of population structure show that the overall frequency of a rare homozygous genotype approaches the higher frequency of q rather than q 2 when populations become subdivided. Indeed, this conclusion was supported by transmission simulations of Cornell et al. (Reference Cornell, Isham, Smith and Grenfell2003) wherein parasite offspring from individual infrapopulations were transmitted as a clumped unit (i.e., there was no mixing of offspring amongst infrapopulations) over multiple parasite generations. This increase in the frequency of the rare homozygous parasite genotype across the host population has critical implications for the evolution of drug-resistance (Cornell et al. Reference Cornell, Isham, Smith and Grenfell2003). In this section, we first discuss factors that may promote random transmission and then we examine 4 mechanisms that can generate non-panmictic dynamics amongst individual or groups of hosts of a single host population: clonal transmission, focal transmission, sibling transmission, and sex-biased transmission.
Random versus non-random transmission
How well parasite offspring are mixed during transmission will be influenced by such factors as host behaviour (e.g., territoriality), transmission environment (terrestrial vs aquatic), parasite life-cycle patterns, and the dispersal ability of free-living stages. In particular, complex life cycles, wherein the parasite transitions through several intermediate hosts before reaching sexual maturity in a definitive host, may increase the opportunity for mixing. There is likely to be a continuum among metazoan parasites along which various transmission processes lead to different levels of genetic differentiation among infrapopulations of a given host population. On one end of the continuum, Criscione and Blouin (Reference Criscione and Blouin2006) hypothesized that aquatic species with several intermediate hosts will have panmictic structure among infrapopulations (i.e., the aquatic mixing hypothesis). The logic being that the aquatic environment is conducive to parasite offspring dispersal whether as a free-living stage or during infection of an intermediate host. For instance, panmixia among hosts was observed in the freshwater digenean Plagioporus shawi, which cycles from an aquatic snail to an arthropod intermediate host to a fish definitive host (Criscione and Blouin, Reference Criscione and Blouin2006). On the other end of the continuum, parasites that have direct life cycles and require physical contact between definitive hosts for transmission have limited opportunity for offspring mixing (Nadler, Reference Nadler1995). Indeed, significant genetic structure (F ST=0·092) was observed among pocket gopher infrapopulations for the chewing louse (Geomydoecus actuosi), which can have multiple generations on a single host (Nadler et al. Reference Nadler, Hafner, Hafner and Hafner1990).
It is important to note that to infer transmission among hosts one must sample the developmental stage that infects the host. Thus, to infer transmission among definitive hosts, adult parasites should be sampled. Unfortunately, in some parasites like human blood flukes (Schistosoma spp.), adult flukes cannot be sampled. As an alternative, fluke eggs have been used as the sampling unit. For example, Agola et al. (Reference Agola, Steinauer, Mburu, Mungai, Mwangi, Magoma, Loker and Mkoji2009) detected significant F ST for S. mansoni among 12 children in a localized area of Kenya. However, this structure could be due to the sampling of sibling parasites because parasite eggs were collected from individual hosts. As siblings share alleles, sib-sampling (Table 1) can distort the allele frequencies of the actual adult parasites that colonized the individual hosts (Criscione et al. Reference Criscione, Poulin and Blouin2005). Thus, one may falsely conclude there was non-random transmission among infrapopulations. For a thorough discussion on sib-sampling, we refer readers to Steinauer et al. (Reference Steinauer, Blouin and Criscione2010). One way to remove this effect is to do a hierarchical F-statistical analysis with infrapopulations nested in some higher level unit of substructure. Such an analysis still does not enable interpretation of F ST among infrapopulations, but may allow for inference at higher levels of substructure.
Clonal transmission
Some metazoan parasites (digeneans and Echinococcus cestodes) have an obligate larval asexual and obligate adult sexual phase in their development. Thus, for these parasites, it is also of interest to discuss the mixing potential of identical clones (clonemates) from the asexual phase to the adult phase in definitive hosts. Clumped clonal transmission can have a profound effect on genetic structure among infrapopulations. The theoretical work of Prugnolle Reference Prugnolle, Roze, Theron and de Meeûset al. (2005a,Reference Prugnolle, Theron, Durand and de Meeûsb) shows that as the variance in reproductive success among larval clones increases in an intermediate host, so does genetic differentiation (F ST) among infrapopulations in subsequent intermediate or definitive hosts. The latter holds true if there is not complete mixing from the host with asexual parasite reproduction to subsequent hosts (i.e., m 2 ≠ 1; see Prugnolle et al. Reference Prugnolle, Liu, de Meeûs and Balloux2005a). Moreover, Prugnolle et al. (Reference Prugnolle, Liu, de Meeûs and Balloux2005a) stated that when using genetic differentiation among definitive hosts to infer offspring dispersal from definitive host to the host where there is asexual reproduction (i.e., m 1), multiple copies of a clone need to be reduced to a single representative within each definitive host. For methods to test whether repeated MLGs represent true clonemates, we refer readers to Gregorius (Reference Gregorius2005) and Arnaud-Haond et al. (Reference Arnaud-Haond, Duarte, Alberto and Serrao2007).
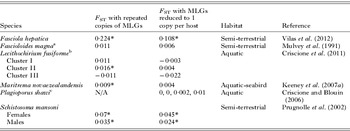
Studies to date largely support the aquatic mixing hypothesis in that the variance in clonal reproductive success tends to be low in digeneans with full aquatic transmission or transmission involving open water systems (rivers, oceans) and bird definitive hosts. In part, this is due to the fact that few repeated copies of a clone have been found. Adult samples of Plagioporus shawi from salmon yielded 99% to 100% of unique clones among genotyped individuals (Criscione and Blouin, Reference Criscione and Blouin2006). Thus, clonal reproductive success had no effect on among-host genetic differentiation. Among the 3 cryptic clusters identified with adult samples of Lecithochirium fusiforme from eels, the percentage of truly unique clones among genotyped individuals was 97%, 89%, and 95% for Clusters I, II, and III, respectively (Criscione et al. Reference Criscione, Vilas, Paniagua and Blouin2011). Only in Cluster II was F ST among infrapopulations significant due to the presence of repeated clones within hosts (Table 2). Other studies have been conducted at the second intermediate host level and reported values of 97% for Diplostomum pseudospathaceum in sticklebacks (Rauch et al. Reference Rauch, Kalbe and Reusch2005), 98% in Gymnophallus sp. in cockles (Leung et al. Reference Leung, Poulin and Keeney2009), and 97% and 98% for Maritrema novaezealandensis in crabs and amphipods, respectively (Keeney et al. Reference Keeney, Waters and Poulin2007a,Reference Keeney, Waters and Poulinb). Keeney et al. (Reference Keeney, Waters and Poulin2007a) observed that crabs were occasionally infected by multiple copies of a clone, and this resulted in significant genetic differentiation among hosts (Table 2). However, they discussed that additional mixing to bird definitive hosts is likely to reduce the effect of clonal variance in reproductive success. For the above-mentioned aquatic trematodes (all of which require 3 or more hosts in their life cycle), when repeated clones are removed, genetic differentiation among hosts is no longer observed (Table 2). Thus, there is substantial mixing of parasite offspring prior to their asexual stage in the mollusk first intermediate host.
Impact of clonal transmission on F ST among digenean infrapopulations when copies of multilocus genotypes (MLGs) are included or reduced to one copy within a host

| Species | F ST with repeated copies of MLGs | F ST with MLGs reduced to 1 copy per host | Habitat | Reference |
| Fasciola hepatica | 0·224* | 0·108* | Semi-terrestrial | Vilas et al. (Reference Vilas, Vázquez-Prieto and Paniagua2012) |
| Fascioloides magna a | 0·011 | 0·006 | Semi-terrestrial | Mulvey et al. (Reference Mulvey, Aho, Lydeard, Leberg and Smith1991) |
| Lecithochirium fusiforme b | Aquatic | Criscione et al. (Reference Criscione, Vilas, Paniagua and Blouin2011) | ||
| Cluster I | 0·011 | −0·003 | ||
| Cluster II | 0·016* | 0·004 | ||
| Cluster III | −0·011 | −0·022 | ||
| Maritrema novaezealandensis | 0·009* | 0·004 | Aquatic-seabird | Keeney et al. (Reference Keeney, Waters and Poulin2007a) |
| Plagioporus shawi c | N/A | 0, 0, 0·002, 0·01 | Aquatic | Criscione and Blouin (Reference Criscione and Blouin2006) |
| Schistosoma mansoni | Semi-terrestrial | Prugnolle et al. (Reference Prugnolle, de Meeûs, Durand, Sire and Theron2002) | ||
| Females | 0·07* | 0·045* | ||
| Males | 0·035* | 0·024* |
a Analyses not based on actual data, but on re-sampling simulations. Also, analyses are for among deer hunt units and not among infrapopulations (Mulvey et al. Reference Mulvey, Aho, Lydeard, Leberg and Smith1991). Test of significance was not applicable in their simulations. Actual observed F ST among hunt units was 0·016.
b Analyses conducted separately for the 3 cryptic clusters identified in the sample (Criscione et al. Reference Criscione, Vilas, Paniagua and Blouin2011).
c Among host structure was tested in 2 geographical populations and 2 time periods (4 population samples), hence four F ST values are reported. Only one pair of flukes was identified as clonemates, so there was no variation in clonal reproductive success to impact among-infrapopulation genetic structure.
* Denotes significant genetic differentiation among infrapopulations.
We are unaware of any examples where clonal transmission has been examined in fully terrestrial systems, but there are 3 examples from semi-terrestrial life cycles. Among rat hosts in marsh habitats, the percentage of unique clones was 80 to 85% in Schistosoma mansoni (Prugnolle et al. Reference Prugnolle, de Meeûs, Durand, Sire and Theron2002, Reference Prugnolle, Choisy, Theron, Durand and de Meeûs2004a). The removal of repeated clone copies for both male and female worms reduced F ST among hosts, but F ST still remained significant (Table 2). In this 2-host life cycle, cercariae of S. mansoni are released from snails into shallow pools and directly penetrate the rat host. Therefore, a clumped transmission of clones may be likely if a rat remains temporarily stationary in a wet area. Furthermore, eggs of trematodes having terrestrial definitive hosts may often be deposited into a habitat unsuitable for transmission, thereby potentially causing greater reproductive skew among infrapopulations and low mixing potential of parasite offspring from rat to snail hosts. Similarly, clonal transmission was important for Fasciola hepatica (the percentage of unique clones was 0·577). F ST amongst sheep infrapopulations on a farm was reduced after removing clones indicating clumped clonal transmission. However, F ST remained significant after clone removal, thus indicating non-random transmission from definitive to snail hosts (Vilas et al. Reference Vilas, Vázquez-Prieto and Paniagua2012). Like F. hepatica, Fascioloides magna also has a 2-host life cycle going from an aquatic snail to cercariae encysting on vegetation to a deer final host. Thus, it is likely that a deer host will ingest a clump of metacercariae consisting of many copies of the same clone. Indeed, Mulvey et al. (Reference Mulvey, Aho, Lydeard, Leberg and Smith1991) found several deer that had more repeated MLGs than expected by chance. Amongst infrapopulations F ST was not estimated, but simulations showed that F ST amongst geographical hunt units was largely affected by the presence of repeated copies of clones. It would be interesting to test fully terrestrial parasites such as in Echinococcus or Dicrocoelium dendriticum to determine whether they too have clumped clonal transmission.
Focal transmission
One cause of non-random transmission is the presence of largely independent foci of infection among host groups in the host population. Such foci can lead to the partitioning of parasite genetic variation amongst infrapopulations. For example, if different groups of hosts had site fidelity to separate water sources and if parasite transmission occurred only in contact with water, then there is potential to have limited parasite gene flow amongst the different infection foci. Over several parasite generations, the infection foci would become genetically and demographically subdivided even in the presence of a panmictic host population.
Because parasite dispersal is almost impossible to observe directly, it is necessary to use population genetic methods to identify foci of transmission. Testing for foci of infection is of critical epidemiological importance especially with regards to transmission models that are used to evaluate control strategies. While classic models of transmission incorporate transmission heterogeneities such as different probabilities for individual host infection, they assume a single transmission unit (implicit in the measure of a single basic reproduction number, R 0) for a single human population. Stemming from these models is the 20/80 rule (20% host population is responsible for 80% transmission), which implies targeted treatment of the heavily infected can greatly reduce transmission (Woolhouse et al. Reference Woolhouse, Dye, Etard, Smith, Charlwood, Garnett, Hagan, Hii, Ndhlovu, Quinnell, Watts, Chandiwana and Anderson1997, Reference Woolhouse, Etard, Dietz, Ndhlovu and Chandiwana1998). Recent models indicate that if separate parasite populations exist in an interconnected network, then targeting high intensity infections may not improve effectiveness of control (Gurarie and Seto, Reference Gurarie and Seto2009). Thus, it is important to test whether a single host population corresponds to a single parasite transmission unit.
Jones and Britten (Reference Jones and Britten2010) tested whether social colonies of the black-tailed prairie dog corresponded to focal points of transmission for the flea Oropsylla hirsute. No genetic structure was observed amongst colonies. The authors postulate that the use of multiple mammal species may contribute to dispersal. It is also important to note that in contrast to lice, fleas do not need to spend their entire life on a single host (compare to the louse genetic structure results of Nadler et al. Reference Nadler, Hafner, Hafner and Hafner1990). Continuity in habitat may also limit focal transmission. For instance, amongst 5 locations of an 1800 km2 region of Lake Victoria, cercarial samples of S. mansoni did not show any genetic structure (Steinauer et al. Reference Steinauer, Hanelt, Agola, Mkoji and Loker2009). These results suggest that this continuous portion of the lake is a single source pool of infection. In contrast to the above studies, others have provided evidence for potential foci of infection. In a Brazilian village (∼60 km2) that lined a river drainage system, hierarchical F-statistical analyses revealed significant structure among hamlets (Thiele et al. Reference Thiele, Sorensen, Gazzinelli and Minchella2008). On a similar scale, the tick Ixodes uriae had significant F ST between topographical features on the breeding cliffs of the Black-legged kittiwake (McCoy et al. Reference McCoy, Tirard and Michalakis2003).
The above studies test a priori delimited boundaries to determine whether they represent foci of infection within a host population. However, incorporation of molecular data into a landscape genetics framework can provide more detailed information on epidemiological correlates of the transmission process and can identify source pools of infection. The latter approach was used by Criscione et al. (Reference Criscione, Anderson, Sudimack, Subedi, Upadhayay, Jha, Williams, Williams-Blangero and Anderson2010) to examine the epidemiology of human roundworms (A. lumbricoides) in Jiri, Nepal. In this study, Bayesian clustering methods, which test for underlying structure based on HWE, were first used to determine whether there were non-panmictic dynamics at a very small scale (14 km2). There was strong support for local-scale genetic structuring. The results of the population clustering analyses were subsequently incorporated into multivariate regression methods to elucidate spatial, geographical, or epidemiological features associated with the partitioning of genetic variation in the sampled worms. These analyses revealed 3 key insights into Ascaris transmission in Jiri: there were separate foci of transmission at this local scale, households and nearby houses shared genetically related parasites, and people re-acquired their worms from the same source pool of infection over time. These results (along with those from Thiele et al. Reference Thiele, Sorensen, Gazzinelli and Minchella2008) challenge the dogma that a single human community will correspond to a homogenous parasite population. Thus, in Jiri, multiple source pools of infection need to be considered when modelling parasite transmission, especially in relation to modelling drug treatment control strategies (Criscione et al. Reference Criscione, Anderson, Sudimack, Subedi, Upadhayay, Jha, Williams, Williams-Blangero and Anderson2010).
Sibling transmission
We make a distinction between focal transmission where multiple parasite generations are cohesively cycled at a given source point of host infection to that of sibling transmission where parasite offspring are transmitted as a clump within a single life-cycle round. Focal transmission may certainly lead to sibling transmission. Nonetheless, we discuss sibling transmission as a separate mechanism for creating non-panmixia among infrapopulations as sibling transmission does not need to be tied to a specific spatial point of infection and its effects may be a transient phenomenon depending on local parasite population sizes and infection intensities. The significance of sibling transmission is that matings between relatives may increase if siblings are co-transmitted, thus leading to non-random mating dynamics within hosts (i.e., bi-parental inbreeding) (see Mating systems). Please note that our reference to sibling transmission should not be confused with the issue of statistical artifacts generated by sib-sampling (as was discussed above, Table 1). Here we are concerned with studies that specifically test for related parasites within their samples.
An excellent example of sibling transmission is provided by Guzinski et al. (Reference Guzinski, Bull, Donnellan and Gardner2009) where the within-host relatedness at each of 3 stages (larval, nymph, and adult) of the tick Bothriocroton hydrosauri was analysed. Female ticks deposit their egg clutch in a lizard refuge and the larvae remain clustered until a suitable lizard host is encountered. After a host is infected, engorged ticks detach over a number of days and possibly over multiple refuges. This process is repeated over subsequent developmental stages. Thus, the authors hypothesized that within-host relatedness of ticks should decrease over successive developmental stages. Indeed, this was the observed result, thereby illustrating how population genetics data can provide insight into the transmission process. The authors also indicate that sibling transmission can lead to inbreeding by showing that F IS was significantly positive over all sampled adults; however, genetic structuring among infrapopulations will also contribute to this F IS (i.e., the Wahlund effect). Thus, it would be more appropriate to partition the genetic structuring to estimate the average within-host F IS and among-host F ST to elucidate the effects of sibling transmission.
Sibling cohorts have also been implicated as causing significant F IS within hosts in the ticks Rhipicephalus microplus and Ixodes texanus (Koffi et al. Reference Koffi, de Meeûs, Barre, Durand, Arnathau and Chevillon2006; Chevillon et al. Reference Chevillon, Koffi, Barre, Durand, Arnathau and de Meeus2007; Dharmarajan et al. Reference Dharmarajan, Beasley and Rhodes2011). In these studies, no structure among infrapopulations was detected. However, Bayesian clustering (Chevillon et al. Reference Chevillon, Koffi, Barre, Durand, Arnathau and de Meeus2007) or parentage analyses (Dharmarajan et al. Reference Dharmarajan, Beasley and Rhodes2011) indicated that different sibling groups resulting from a strong variance in the reproductive success of females (i.e., a high variance in the number of sibs from a few clutches) might be present within the sample of ticks. Thus, to cause a positive F IS within hosts, there must be admixed sibling groups on individual hosts where the mean sib-group size would have to be at least greater than 2 (the value assumed when modelling the genetics of ideal panmictic populations; e.g., Crow and Denniston, Reference Crow and Denniston1988). Dharmarajan et al. (Reference Dharmarajan, Beasley and Rhodes2011) reported a mean sib-group size of 2 for all tested samples and stated that parentage analyses “regularly pooled individual ticks from different infrapopulations (<5% individuals within kin groups being from a single host).” These results indicate there was no admixture in infrapopulations, thus it remains unclear as to why there is positive within-host F IS for I. texanus. Chevillon et al. (Reference Chevillon, Koffi, Barre, Durand, Arnathau and de Meeus2007) did not give the among-host distribution of the potential sib-groups, but additional tests suggested that the positive F IS was not due to non-random mating on hosts (see section on Mating systems below). They suggest that additional work is needed to verify the accuracy of Bayesian clustering methods to identify sibling groups.
Overall there has not been extensive work testing for sibling transmission in different environments or parasites with different life cycles. The largely panmictic dynamics detected in aquatic systems (see sections on Clonal transmission and Mating systems) indicate that co-transmission of parasite siblings is rare in aquatic systems. Similarly, in a semi-terrestrial system, Steinauer et al. (Reference Steinauer, Hanelt, Agola, Mkoji and Loker2009) showed that S. mansoni cercariae from co-infected snails were not more or less related than expected by the background levels of relatedness. It will be interesting to explore the potential for sibling transmission to definitive hosts in terrestrial flatworm systems such as tapeworms that release sibling offspring as clumps via intact gravid proglottids.
Sex-biased transmission
Amongst dioecious parasites, sex-biased transmission can lead to sex-specific genetic structure among individual hosts (Prugnolle et al. Reference Prugnolle, Durand, Theron, Chevillon and de Meeûs2003). Variation in the dispersal potential of free-living stages, in host use, or immunological interaction with hosts may induce differences in the transmission patterns between male and female parasites (Prugnolle et al. Reference Prugnolle, Durand, Theron, Chevillon and de Meeûs2003). Thus, tests of sex-specific genetic structure can help elucidate whether epidemiological studies need to consider males and females separately. Moreover, sex-biased dispersal may have evolutionary significance as a means of avoiding inbreeding, reducing local mate competition (e.g., the sex with higher mate competition disperses more) or reducing local resource competition (Prugnolle and de Meeûs, Reference Prugnolle and de Meeûs2002). Also, in small populations, a difference in parental male and female allele frequencies increases offspring heterozygosity (and hence, a negative F IS in a sample of offspring) (Balloux, Reference Balloux2004), which may have evolutionary and epidemiological significance in a host-parasite arms race (Prugnolle et al. Reference Prugnolle, Durand, Theron, Chevillon and de Meeûs2003). For a review on methods to infer sex-biased dispersal see Prugnolle and de Meeûs (Reference Prugnolle and de Meeûs2002).
Prugnolle et al. (Reference Prugnolle, de Meeûs, Durand, Sire and Theron2002) tested for sex-biased dispersal with S. mansoni among rat infrapopulations and found that males were significantly more randomly distributed among definitive hosts than females. Building off of that study, Prugnolle et al. (Reference Prugnolle, Choisy, Theron, Durand and de Meeûs2004a) found that female clones that were more heterozygous were more common than expected by chance. This in part explained why females were more structured than males as this correlation was not observed in males. Further, after only including single copies of clones in the dataset, there was still a sex difference in among-infrapopulation genetic structure (see Prugnolle et al. (Reference Prugnolle, de Meeûs, Durand, Sire and Theron2002) for discussion of possible mechanisms generating this pattern). Sex-biased dispersal with the males dispersing more has also been observed in the tick Ixodes ricinus (de Meeûs et al. Reference de Meeûs, Beati, Delaye, Aeschlimann and Renaud2002; Kempf et al. Reference Kempf, McCoy and de Meeûs2010). Though this study was amongst geographical populations and not infrapopulations, we mention it as it is the only other known parasite example of sex-biased genetic structure. The authors suggest that maybe male ticks use more vagile hosts than female ticks. Other studies have tested for sex-biased genetic structure, but have not detected it or have not found overwhelming support (tick R. microplus, Koffi et al. Reference Koffi, de Meeûs, Barre, Durand, Arnathau and Chevillon2006; tick Dermacentor variabilis, Dharmarajan et al. Reference Dharmarajan, Beasley and Rhodes2010; roundworm A. lumbricoides, Criscione, unpublished observations).
IS F IS ≠ 0?
At the lowest tier in Fig. 1, tests of panmixia are used to understand the mating interactions, or lack thereof, among individuals. Within-host estimates of F IS provide an indirect means to infer the mode of reproduction (sexual vs asexual) and/or mating system (mechanism of gamete union) of the preceding adult generation (Table 1). Metazoan parasites display a wide diversity of reproductive modes including asexual or sexual, alternating sexual and asexual, and a mix of asexual and sexual (de Meeûs et al. Reference de Meeûs, Prugnolle and Agnew2007b). Further, there are monoecious (i.e., hermaphroditic) and dioecious species, even within a phylogenetically related group (e.g., Platyhelminthes). Thus, there are many opportunities for deviations from panmixia due to different mating systems or modes of reproduction among metazoan parasites. However, few parasite population genetics studies of metazoans have had the sole purpose of determining the mode of reproduction or mating system nor have many studies attempted to understand the underlying factors that influence the mode of reproduction or mating system in nature.
Mode of reproduction
Asexual reproduction will generate an excess of heterozygotes and thus drive F IS to negative values (Prugnolle et al. Reference Prugnolle, Liu, de Meeûs and Balloux2005a,Reference Prugnolle, Theron, Durand and de Meeûsb; de Meeûs et al. Reference de Meeûs, Lehmann and Balloux2006). Two theoretical models have been used to understand the effects of asexual reproduction on the population genetics of clonal diploids. In the first model, Balloux et al. (Reference Balloux, Lehmann and de Meeûs2003) considered monoecious organisms that, as adults, reproduce asexually with probability c and sexually with probability 1− c. Their model demonstrated that very high rates of asexual reproduction led to negative F IS. Low levels of sexual reproduction caused F IS to become zero; nevertheless, such low levels of sex still greatly increased the variance in F IS among loci. Although not exactly the same, the life cycle of the nematode Strongyloides ratti approximates this model. Parthenogenetic females infect rat hosts and produce eggs that are introduced into the environment via the host's feces. These eggs may (1) develop into males and females that mate outside the host to produce infective larvae (heterogonic development), or (2) develop directly into infective female larvae (homogonic development). Thus, a certain proportion of adults will reproduce sexually and the others asexually as in the model of Balloux et al. (Reference Balloux, Lehmann and de Meeûs2003). In studies to understand dispersal of S. ratti, Fisher and Viney (Reference Fisher and Viney1998) and Paterson et al. (Reference Paterson, Fisher and Viney2000) sampled parasite eggs from hosts and genotyped larvae at 2 allozyme loci. They found that the average within-host F IS was negative, and that F ST was significant among hosts (Paterson et al. Reference Paterson, Fisher and Viney2000). However, this is a case where the effects of clonemate-sampling (analogous to sib-sampling discussed in Random vs non-random transmission, Table 1) should be considered. The negative F IS in the larval sample is likely to be driven by the sampling of many clonal larvae originating from the parasitic parthenogenetic females. The sampling of many offspring that are clone-mates will result in infrapopulation allele frequency estimates that will be different from the true allele frequencies among the female worms that actually colonized the hosts. Thus, the estimated F ST among infrapopulations is likely to be incorrect. In the UK, it was estimated that homogonic development predominates (Fisher and Viney, Reference Fisher and Viney1998, and references therein). It would be interesting to directly genotype the adult worms from rodents to determine whether the F IS expectations for a highly clonal species (Balloux et al. Reference Balloux, Lehmann and de Meeûs2003) can be observed in the UK relative to populations with greater heterogonic development. The Balloux et al. (Reference Balloux, Lehmann and de Meeûs2003) model may also be applicable in other species where adult parthenogenesis has been documented (e.g., in some digenean and cestode species; Whitfield and Evans, Reference Whitfield and Evans1983).
In the second model, Prugnolle et al. (Reference Prugnolle, Liu, de Meeûs and Balloux2005a,Reference Prugnolle, Theron, Durand and de Meeûsb) developed a theoretical model for parasitic organisms that undergo asexual reproduction in intermediate hosts, and obligate sexual reproduction in a definitive host. Digeneans and Echinococcus cestodes fit this model. Asexual reproduction within the intermediate host creates variance in the reproductive success of each unique genotype, which could ultimately cause deviations in HWE. As the variance in the number of copies produced by different clones increases, the within-host F IS becomes increasingly negative and can reach a maximum of −1 if a single heterozygous clonal genotype colonizes the host (Fig. 3; Prugnolle et al. Reference Prugnolle, Roze, Theron and de Meeûs2005b). Indeed, empirical data support this theoretical work in that when repeated copies of clones are removed F IS values increase (e.g., Prugnolle et al. Reference Prugnolle, Choisy, Theron, Durand and de Meeûs2004a, Reference Prugnolle, Roze, Theron and de Meeûs2005b; Criscione et al. Reference Criscione, Vilas, Paniagua and Blouin2011; Vilas et al. Reference Vilas, Vázquez-Prieto and Paniagua2012). It is important to note that because multiple copies of a clone may be present, it is important to include only 1 copy of each clone (i.e., avoid clone-mate sampling) to correctly infer the mating system of the previous adult generation (Prugnolle et al. Reference Prugnolle, Liu, de Meeûs and Balloux2005a).
Mating systems
Given that there is sexual reproduction, the mating system refers to the set of circumstances under which pairs of gametes are united to form a zygote. We note that non-random mating may occur if there is a preference to mate with individuals of like phenotype (assortative mating) or unlike phenotype (disassortative mating), but only loci associated with those phenotypes would have genotypic proportions distorted from HWE expectations (de Meeûs et al. Reference de Meeûs, McCoy, Prugnolle, Chevillon, Durand, Hurtrez-Bousses and Renaud2007a). Here, we are concerned with non-random mating with respect to relatedness. Inbreeding avoidance (mating with unrelated individuals) will result in excess heterozygotes (−F IS). In contrast, inbreeding yields a positive F IS value and is driven by matings between relatives (biparental inbreeding) and by self-mating in hermaphroditic species. Parasite inbreeding has significant effects on both parasite and host evolution. Parasite inbreeding increases homozygosity, which leads to more efficient directional selection (Hedrick, Reference Hedrick2005). The latter is epidemiologically important as parasite inbreeding can radically increase the frequency of drug-resistant genotypes (e.g., Schwab et al. Reference Schwab, Churcher, Schwab, Basanez and Prichard2006). In addition, co-evolutionary models demonstrate that parasite inbreeding can impact the evolution of host mating systems (Agrawal and Lively, Reference Agrawal and Lively2001).
Because self-mating is an extreme form of inbreeding, mating system studies have largely been focused on hermaphroditic species. Estimating the selfing rate and determining what factors influence the selfing rate are important goals in research on the evolution of mixed-mating systems in hermaphroditic plants and animals (Goodwillie et al. Reference Goodwillie, Kalisz and Eckert2005; Jarne and Auld, Reference Jarne and Auld2006). Selfing and outcrossing rates can be estimated from F IS with the equation F IS=S/2−S (where S is the selfing rate and 1−S is the outcrossing rate) if inbreeding equilibrium is assumed. Under this assumption, the selfing rate is constant and selfing is the only source of inbreeding, outcrossing occurs via random mating, and the effects of selection, genetic drift or gene flow have a negligible effect on genotype frequencies (Hedrick, Reference Hedrick2005). One drawback to this method is that null alleles can artificially inflate F IS. As another means to estimate selfing from a population sample, David et al. (Reference David, Pujol, Viard, Castella and Goudet2007) provide a method based on identity disequilibria (correlations of heterozygosity across pairs of loci), which is not affected by null alleles (see also Jarne and David, Reference Jarne and David2008).
Overall, most studies on hermaphroditic metazoan parasites have focused on aquatic life cycles, where either all hosts in the life cycle are aquatic, or the intermediate hosts are aquatic and the definitive hosts are birds feeding in aquatic habitats. For trematodes, studies have examined adult worms from fish definitive hosts, while the mating systems of species with bird definitive hosts have been inferred from larval stages that infect invertebrate intermediate hosts. HWE observed at either stage would indicate that random mating occurred among the adult trematodes in the previous generation. For example, Keeney et al. (Reference Keeney, Waters and Poulin2007a,Reference Keeney, Waters and Poulinb) found that the larval populations of the marine trematode M. novaezealandensis were in HWE in the snail first intermediate hosts and in the crab second intermediate hosts (birds are the final host). In a study on the freshwater trematode Diplostomum pseudospathaceum (life cycle: aquatic snail to fish to bird), several larval populations were panmictic (multilocus F IS=0), and the identity disequilibria method indicated that selfing rates were not significantly different from zero for all populations (Louhi et al. 2010). Thus, in both the marine and the freshwater species, random mating was occurring among the adult trematodes within the bird definitive hosts. Studies on trematodes with complete aquatic life cycles where adults were sampled have also observed random mating systems (e.g., Reversat et al. Reference Reversat, Renaud and Maillard1989; Vilas and Paniagua, Reference Vilas and Paniagua2004; Criscione and Blouin, Reference Criscione and Blouin2006; Criscione et al. Reference Criscione, Vilas, Paniagua and Blouin2011). In the one semi-terrestrial digenean study (F. hepatica; Vilas et al. Reference Vilas, Vázquez-Prieto and Paniagua2012) that we are aware of, average multilocus F IS among sheep hosts was 0·16 and significantly different from zero.
Cestodes with aquatic life cycles also appear to have panmictic populations. Allozyme data indicated that cestodes from fish definitive hosts had panmictic populations with high outcrossing rates (Renaud and Gabrion, Reference Renaud and Gabrion1988; Šnábel et al. 1996). Microsatellite genotypes of Ligula intestinalis larvae from second intermediate fish hosts were used to test HWE, and S was estimated from F IS in several populations (Štefka et al. Reference Štefka, Hypša and Scholz2009). Several populations had significantly positive F IS with selfing rates from 0·19–0·4. However, using the identity disequilibria method (David et al. Reference David, Pujol, Viard, Castella and Goudet2007), none of the selfing rate estimates were significantly different from zero. This result suggested that unrecognized null alleles had artificially inflated F IS. Thus, L. intestinalis, a cestode species with a mostly aquatic life cycle (bird definitive hosts), is another example of a largely outcrossing metazoan parasite from an aquatic habitat.
In contrast to the aquatic parasite species, high levels of inbreeding have been observed in the terrestrial cestodes of the genus Echinococcus (Lymbery et al. Reference Lymbery, Constantine and Thompson1997; Knapp et al. Reference Knapp, Guislain, Bart, Raoul, Gottstein, Giraudoux and Piarroux2008). For instance, high selfing rates were inferred from significantly positive F IS values (close to 1) within populations of E. granulosus (Lymbery et al. Reference Lymbery, Constantine and Thompson1997). In species of Echinococcus, inbreeding may result from self-insemination or by mating between identical clones, which is genetically equivalent to self-mating (Lymbery et al. Reference Lymbery, Constantine and Thompson1997). Self-insemination could be promoted in low-density infections where the chance of encountering mates would be low, but may also occur when a membrane blocks the genital pore preventing outcrossing with other individuals (Smyth and McManus, Reference Smyth and McManus1989). Potential matings between clones is facilitated by the Echinococcus life cycle, which is similar to a digenean life cycle in that larval clones are asexually produced within the intermediate host. The difference, however, is that the clonal larvae do not disperse from this intermediate host. Thus, when a definitive host consumes the intermediate host, many individuals of the same genetic clone could be transmitted together. This dynamic increases the likelihood of matings between identical clones. Currently, there is only limited genetic evidence to suggest that clones of E. multilocularis are transmitted together when red foxes eat voles (Knapp et al. Reference Knapp, Guislain, Bart, Raoul, Gottstein, Giraudoux and Piarroux2008). Stronger conclusions require multilocus genotypes to ensure proper identification of identical clones. Further, careful sampling will be required as worm burdens can be extremely variable and also generally high. Knapp et al. (Reference Knapp, Guislain, Bart, Raoul, Gottstein, Giraudoux and Piarroux2008) considered 10000 or fewer worms to be a low-medium burden within a host, whereas greater than 10000 parasites was considered high. With such high intensities of infection, large sample sizes are necessary to determine the frequency of repeated clonal genotypes. High levels of inbreeding (F IS=0·83) were also detected in the gecko tapeworm Oochoristica javaensis, which has a 2-host, terrestrial life cycle going from arthropod to gecko (Detwiler and Criscione, Reference Detwiler and Criscione2011). However, O. javaensis does not have a clonal stage. Additional studies are underway to determine if the primary mating system alone can account for this high level of inbreeding or if non-random transmission among hosts also contributes to the high F IS (Detwiler, unpublished observations).
What may promote outcrossing and random mating in hermaphroditic parasites? (1) Rauch et al. (Reference Rauch, Kalbe and Reusch2005) hypothesized that more complex life cycles (3-host life cycle) evolved to reduce the chances of matings between identical clones, which is equivalent to selfing, in the final host. Indeed their study showed that snail first intermediate hosts were primarily infected with a single genetic trematode clone, while fish second intermediate hosts had significantly higher clonal diversity with no or few repeated copies of clones within hosts. Thus, by the time that definitive hosts are infected, there will be few chances for identical clones to mate (see also section on Clonal transmission). (2) The frequency of contact with other individuals may also impact the selfing rate of hermaphrodites. Once within a host, site specificity and high-intensity infections may increase the likelihood of coming into contact with other individuals, and thus promote outcrossing (Šnábel et al. Reference Šnábel, Hanzelová, Mattiucci, D'Amelio and Paggi1996). There is some evidence from natural populations which suggests that intensity of infection influences mating dynamics. Criscione and Blouin (Reference Criscione and Blouin2006) found that the number of single parasite infections corresponded to the selfing rate of the digenean P. shawi in naturally-infected fish hosts. Additional work is needed to determine how the intensity of infection directly relates to the primary rate of selfing in hermaphroditic parasites. (3) There may also be an interplay between the mating system within hosts and the transmission process itself including the habitat of transmission (e.g., aquatic vs terrestrial) and mode of transmission (e.g., free-living stages or the lack thereof). As noted above, most studies in aquatic systems have observed HWE within hosts, thus supporting the aquatic mixing hypothesis. This raises the interesting question of whether terrestrial systems promote sibling transmission, and thus bi-parental inbreeding. At this point, there are too few studies examining the mating systems of platyhelminth parasites to conclude that terrestrial life cycles promote more inbreeding than semi- or fully aquatic life cycles. In particular, the least is known about hermaphroditic parasites with terrestrial life cycles, although the few known examples suggest a trend towards high inbreeding (Lymbery et al. Reference Lymbery, Constantine and Thompson1997; Detwiler and Criscione, Reference Detwiler and Criscione2011). (4) The life-history peculiarities of some parasite species also need to be considered when trying to elucidate what factors influence inbreeding. For instance, the digenean Coitocaecum parvum has a 3-host, aquatic life cycle (snail to amphipods to fish). In the amphipods, C. parvum has facultative maturation and sexual reproduction. However, worms remained encysted. Thus, even if more than 1 trematode infects an amphipod, individuals that precociously mature can only self-mate as they remain enclosed in the cyst. This precocious trematode has high levels of inbreeding with F IS among 12 microsatellite loci ranging from 0·73 to 0·99 (Lagrue et al. Reference Lagrue, Poulin and Keeney2009; we note the latter range excludes potentially duplicated loci in their data set; see Detwiler and Criscione, Reference Detwiler and Criscione2011). Even though C. parvum has a fully aquatic life cycle, its life-history strategy of early reproduction appears to play a larger role in determining its mating system than the environment of transmission itself.
The above studies estimated F IS in the population sample, which leads to inference about the mating system of the previous adult generation. The mating system of the current generation can be elucidated by testing for pangamy, which is the random association of paired mates with respect to genetic relatedness (e.g., Prugnolle et al. Reference Prugnolle, Theron, Durand and de Meeûs2004b; Chevillon et al. Reference Chevillon, Koffi, Barre, Durand, Arnathau and de Meeus2007). The null hypothesis of pangamy has been tested in dioecious parasites with terrestrial and semi-terrestrial cycles (e.g., ticks and schistosome trematodes). Chevillon et al. (Reference Chevillon, Koffi, Barre, Durand, Arnathau and de Meeus2007) observed a positive within-host F IS for the tick R. microplus. For these cattle ticks, it was predicted that members of the same sibling group might persist and mate together on a host individual, leading to the observed inbreeding on hosts. To test the hypothesis of non-random mating on hosts, they collected mating pairs of ticks from cattle and tested for a correlation between mating status and genetic relatedness. Their analysis revealed that tick pairs mated randomly with respect to relatedness. They postulated that the positive F IS could be caused by the presence of admixed sibling groups due to a high variance in female reproductive success (see section on Sibling transmission). Amongst populations of another tick, Ixodes ricinus, variation in the mating system was observed (Kempf et al. Reference Kempf, Boulinier, de Meeûs, Arnathau and McCoy2009). Mating pairs from 2 populations were in pangamy, while non-random mate pairing with respect to relatedness occurred in 2 other populations. The authors hypothesized, but did not test, that the presence of cryptic host races might explain their results (i.e., mate pairings occurred between individuals of the same host race). If their hypothesis is true, then this reinforces our assertion (Fig. 1) that cryptic, upper levels of structure (e.g., presence of different species) need to be addressed prior to making inferences at lower scales (e.g., mating systems within a species). In contrast to the ticks, negative F IS was found within rats for S. mansoni (Prugnolle et al. Reference Prugnolle, de Meeûs, Durand, Sire and Theron2002). This study found that the negative F IS was likely caused by sex-biased dispersal, which provides a potential means to limit inbreeding. Thus, it was hypothesized that the predominant mating strategy would be pangamy because there would be no need to evolve mechanisms to prevent inbreeding (e.g., avoidance of kin). Prugnolle et al. (Reference Prugnolle, Theron, Durand and de Meeûs2004b) directly tested for pangamy in a natural population of S. mansoni by comparing the observed relatedness between individual male-female pairs to the relatedness between all possible male-female pairs within a host. The prediction of pangamy was supported as no association was detected from naturally infected hosts.
CONCLUDING REMARKS
Our review is not meant to be exhaustive, but rather aims to highlight some major causes or explanations for why one might observe deviations from panmixia in a local-scale study of metazoan parasites. There may be other factors that affect parasite transmission and thus drive genetic differentiation among infrapopulations that we have not covered in depth such as ecological or immunological differences between host sexes or host ages (e.g., Caillaud et al. Reference Caillaud, Prugnolle, Durand, Theron and de Meeus2006; Dharmarajan et al. Reference Dharmarajan, Beasley and Rhodes2010). We also did not cover technical issues such as null alleles that can cause aberrant F-statistics, in particular the inference of inbreeding from positive F IS. Likewise, other non-Mendelian factors such as duplicated loci and sex-chromosome linked loci can lead to the calculation of artifactual F-statistics and thus, erroneous population inferences (Detwiler and Criscione, Reference Detwiler and Criscione2011). We refer readers to de Meeûs et al. (Reference de Meeûs, Humair, Grunau, Delaye and Renaud2004) for methods to detect null alleles, but one quick check is to explore the variance in F IS values among loci. An inbred mating system is unlikely to generate extensive variation, thus a high variance in F IS among loci provides a clue that disruptions (technical or biological) of panmixia other than the mating system are at play. Also, our focus has been on the use of F IS and F ST to test for deviations from panmixia. However, linkage disequilibrium (non-random association of alleles among loci) patterns can also be informative. For example, admixed populations not only cause a deficit of heterozygotes (the Wahlund effect) at individual loci, but also increase linkage disequilibrium among loci. Indeed, when ignoring the 3 cryptic populations of L. fusiforme (Criscione et al. Reference Criscione, Vilas, Paniagua and Blouin2011), all possible pairwise loci combinations showed significant genotypic disequilibrium. Once separated into each of 3 clusters, only Cluster II showed significant overall genotypic disequilibrium. But, genotypic disequilibrium in Cluster II was actually caused by the presence of repeated copies of clones (see de Meeûs et al. Reference de Meeûs, Lehmann and Balloux2006), and equilibrium was observed after reducing the data set to a single copy per clone.
We began this review by highlighting that population genetics data can be used to elucidate the ecological mechanisms that caused disruptions in panmixia. We do caution that different ecological mechanisms may lead to similar patterns of genetic structure. Indeed, our review is intended to provide a rough guideline to deal, in part, with this latter issue. Because direct observation of many parasite population processes such as transmission among hosts and direct mating interactions are often not possible, population genetics approaches may be the only viable option to elucidate certain parasite population dynamics. In some cases, genetic data can be used to make direct inference on parasite biology. For example, parent-offspring genotype data can be used to directly estimate the mating system of a hermaphroditic parasite. In other cases such as the use of F ST to elucidate transmission amongst hosts, indirect inference may only be possible. Such indirect methods are not without their caveats. For instance, significant F ST amongst infrapopulations indicates allele frequency differences, and thus provides an assessment of some form of non-random recruitment. However, equating F ST to some actual level of dispersal (i.e., the effective number of migrants per generation, N em) may be impractical because the transmission process itself may violate one or more assumptions (e.g., equilibrium between genetic drift and migration) in population genetics models (see Whitlock and McCauley, Reference Whitlock and McCauley1999). Another important aspect to mention is that population genetics methods are largely allele/genotype frequency based methods. Thus, appropriate sample sizes are needed to estimate F IS and F ST. It is difficult to provide a standardized sampling protocol because life-history variation in parasites is vast. Also, sampling will depend on the question. As a start, our own personal experience leads us to suggest the following to assess whether there is among-infrapopulation genetic structure. If mean intensities are low (∼<10), we suggest genotyping all individuals from about 20 to 30 infected hosts. If intensities are high, we would suggest genotyping 20–30 parasites per host for 10 or more hosts. It would be useful for future work to simulate transmission and mating dynamics under various parasite life histories (e.g., Prugnolle et al. Reference Prugnolle, Liu, de Meeûs and Balloux2005a,Reference Prugnolle, Theron, Durand and de Meeûsb) to not only assess appropriate sampling regimes, but also to better assess the impacts of sib-sampling on estimated F-statistics and population genetic parameter expectations under focal or sibling transmission.