

MEMBERS of the same ethnic group often work in certain industries more than in others. Marginalized groups contend with labor market discrimination that pushes them to industries subject to less bias or with jobs less desirable to dominant groups.Footnote 1 Referral networks often lead individuals to join industries employing a large number of coethnics.Footnote 2 Groups may have cultural or social characteristics that render them likelier to seek and secure employment in certain industries.Footnote 3 This ethnic segmentation of labor markets can emerge out of stark intergroup divisions. Could ethnic groups’ varied exposure to given industries also transform those identity cleavages?
An emergent literature links industrial decline to an accentuation of social divisions, an aggravation of ethnic grievances, and polarization of politics along ethnocultural lines.Footnote 4 Economic anxieties, which might result from global market volatility and competition or longer-term processes of deindustrialization, have been associated with growing ethnocentric and right-wing populist movements across Europe and North America.Footnote 5 Industrial contractions drive wedges between identity groups, scholars contend, rallying voters behind policies and politicians pledging to guard a particular group's social and economic standing.
Much of this literature has focused on the behavior of dominant ethnic groups, such as communities of native-born white Americans, who associate industrial decay with a loss of social status and accordingly take steps to protect the status quo group hierarchy.Footnote 6 Yet members of lower status, politically excluded groups—like internal and international migrants—have long concentrated in volatile industries. In the early twentieth century, Southern and Eastern European immigrants filled the workforces of many US industries exposed to global economic flux.Footnote 7 Black Americans who moved to northern cities during the Great Migration clustered in jobs subject to uniquely random terms of employment.Footnote 8 Manufacturers in the United States—the focus of much recent work on industrial decline and white identity—today employ about three million foreign-born workers.Footnote 9 Migrants across developed and developing countries are closely connected to industries at risk of decline due to the physical effects of climate change and decarbonization.Footnote 10
I contend that marginalized groups’ distribution across industries has important implications for the contours of intergroup boundaries. When an industry is steadily growing, ethnic groups concentrated in that industry reap the benefits of that growth, distributing positive economic information and material resources among their members. This buttresses group members’ sense of economic security and confidence in the ability of their in-group to support their welfare, disincentivizing attempts to secure support from outside sources. When an industry experiences negative shocks, economic anxieties spread through groups concentrated in that industry, eroding confidence in those groups’ abilities to offset income losses and guard against future economic risks. Whereas members of dominant groups observing economic loss find receptive politicians upon doubling down on their ethnic identity, members of marginalized groups may instead be inclined to join outside groups that offer access to lucrative political benefits previously out of reach. Concentration in declining industries can weaken, not accentuate, reliance on status quo group ties.
I apply this argument to the coal industry in the early twentieth-century United States, an era of stark interethnic division and substantial market volatility. I focus specifically on European immigrants working in and around coal mines who were situated in dense ethnic enclaves that circulated both information and material resources. Using complete-count US census records linked over time and newly transcribed data on local coal production, I trace how immigrants seeking naturalized US citizenship amid local coal expansion and contraction pursued political incorporation. For immigrants in the early twentieth-century United States, citizenship granted access to the franchise and, in turn, benefits from politicians and the government.
I find that varied ethnic concentration in the coal industry altered naturalization rates among immigrants working in coal mines and those employed elsewhere in distinct ways according to conditions in local mines. When local production was steadily growing, clear cleavages emerged among immigrant groups: members of groups initially more concentrated in the industry were substantially less likely than others to invest in political incorporation. Yet when negative shocks buffeted local mines, these intergroup differences narrowed, with group concentration in the industry no longer constraining naturalization among immigrant miners or coethnics outside the industry.
These dynamics were most evident for immigrants deeply embedded in their ethnic enclave, underscoring the powerful implications of industrial change for status quo group relations and patterns of naturalization. Exploiting variation in mines’ political contexts, I also find that these shifts were most pronounced where meaningful political influence was within immigrants’ reach. Little evidence exists of increased naturalization in areas where access to the franchise would have yielded few benefits, which points to the political motivations of naturalizing immigrants. Additional tests indicate that these results are not an artifact of immigrants who are less inclined to naturalize selecting into more productive mining areas.
This article offers several contributions to scholarship on economic change and identity. While much recent scholarship focuses on the responses of politically privileged groups to industrial decline, my research shifts attention to disadvantaged groups. In doing so, I illuminate how stable growth can deepen existing group dependencies while economic instability disrupts them. Although incumbent group ties may shape the initial experience of economic threats,Footnote 11 reliance on those same ties can be weakened as industries contract, eroding the explanatory power of initial social groupings. In making this argument, I contribute to the literature detailing the situational nature and economic sources of group allegiances, including migrants’ assimilation decisions.Footnote 12 I identify heretofore underappreciated determinants of individuals’ reliance on their ethnic group and migrants’ connections to local polities: identity groups’ distribution across industries. Group ties not only shape experiences of industrial flux; they themselves can be reconstituted by it.
This article also adds to the understanding of when migrants forgo investments in political integration. Scholars have identified a rich set of determinants of political incorporation, including mobilization by political elites and the ease of surmounting bureaucratic hurdles.Footnote 13 Alongside these factors, the distribution of ethnic groups across industries influences how migrants perceive their own economic security and invest in attaining greater political voice. Relatedly, my work speaks to the literature on when and how ethnically diverse migrants politically unify or divide in destination communities. Scholars have found that migrants often unify along class lines at the workplace.Footnote 14 This article underscores the conditional nature of this tendency: in periods of steady growth, immigrants in the same mines varied widely in their propensity to naturalize; it was only amid decline that differences in political engagement across groups evened out.
Group Ties amid Industrial Growth and Decline
Social identities serve as prisms through which individuals interpret and respond to economic threats. People may hold sociotropic attitudes, for example, that attune them to the welfare of compatriots or coethnics.Footnote 15 Yet these identities are pliable, varying in salience by political and economic context.Footnote 16 Politicians in competitive electoral settings may instrumentally accentuate ethnic divides.Footnote 17 Individuals may associate with high-status groups to compensate for economic losses.Footnote 18 Although group identities may moderate experiences of economic change, they are subject to change.
In this section, I propose that ethnic groups’ distribution across industries—their concentration in certain industries more than others—is an important determinant of the political allegiances of their members. In contrast to much scholarship, I analyze politically marginalized groups, focusing specifically on migrant groups that have long contended with issues of political exclusion.Footnote 19 Whereas scholars have argued that economic decline reinforces individuals’ ethnic identities, I instead contend that among marginalized groups, dependence on coethnics can be strongest in contexts of consistent economic growth. Group concentration in growing industries affirms ethnic loyalties; concentration in declining industries causes individuals to look elsewhere for alternative sources of support.
Ethnic Concentration in Industry
Consider a world with two ethnically distinct migrant groups, segregated into separate ethnic enclaves. Social ties among coethnics transmit information on the state of the economy and material resources, as is common among migrant groups.Footnote 20 Resource transfers, sustained by high levels of social capital and reciprocity, encompass bilateral extensions of credit and the provision of employment opportunities between coethnics. They also include quasi-institutionalized risk-sharing arrangements, such as mutual aid societies and fraternal insurance associations, that provide an informal safety net for in-group members experiencing losses of income.Footnote 21 These groups are politically disenfranchised, lacking the ability to vote or to easily attract economic support from the government, and are differentially distributed across industries in their local economy.
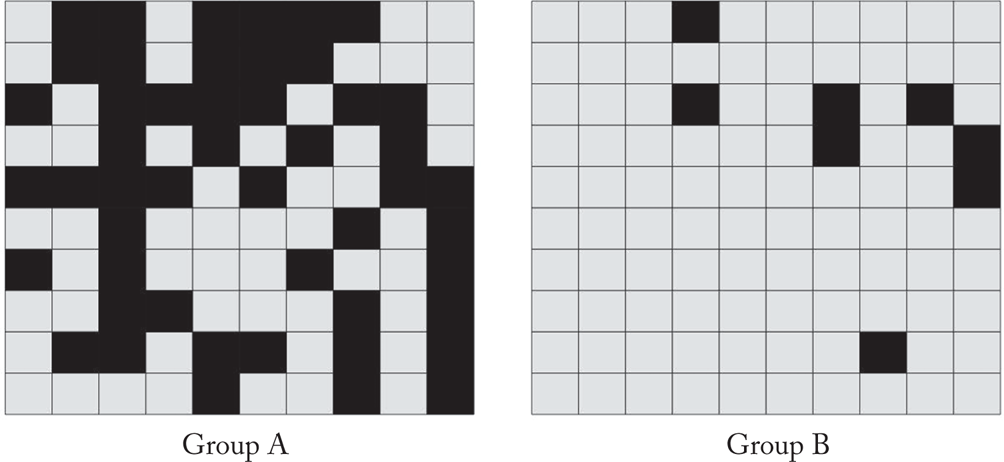
Figure 1 depicts these two hypothetical groups (A and B). In this illustration, each cell represents a worker. Black cells are employed in a single local industry (the “red industry”), while gray cells work in a mix of other industries. While both groups are the same size, they differ in their concentration in or exposure to the red industry: half of the workers in Group A are employed in the red industry, compared to just 8 percent in Group B. Because these groups vary in their concentration in the red industry, they experience the same industrial conditions in distinct ways. I argue that this affects how individuals relate to their group and to out-groups.
Depictions of Two Hypothetical Ethnic Groups (Enclaves)
a Group A concentrated in a single industry (red industry); Group B dispersed across other industries. Black cells work in the red industry; gray cells work elsewhere.

Ethnic Concentration amid Steady Growth
When the red industry is steadily growing, workers in that industry receive consistent streams of income. They consequently spread news of good industrial conditions to coethnics in their enclave, transmitting information that highlights their own economic well-being and the health of local labor markets. These industry workers further ably provide material and financial support to coethnic peers as needed, and pay into any of the more institutionalized resource-sharing mechanisms their group maintains.
While workers belonging to either ethnic group enjoy such benefits of growth, the extent to which news of their employment and material resources spread to coethnics depends crucially on each group's concentration in the industry. Because Group A is more concentrated in the red industry than is Group B, members of Group A will, on average, be more socially proximate to workers in the red industry, either directly connected with such workers or only a couple of degrees removed. All else being equal, members of Group A should accordingly be likelier than members of Group B to receive information and resources from workers in the red industry. Moreover, because a greater share of Group A is employed in the red industry, the resource-sharing mechanisms maintained by Group A should be enriched to a greater extent than those offered by Group B: Group A's many workers in the red industry are able to contribute resources to the group, helping to offset any idiosyncratic income losses among coethnics.
Because of this varied exposure to workers in the red industry, differences in the integrity of groups A and B should emerge when the red industry is experiencing steady growth. Individuals who receive optimistic economic information from their peers—information indicating that jobs are plentiful—should become more confident in their own economic standing and less concerned about future labor market risks than those who do not receive such information.Footnote 22 Likewise, individuals who receive adequate material support from coethnics or from group-level mechanisms should become more assured of their group's ability to effectively manage economic risks and offset future losses of income. Given that information and resources diffuse more widely across Group A, members of that group should, on average, be more confident in their coethnics’ ability to support their welfare than members of Group B. I expect this to be the case for members of Group A employed in the red industry and for those employed elsewhere. While industry workers send information and resources to peers, they also receive information from coethnic coworkers and become better able to access support in the case of an idiosyncratic shock, bolstering confidence in their ethnic group and attenuating fears of economic risks.Footnote 23
For migrants, this confidence should manifest as less investment in political integration. Political incorporation can generate substantial economic benefits, including the ability to attract social services and employment assistance, access to political rents from parties and political elites (for example, infrastructure investments, public and private sector jobs, business licenses, favors before municipal boards), and the right to press electorally for expansions of formal welfare programs, especially where migrants are electorally pivotal.Footnote 24 But successfully reaping the benefits of political incorporation—particularly for ostracized ethnic groups—involves surmounting barriers that range from legal obstacles and onerous bureaucratic requirements to a lack of political information to hostile native populations.Footnote 25 Although members of Group A and Group B may equally enjoy the material returns to political incorporation, I expect that migrants in Group A—more confident in their economic security and trusting of the welfare supports furnished by coethnics—will be less willing to invest in achieving those benefits, content to remain reliant on their group for economic protection.
Ethnic Concentration amid Decline
Suppose that the red industry is contracting, experiencing either consistent secular decline or intermittent negative shocks (busts). Instead of earning steady streams of income, workers in the red industry now see pay cuts, reductions in working days, or outright job loss. Whereas coethnics of workers in a growing industry receive positive economic information, those of workers in an industry undergoing steady decay or contending with negative shocks instead observe job loss and economic pain, accentuating perceptions of economic vulnerability and sowing doubt over their future economic prospects.Footnote 26 Workers in the red industry, rather than ably providing material support to coethnics, now seek out material support from their group to help smooth over income losses.
As in the case of industrial growth, the spread of pessimistic information and demands for support depends on each group's concentration in the red industry. In the group more concentrated in the red industry, more individuals will observe, either directly or indirectly, coethnics falling on hard times and will receive requests for support from coethnics. Resource-sharing systems will similarly be strained in the more exposed group, with decline amounting to a correlated shock to group members.Footnote 27 As more members place demands on the group for support, the ability of the group to compensate each member declines, depriving red industry workers and their coethnics elsewhere of the ability to offset losses of income. Although individuals’ first recourse amid an economic shock may be to look to in-group members, group concentration in a declining industry erodes this option. Decline accordingly portends a loss of the privileges of concentration in an industry.
I have argued in the preceding pages that group concentration in a steadily growing industry suppresses migrants’ interest in political incorporation by bolstering their perceived economic security. This constraining effect should break down amid negative shocks, however, as migrants in groups more exposed to the industry become more doubtful of their economic security and skeptical of their groups’ capacity to effectively ensure their welfare moving forward. While members of groups concentrated in growing industries are content to remain dependent on their coethnics for support, members of groups concentrated in declining industries should instead increasingly look beyond their coethnics for more durable sources of economic support, such as those that accompany political incorporation.
I do not argue that such migrants will wholly exit their ethnic group, severing ties or moving away from their group's cultural traditions. Rather, they should seek to lessen their reliance on the tenuous resource-sharing mechanisms contained by their group, diversifying the economic backstops to which they have access. Absent an ability to confidently lean on coethnics, migrants concentrated in declining industries should be more willing to bear the costs of political incorporation in pursuit of government support.Footnote 28
A key difference between marginalized groups, such as these hypothetical migrant groups, and politically privileged groups is important to note here. While issues of concentration in a declining industry may similarly afflict marginalized and advantaged groups, their recourses to government support differ. By virtue of their political privilege, advantaged groups can often find politicians eager to champion their cause in government. Thus, members of privileged groups may find that looking inward, emphasizing their ethnic identity and “circling the wagons” around their group, is politically profitable in times of economic stress, as recent work on ethnocentric political movements suggests.Footnote 29 Members of marginalized groups, which lack equivalent patrons in government, may instead be driven to engage more with outside groups to achieve greater political sway.
In sum, theoretical reason exists to think that ethnic groups’ distribution across industries affects the allegiances of their members in ways critically dependent on conditions within those industries. When an industry steadily grows, ethnic groups should vary widely in rates of political incorporation: migrants with greater group exposure to the industry should see less incentive to integrate into the local body politic, confident in the informal insurance backstops that their coethnics provide. When an industry declines, these divergent rates of incorporation should narrow as the gains from concentration in the industry dissipate. These shifts should be particularly pronounced in areas where political participation can be expected to yield lucrative material benefits.
—Hypothesis 1 (H1). Group concentration in an industry should suppress political incorporation in periods of steady growth but do so increasingly less when that industry experiences decline, particularly when and where the benefits of political participation are more plentiful.
Application to Coal
In the following section, I apply the theory to European immigrants in the early twentieth-century United States, focusing on those proximate to the country's coal industry. Such a test case is appealing for several reasons. The many immigrants in and around coal mines lived in dense ethnic enclaves that spread information and resources among coethnics. The coal industry generally grew during this period, but like the modern fossil fuel industry, it was highly volatile and subject to frequent negative shocks. Moreover, the geography of the coal industry—its sprawl across several states—provides an empirical opportunity. Because immigrants’ access to political power varied widely across coalfields, I can evaluate how immigrants' behavior differed with the economic returns to political incorporation (access to political rents).
The coal industry, like many others, has unique qualities. Yet this case should nonetheless yield generalizable insights into the consequences of ethnic groups’ uneven distribution across industries, especially for politically excluded migrants and in settings with weak formal welfare institutions. For example, this case may generalize to manufacturing industries in the early twentieth-century United States, which were similarly encompassed by dense ethnic enclaves,Footnote 30 as well as to industries in much of the developing world today, which often feature a large number of migrant workers and truncated welfare states.Footnote 31
There is also reason to focus specifically on fossil fuel industries. To date, much of the work on economic shocks has targeted manufacturing, particularly in the wake of increased Chinese import competition.Footnote 32 Yet fossil fuels have long been marked by pronounced boom-and-bust cycles and are today under pressure to arrest the pace of global warming. With contemporary political efforts to transition away from fossil fuels, past instances of decline may shed light on how such transitions may proceed in the years ahead.Footnote 33 Fossil fuel industries continue to employ a large number of migrants and members of other marginalized groups, and these people may shape how the future politics of climate change unfold. Nevertheless, considering the case of coal for its own sake is valuable.Footnote 34
Case of Coal in the Early Twentieth Century
Coal was the world's primary energy source in the early twentieth century and accordingly, one of its most consequential and politically powerful industries.Footnote 35 Because mechanization had not yet spread widely, mining was highly labor intensive in these years. In 1920, nearly one million people in the United States—1 percent of the country's total population—reported an occupation in coal mining.Footnote 36
Although it was generally a period of growth in the industry, top-line figures mask volatility at the local level, where production varied widely across space and time due to changes in local market conditions, breakdowns in mine infrastructure, and local strike activity, which were all exacerbated by seasonal cycles in the demand for coal. Because most industrial activity used coal and it was a popular residential heating fuel, the industry was also susceptible to swings in the national and global economy, which were commonplace at the time. The US economy experienced six contractions between 1900 and 1920;Footnote 37 a sharp recession in the early 1920s brought about by the end of World War I and the Spanish Flu pandemic coincided with a 40 to 50 percent decline in US coal production.Footnote 38 To relieve such pressures, mine operators typically looked for ways to cut labor costs.Footnote 39
The early twentieth century comprised the tail end of the Age of Mass Migration, a period during which thirty million Europeans emigrated to the United States and the foreign-born share of the country's population grew to more than 14 percent. A surge in inward migration was fueled partly by industrial lobbies who sought open immigration policies and actively enticed new arrivals to join their workforces.Footnote 40 European immigrants, unlike those from Asia and elsewhere, were largely unencumbered by legal restrictions to entry until the late 1910s and 1920s.Footnote 41
Many immigrants found themselves working in or around coal mines shortly after arriving in eastern port cities. Of the more than 220,000 Southern and Eastern European men who emigrated in 1909, for example, about 8 percent were working in coal mining by 1910. By 1910, European immigrants composed 48 percent the country's coal mine workforce,Footnote 42 helping to make the United Mine Workers of America “the most ethnically and racially diverse union in the US labor movement.”Footnote 43 In the largest coalfields, immigrant workers often outnumbered native workers by wide margins. In Pennsylvania's Luzerne County, then the largest coal mining county in the country, European immigrants outnumbered native white miners by nearly eight to one; in neighboring Lackawanna County, the ratio was ten to one. Virtually all coal mining counties had some European immigrants present. Accounts from this period suggest that this prevalence of immigrant miners was not coincidental; many mines featured immigrant bosses who saw coethnics as more reliable and harder working. One miner recalled that bosses in his area preferred Italian workers because they knew they would “produce that coal.”Footnote 44
Ethnic compositions of coal mines varied widely, determined largely by the idiosyncratic preferences of local mine operators.Footnote 45 Mine operators principally used the padrone system to find workers, hiring middlemen—often longer-term immigrants—to entice recent arrivals in cities such as New York and Philadelphia to coalfields on the country's interior. Operators placed advertisements in foreign-language newspapers in immigrant-heavy eastern cities as well. The subsequent communication of job opportunities between coethnics further brought new workers to coalfields.Footnote 46
Ethnic Enclaves in Coal Country
Dense ethnic enclaves helped immigrants to cope with the economic instability of the time. As in cities, coal towns were marked by high levels of interethnic segregation and animus, with immigrant groups separated from each other and from native citizens socially and spatially; ethnic enclaves were characteristic of coal towns.Footnote 47 These communities also featured high levels of within-group solidarity, with mutual aid societies, fraternal insurance associations, and ethnic congregations marking many immigrant enclaves even in more rural areas. Across coalfields, these ethnic organizations were central to life around mines. Such ethnic ties and the communication of job openings across them were often what drew immigrants to the mines in the first place.Footnote 48
With few formal welfare protections, the informal institutions within ethnic enclaves provided important resource-sharing functions for immigrants in coal communities. Even in contexts of high labor mobility,Footnote 49 these mechanisms were a primary means by which immigrants accessed welfare and credit.Footnote 50 Via these institutions and personal encounters, immigrants were attuned and responsive to the economic welfare of nearby coethnics.Footnote 51 Immigrants paid monthly dues or made voluntary donations to ethnic organizations, which the organizations then pooled and redistributed to members “in cases of sickness, accidents, or distress,” or following deaths of family members.Footnote 52 These insurance functions were distinctly important near coal mines, where injuries and deadly accidents were common, especially among immigrants.Footnote 53 Coethnics additionally helped to diffuse the costs of production interruptions and wage fluctuations. In Colorado, for example, miners carefully distributed shifts among themselves when work became scarce.Footnote 54
Male European immigrants had a persistent option of initiating naturalization proceedings; women were unable to independently naturalize until 1922. After a short time in the United States, men were permitted to declare their intent to become US citizens in naturalization court (declarations of intention). After at least five years, they could petition for naturalization—a request typically granted by immigration courts.Footnote 55 Immigrants had little legal imperative to naturalize beyond its granting them the right to vote; naturalization was an act of political incorporation and a means of securing political rents and favorable representation in government.Footnote 56 Non–citizen immigrants in coal mining areas largely lacked the right to vote. Although naturalization was not without costs—it required an understanding of US civics and English as well as the ability to travel long distances (in some cases) to government offices—its benefits were substantial.Footnote 57 Naturalization, and subsequent enfranchisement, was a primary means by which immigrants accessed state support, such as via the provision of public sector jobs or investments in certain communities. In competitive electoral districts, politicians sometimes actively encouraged immigrants to naturalize and vote.Footnote 58 Notably, European immigrants at this time had uniquely pro-welfare preferences,Footnote 59 which they were able to act on electorally once naturalized. My interpretation of naturalization as an indicator of political incorporation corresponds with work finding that naturalization catalyzes migrant political participation.Footnote 60
Citizenship in American Coalfields
The political contours of the coal industry varied widely across the country, with immigrants’ access to political power depending largely on the mine at which they worked. In much of central Appalachia, mine operators denied miners meaningful access to the franchise. The labor leader Samuel Gompers described coalfields in West Virginia in the early 1900s as “the last remains of industrial autocracy in America.”Footnote 61 Mine operators maintained a tight grip over life in their company towns, acting as unfettered political machines. The flow of political information was carefully controlled. Company guards often flagrantly coerced workers into voting the company line, sometimes simply handing miners prefilled ballots. In no way were “citizens there allowed … to express their preference in these elections,” reported Department of Justice officials at the time.Footnote 62 Similar conditions prevailed in western states, the setting for Upton Sinclair's King Coal, where miners lived in isolated company camps “carefully designed to inculcate subservience and loyalty.”Footnote 63
Elsewhere, workers enjoyed greater political autonomy. In Pennsylvania, then the heart of the coal industry, miners were active in local political life. Miners in that state were, for example, involved in the establishment of the labor-oriented Greenback Party in the 1870s.Footnote 64 They ran for local political office, with a seat in government providing an avenue to advance their interests more reliable and potentially more profitable than a strategy of labor strikes and direct confrontations with mine operators. Enfranchised miners had their poll taxes paid by local power brokers and, as with immigrants elsewhere, enjoyed access to the services provided by partisan patronage networks.Footnote 65 In other coalfields, from Alabama to Illinois, miners were similarly highly attentive to local and national politics, seeking to assert their political agency with frequent debate about which candidates would best advance the workers’ cause. When under economic pressure, miners “pinned their hopes for change on the ballot box.”Footnote 66
When local mines were rapidly or steadily growing—avoiding negative production shocks—immigrants with greater group exposure to the industry should have felt less need to invest in naturalization. In contexts of coal shocks, exposure to local mines should have led such immigrants to increasingly seek the secure benefits of citizenship.Footnote 67 Based on this theory, we should expect that group concentration in coal suppressed naturalization in periods of steady growth in the industry, but increasingly less so amid decline.
Naturalization is sometimes treated as part of a suite of assimilation outcomes, alongside indicators of social or cultural assimilation.Footnote 68 However, naturalization was distinct from social assimilation into the native white populace.Footnote 69 If immigrants were motivated by the political benefits of naturalization as opposed to a general desire to socially assimilate or obtain the status benefits of national identification,Footnote 70 the greatest variation in naturalization rates should be observed in areas where immigrants could meaningfully exercise political voice—areas where workers enjoyed greater political autonomy and where elections were relatively competitive. This leads to the expectation that the conditional relationship between group concentration and naturalization was most apparent in areas where the benefits of political participation were most lucrative.
Empirical Strategy
I test the hypotheses with individual-level data on immigrant naturalization and county-level data on coal production. Using complete-count decennial US census records between 1900 and 1920,Footnote 71 I trace how single individuals naturalized over time. I compare immigrants within counties and states, leveraging variation in ethnic groups’ concentration in nearby mines to assess how naturalization rates diverged as those mines grew or declined.
To track immigrants’ behavior, I rely on recently devised automated methods for linking single individuals across multiple digitized censuses. I draw linkages from the new ipums Multigenerational Longitudinal Panel (mlp).Footnote 72 The ipums mlp builds on prior census-linking efforts and is appealing in that it produces substantially more linkages without a loss in accuracy and can link both men and women. Earlier methods relied largely on individuals’ names, which complicated linking women because of the custom of changing surnames upon marriage. With this revised method, I can even track immigrants who moved within the United States between censuses.
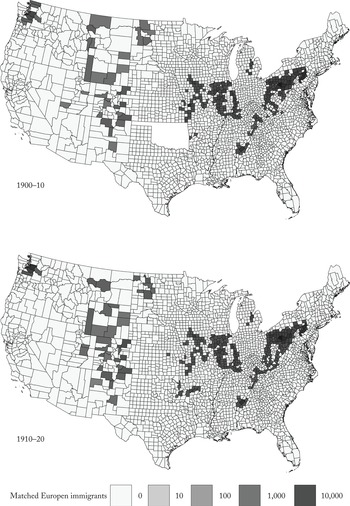
I use two sets of census linkages—1900 to 1910 and 1910 to 1920—that I stack into a single data set for analysis purposes. I focus on the period of 1900–1920 due to the prevalence of within-group resource-sharing for European immigrants at this time.Footnote 73 The unit of analysis is the matched individual in a given matching range (see Figure 2).
Geographic Distribution of Immigrants in Coal Counties Matched across Censusesa
a Immigrants are matched and remain in the sample even if they migrate out of a coal-producing county between censuses.

Although these years featured mounting nativist resistance to European immigration, particularly following World War I, little evidence exists that the degree of nativist animosity faced by immigrants varied with their group's concentration in coal or with shifts in the industry. The cultural origins of nativism in this era produced a disconnect between anti-immigrant backlashes and local economic conditions.Footnote 74 Accordingly, although exposure to nativism encouraged some immigrants to naturalize, this exposure is unlikely to bias the statistical analyses described here.Footnote 75
Variable Measurement
political incorporation
To measure political incorporation, I construct a binary variable that records if a non–citizen immigrant successfully naturalized between consecutive censuses. In a supplementary test (see supplementary material, Section G.6), I expand this definition to include declarations of intention to naturalize.
coal shocks
To measure conditions in local coal mines, I transcribe annual coal production data at the county level from editions of Mineral Resources of the United States, an historical publication of the US Geological Survey. Using these production data, I construct a continuous measure of the intensity of negative shocks that a county's coal mines experienced between the enumeration of consecutive censuses (sum of all year-over-year percentage declines in that county-decade). Low shock intensities indicate that a county's mines were steadily growing, with minimal intra-decade production declines. High shock intensities indicate that a county's mines experienced severe negative shocks. I take the square root of this measure. Section A in the supplementary material contains additional details.
group concentration
To measure immigrants’ group exposure to local coal mining (concentration of ethnic groups in coal), I first classify immigrants into thirty-six distinct groups based on place of birth and mother tongue (see section B in the supplementary material). Upon classifying immigrants, I record the percentage of workers in each immigrant group employed in coal mining in each county at the start of each decade (ahead of the measurement of coal shocks).Footnote 76 The following equation describes the calculation of this variable for a given group g in county c at time t. Due to its rightward skew, I take its square root.
 $${\rm Group\;concentratio}{\rm n}_{cgt} = \sqrt {\displaystyle{{{\rm Coal\;miner}{\rm s}_{cgt}} \over {{\rm All\;worker}{\rm s}_{cgt}}}} $$
While immigrants often featured prominently in mines, levels of group concentration varied widely. In 1910, for example, 87 percent of the 1,297 Austrian immigrant workers in Las Animas County, Colorado, were employed in coal compared to 65 percent of the 1,815 Italian immigrants in the area. East to Williamson County, Illinois, 96 percent of Russian immigrants worked in local mines—far more than the 57 percent of Irish immigrants in those mines. In 1900 and 1910, 31 percent of the average European immigrant's coethnics in a coal-producing county worked in coal.
As I compare immigrants within the same county, one concern is that group concentration in coal was not randomly assigned. My identifying assumption is that within-county variation in groups’ exposure to local mines at the start of a decade was independent of performance in those mines over the ensuing decade. In other words, I assume that groups in the same county did not differentially sort into or out of coal mines according to future, yet-to-be-observed production changes in those mines.Footnote 77 I identify little historical qualitative evidence to suggest that this was the case. Further, while I find quantitatively that group concentrations tended to be lower in counties with declining coal industries, I crucially do not find systematic differences between groups in this regard (see section B in the supplementary material). Although we cannot rule out threats to inference entirely, the possible endogeneity of group concentration does not appear to be a major issue.
covariates
The full regression models include a set of individual- and county-level covariates, all based on complete-count census records from the start of a given decade (further details can be found in section C in the supplementary material). At the individual level, I condition on an immigrant's first year of emigration to the United States, as recent immigrants may have been less likely to naturalize than immigrants who had arrived earlier. I further condition on whether a given immigrant was living with a spouse, which provides an indication of whether an immigrant intended to stay in the United States permanently; temporary migrants often left behind family in Europe. Immigrants’ economic class may have additionally affected the perceived benefits of naturalization; to account for this possibility, I control for an estimate of individuals’ employment income. I also control for an immigrant group's share of a county's population, given research that attributes naturalization to group size.Footnote 78
I include four covariates at the county level. I record each county's reliance on coal mining for each census, measured as the percentage of workers in a county reporting an occupation in coal. I also record the share of residents living in rural areas (as recorded in the census), as well as the black share of each county's population, which may have affected immigrants’ interest in naturalizing.Footnote 79
In addition, I control for the health of a county's non–coal economy to separate coal-specific shocks from instances of general economic decline. To distinguish coal shocks from broader economic shocks, I compute a continuous Bartik estimate of decline in local non–coal economies. Bartik estimates rest on an interaction of local industry shares with national industry-level growth patterns.Footnote 80 Pairing complete-count census data on local employment shares with national-level production data, I calculate and control for negative shocks to non–coal industries for each county decade under analysis (see section C.2 in the supplementary material). I include this covariate in all models to isolate coal shocks from shocks to the other industries to which the coal industry was connected.Footnote 81
The full data set is limited to European immigrants (at least twenty-one years of age) residing in counties actively producing coal at the start of a given decade. Importantly, immigrants remain in the sample even if they moved out of coal-producing counties between censuses. I exclude immigrants in counties where borders were changed during a given decade. This data set totals 698,809 immigrants matched across census pairs, initially distributed across 318 counties and 23 states. Tests of naturalization are limited to non–citizen immigrants eligible to begin naturalization proceedings (men of at least 21 years of age); other tests involve the remaining observations. About 29 percent of European immigrants in coal counties were successfully matched, near the high end of typical match rates in the literatureFootnote 82 (see section D in the supplementary materials for details).
Econometric Model
Using these data, I estimate the model,
 $$ \eqalign{Y_{icgs( {t + 10} ) } = \beta [ {{\rm shock\;intensit}{\rm y}_{c( {t\to t + 9} ) } }\cr \quad \times ( {{\rm group\;concentratio}{\rm n}_{cgt} + W_{it} + X_{ct}} ) ] + \gamma _c + \delta _{st} + \epsilon _{icgs( {t + 10} ) } , \;$$
where i indexes individuals, c counties, g immigrant groups, s states, and t years. β is a vector of coefficients, Wit is a vector of individual-level covariates for each census year, Xct is a vector of county-level covariates for each census year, and ɛicgs (t+10) is an error term clustered at the county-group level. I additionally include two fixed-effects terms: a county fixed-effects term, γc, and a state-year fixed-effects term, δ st, which accounts for the distinct political and economic trajectories of different states.Footnote 83 The outcome Yicgs (t+10) is the naturalization dummy. Single-interaction models can introduce bias by overlooking interactive relationships between the moderator and covariates;Footnote 84 I accordingly estimate this as a fully moderated model. In supplementary tests (section G.8 in supplementary material), I use a binning estimator to address potential issues of linear extrapolation and ensure common support in the moderator.Footnote 85 I also estimate models without the full covariate set, eliminating the potential issue of covariate endogeneity.
I estimate this model with weighted least squares. One challenge in using matched census data is biased selection into matching. As is customary, I correct for this challenge by weighting individuals according to their likelihood of having been matched. I compare the sets of matched individuals to the corresponding complete-count censuses (limited to coal-producing counties), predicting each individual's probability of having been matched according to their age, gender, literacy, place of residence, immigrant status, and occupation (see section C in the supplementary material).
Results
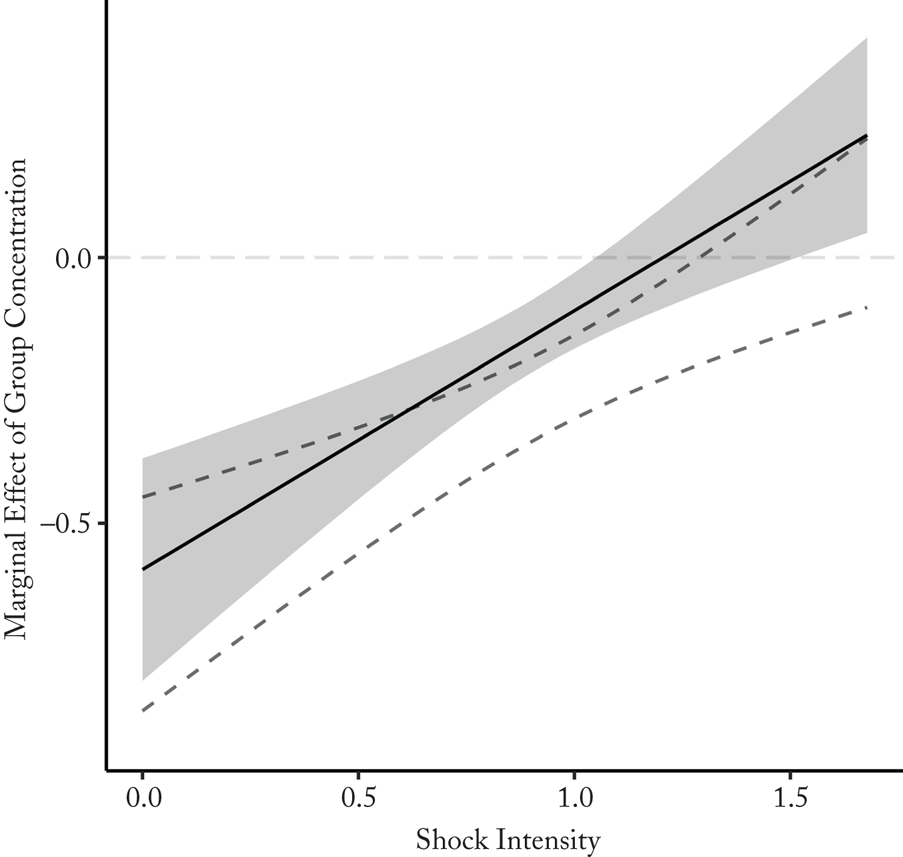
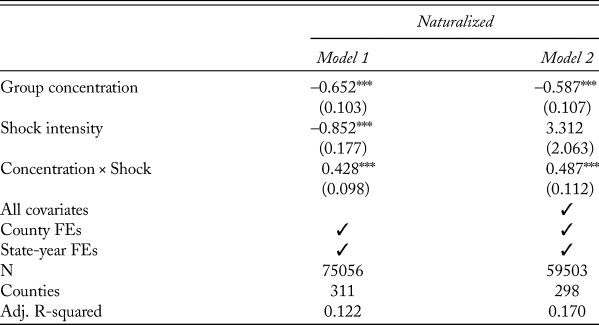
Estimation results, with and without the full covariate set, offer support for this article's theory. As Table 1 and Figure 3 illustrate, group concentration in coal had a strong negative relationship with political incorporation when local mines were steadily growing. Broad differences in naturalization rates between ethnic groups emerged around these steadily growing mines, with such cleavages eroding when negative shocks battered mines. Around the healthiest tercile of mines (lowest shock intensity), a 10-percentage point increase in group concentration corresponded to a 12.5-point decline in the likelihood of attaining citizenship. Yet around the tercile of mines experiencing the most severe shocks, this same difference in group concentration was associated with a mere 3-point decline in naturalization (see section G.8 in the supplementary material for further details on tercile tests). Higher rates of naturalization among members of groups concentrated in coal may have driven this convergence (see section E, Table E2 in the supplementary material).Footnote 86
Interaction Plot: Regressions of the Successful Naturalization Dummy on the Interaction of Shock Intensity and Group Concentrationa
a Ninety-five percent confidence intervals are shown in gray bands; dashed lines indicate the confidence intervals for the model without all covariates.

Regressions of the Successful Naturalization Dummy on the Interaction of Shock Intensity and Group Concentration

*** p < .001, ** p < .01, * p < .05; standard errors clustered at the county-group level and noted in parentheses.
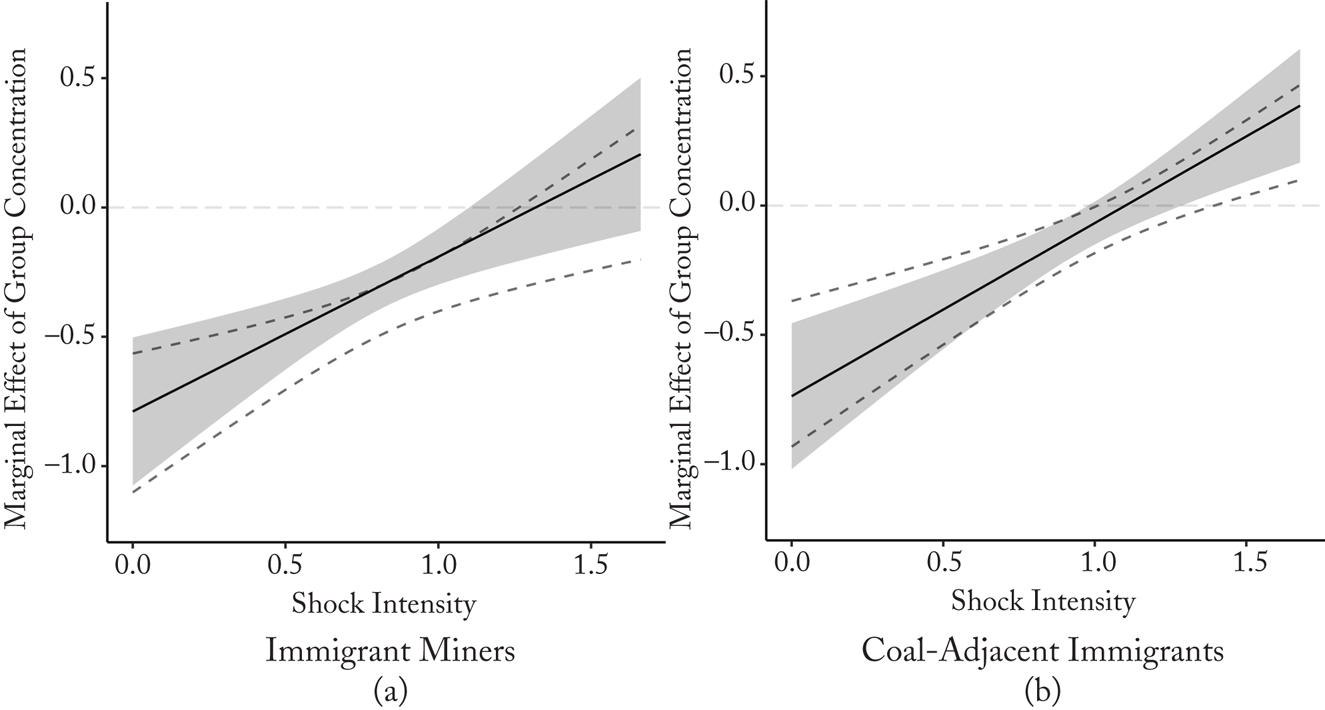
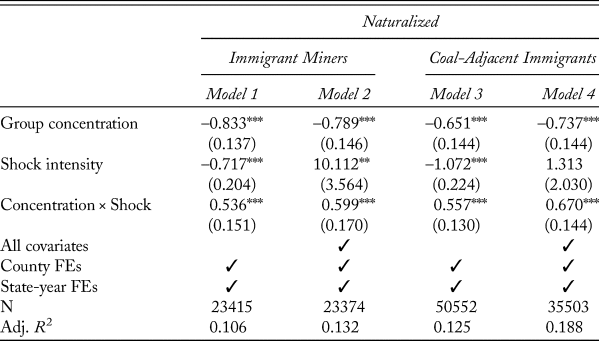
The theory just described anticipates that these changes in naturalization rates were apparent among both immigrants working in mines and coethnics employed elsewhere. To test this, I distinguish between two sets of immigrants: (1) immigrant miners and (2) those neither working in the industry nor living with any family member in the industry.Footnote 87 The results of these tests, depicted in Table 2 and Figure 4, indicate that ethnic enclaves shaped naturalization rates in and around local mines by transmitting the benefits of growth and costs of decline: group concentration in steadily growing mines suppressed naturalization among both miners themselves and coethnics employed elsewhere.
Interaction Plots: Regressions Dividing Immigrant Miners and Coal-Adjacent Immigrantsa
a Panel (a) shows immigrants working in coal; panel (b) shows those working outside of the coal industry, not living with any family members in the industry. Ninety-five percent confidence intervals, calculated using robust standard errors clustered at the group-county level, are shown in gray bands. Dashed lines indicate the confidence intervals for models without all covariates.

Regressions Dividing Immigrant Miners and Coal-Adjacent Immigrantsa

*** p < .001, ** p < .01, * p < .05; standard errors clustered at the county-group level.
a Sample divided between immigrants working in coal (models 1 and 2) and those working outside coal living with no family members in coal (models 3 and 4). Standard errors noted in parentheses.
Across immigrant miners and coal-adjacent immigrants, varying group concentrations in local mines drove clear wedges between immigrants in times of consistent growth. Miners in more exposed groups were far less likely to naturalize than other miners in the same coalfields; in the most steadily growing quintile of mines, a ten-point increase in group exposure suppressed naturalization rates by more than twenty-three percentage points in expectation. Yet these differences were substantially narrower in mines experiencing negative shocks; in the quintile of mines where negative shocks were most severe, that same difference in group concentration corresponded to just an eight-point decline in naturalization for immigrant miners. Among coal-adjacent immigrants, this increase in group concentration was correlated with a twenty-point decline in naturalization around consistently growing mines, but no significant change near sharply declining mines. Note that these results are not an artificial product of linear extrapolation or a lack of common support in the decline moderator (see section G.8 in the supplementary material).Footnote 88
Political Contexts
The ability of immigrants to access the benefits of political participation varied widely across the country. If immigrants were attracted to the material benefits of citizenship—and not purely the status benefits of national identification—these baseline results should be primarily obtained where those material benefits were more accessible.Footnote 89 I test this using two metrics, the partisan makeup of immigrants’ communities and mines’ geographic locations.
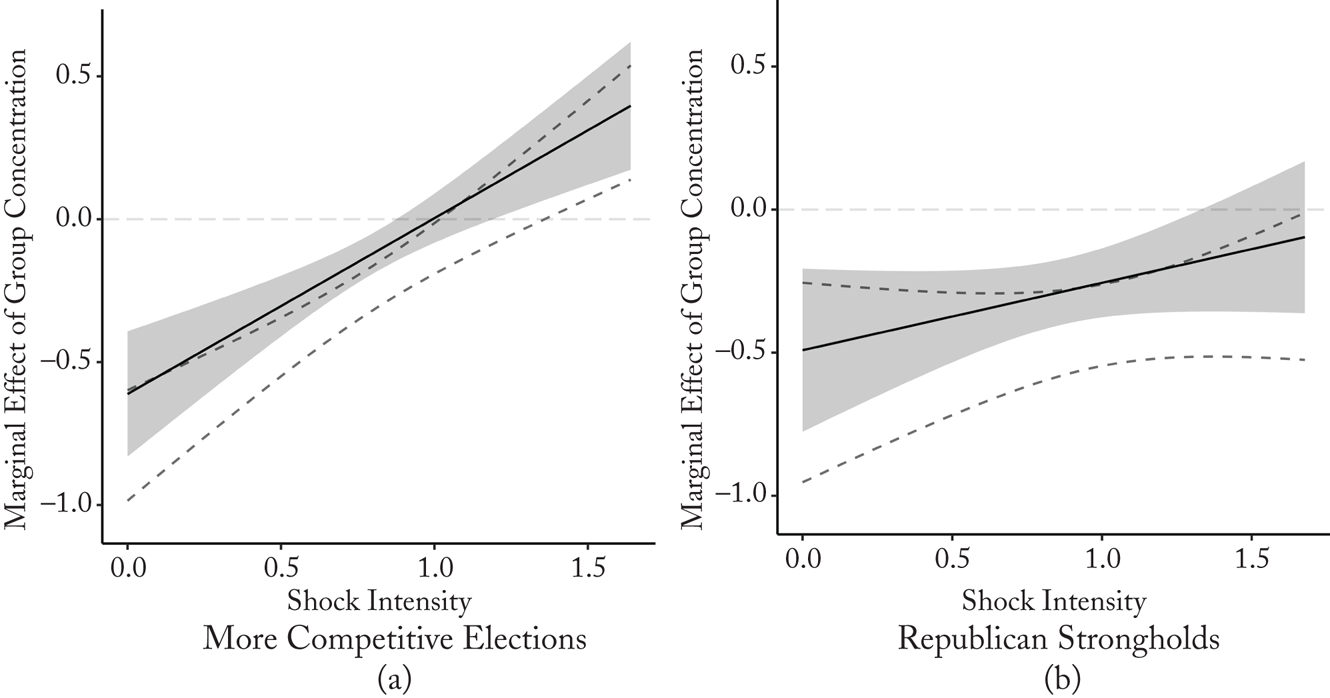
I first evaluate immigrants’ partisan contexts. Mines were often situated in Republican strongholds. In both 1900 and 1910, 52 percent of immigrant miners were living in Republican-held congressional districts won by more than ten points (see section C in the supplementary material for data details). If immigrants were principally motivated by the material benefits of citizenship, changes in naturalization rates should have been most pronounced in more competitive districts. Many immigrants at this time were particularly inclined to naturalize when they were likely to be pivotal voters for the Democratic Party, which promised an enticing mix of patronage and programmatic policy benefits.Footnote 90
To test this, I divide immigrants living in Republican strongholds from those living elsewhere.Footnote 91 Figure 5 shows that the conditional relationship between group concentration and naturalization was strongest in areas where elections were relatively competitive. In these districts, immigrants in groups more concentrated in coal mines were far less likely than others to naturalize in periods of steady growth, but this negative relationship was notably attenuated around mines suffering negative shocks. Milder evidence exists of this dynamic in Republican strongholds, indicating that the material benefits of naturalization, independent of any status benefits, were an important motivation for immigrants.
Regressions Dividing Sample by Electoral Competitivenessa
a Panel (a) shows immigrants in competitive districts (n = 33,942); panel (b) shows immigrants in Republican strongholds (n = 37,402). Ninety-five percent confidence intervals, calculated using robust standard errors clustered at the group-county level, are shown in gray bands. Dashed lines indicate the confidence intervals for models without all covariates.

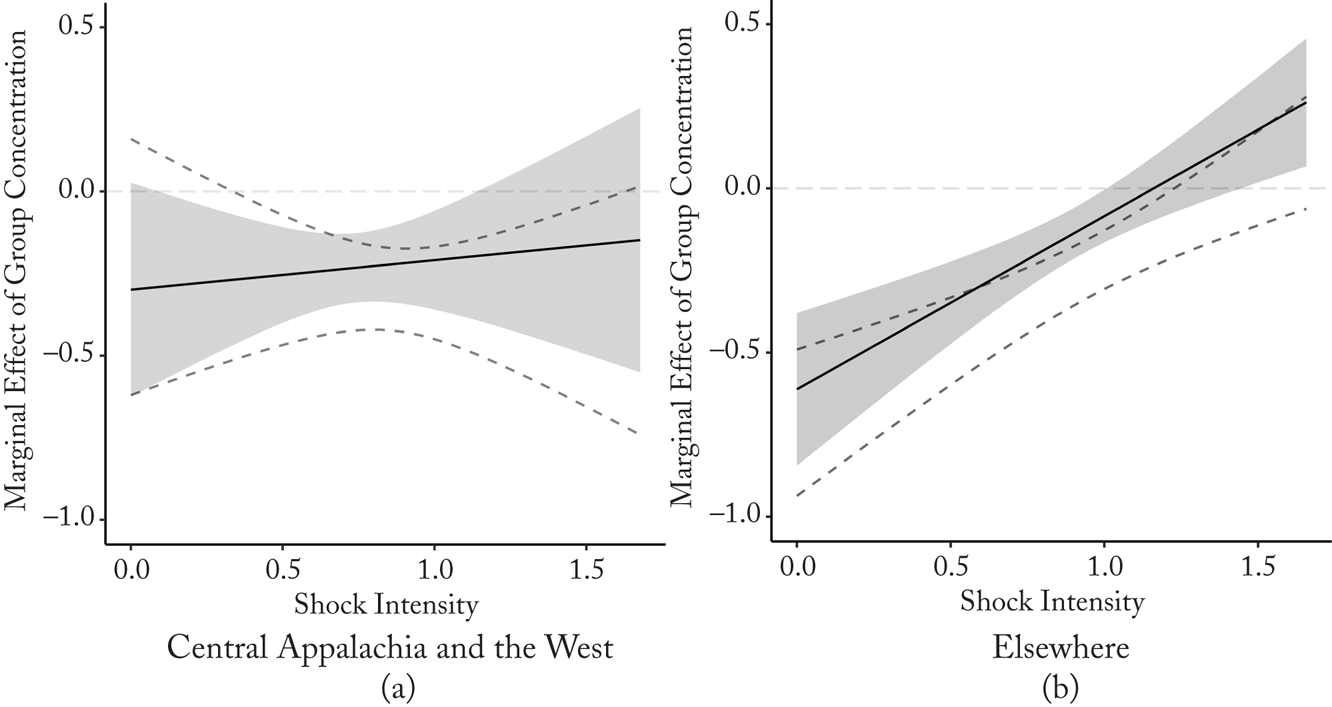
I now consider mines’ geographic locations. As I have described here, immigrants’ ability to participate in politics without interference from mine operators varied across the country. In states like Pennsylvania and Illinois, miners were generally able to engage with nearby communities and in local politics. Elsewhere, namely around central Appalachian and Mountain West mines, immigrants were socially and politically isolated in company towns and camps. In these tests (see Figure 6), I accordingly divide immigrants by their state of residence.
Regressions Dividing Sample by Geographic Locationa
a “Central Appalachia and the West” includes Arizona, California, Colorado, Idaho, Kentucky, Montana, Nevada, Oregon, New Mexico, Tennessee, Utah, Virginia, Washington, West Virginia, and Wyoming (n = 9,227). Remaining states are grouped together (n = 70,086).

Figure 6 reveals that in line with expectations, away from more restrictive coalfields, the baseline results hold. In central Appalachia and the West, where mine operators retained tight control over local elections, I observe no clear change in naturalization rates with exposure to coal.Footnote 92 Conversely, I obtain the baseline results for immigrants living elsewhere, where voting rights could be more meaningfully exercised. This further supports the notion that immigrants in coalfields were motivated by the material benefits of citizenship, not only the nonmaterial status benefits that could be obtained even in areas where political influence was lacking.Footnote 93
Position in Ethnic Enclave
The theory laid out above focuses on the spread of information and material resources within ethnic enclaves. In this section, I evaluate whether naturalization patterns differed between immigrants on the interior of their enclave who principally communicated with coethnics and participated in ethnic communal life, and immigrants on the fringes of their enclave with more exposure to non-coethnics. To approximate the depth of immigrants’ integration into their enclave, I use complete-count census records to identify individuals’ likely exposure to non-coethnics at their places of work. To do so, I calculate for each coal-adjacent immigrant the proportion of coworkers who were coethnics.Footnote 94 Immigrants working with more non-coethnic coworkers likely had more outward-facing social ties, making them less reliant on their enclave for information and material support.
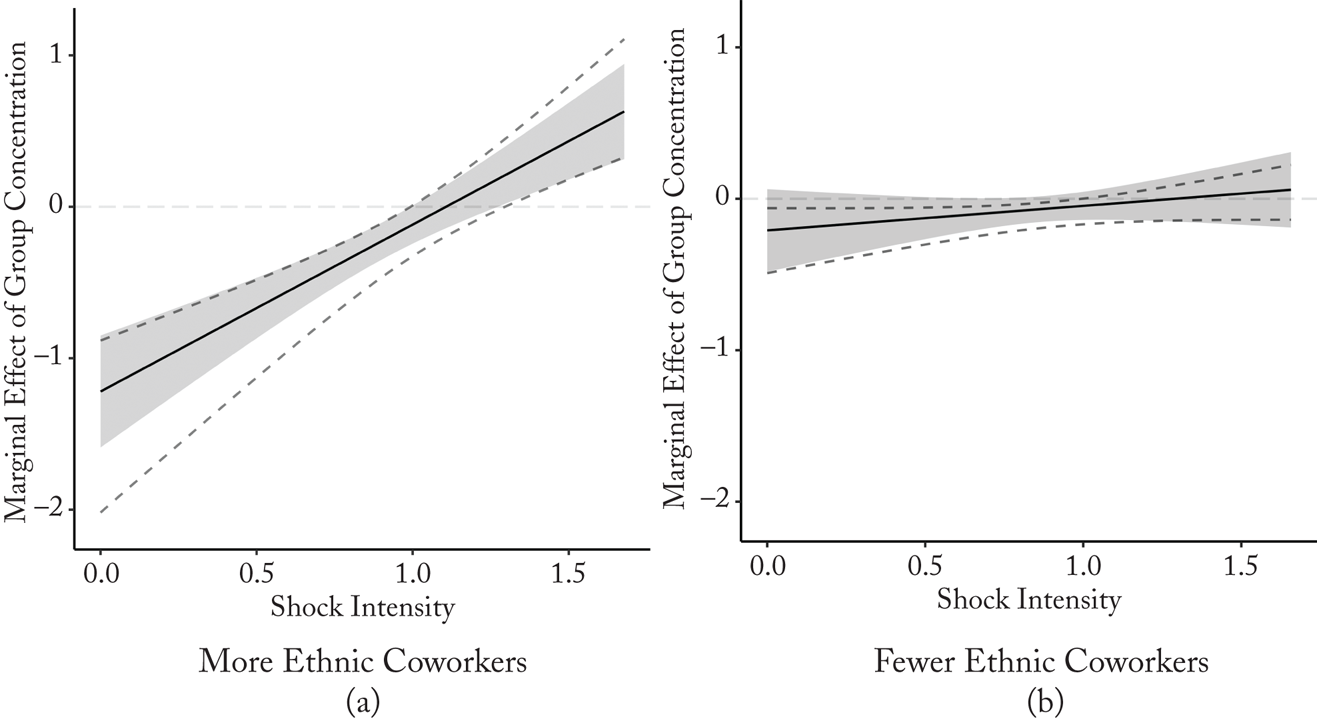
Figure 7 shows that the clearest relationship between group concentration and naturalization was among immigrants working with more coethnics, who likely were more tightly connected to their ethnic enclave. Little evidence exists of varied group concentrations cleaving immigrants who worked with few coethnics. Being less tied to their enclave, immigrants in the latter group were less responsive to shifts in coethnic miners’ fortunes despite sharing a common ethnic identity. That these results are most pronounced for immigrants deeply embedded in their ethnic enclave underscores the capacity of industrial change to modify naturalization decisions.
Regressions Dividing Immigrants by Position in Enclavea
a Sample divided between coal-adjacent immigrants working in local industries employing more than the median share of coethnic workers (more than 3.9 percent of coworkers being coethnic; n = 25,260) and those working alongside fewer coethnics (at most, 3.9 percent of coworkers being coethnics; n = 25,292).

Political Incorporation or Social Assimilation
Collectively, the results show that group concentration in the coal industry was associated with a strengthening of immigrants’ reliance on their ethnic enclaves in periods of stable growth, but increasingly less so around mines weakened by negative shocks. Here, I evaluate whether group exposure to coal shocks drove immigrants to wholly exit their enclave, severing ties with coethnics, or simply to lessen their reliance on coethnics via naturalization. To do so, I consider the possibility of social assimilation: migrants’ integration into the native white populace or other immigrant groups. Social assimilation yielded some material benefits, such as better labor-market outcomes,Footnote 95 which may have been attractive in periods of economic stress. I evaluate this possibility using two metrics: marriage to a non-coethnic (a native white citizen or a non-coethnic immigrant) and acquiring the ability to speak English.
I find little evidence that group concentration in coal was associated with social assimilation across men and women (see section F in the supplementary material). This finding may be due to the difficulty of social assimilation. Unlike naturalization, successful social assimilation required the assent of outgroup members—something that the many Southern and Eastern Europeans in coal towns struggled to achieve.Footnote 96 Rather than fully severing ties to their enclave, immigrants with broad group exposure to coal shocks appear to have come to rely less on coethnics without leaving the group entirely.
Alternative Explanations
Groups concentrated in growing mines may have included many recent migrants attracted by the promise of good pay, but unlikely to invest in naturalization. Groups concentrated in soon-to-decline mines may have instead comprised more long-term immigrants; by virtue of their length of stay, these people may have been more likely to naturalize for reasons independent of their group's concentration in coal. If such is the case, the results described here may be due to biased selection in growing and declining mining areas.
While I control for immigrants’ year of emigration to the United States, I attempt to further rule out this explanation by splitting recent immigrants from longer-term immigrants. Little indicates that these two sets of immigrants behaved differently (see section G.1 in the supplementary material). Potential selection of recent migrants into growing mining areas does not appear to explain the results.
Another alternative explanation concerns the results disaggregating immigrant miners from coal-adjacent immigrants. As immigrants are not observed between the enumeration of two censuses, coal-adjacent immigrants could have begun working in the industry during the intervening period. If immigrants were more likely to do that when they belonged to more exposed groups, it may explain the significant results found for coal-adjacent immigrants.
But while some coal-adjacent immigrants did enter the industry between censuses, their entry is unlikely to have biased the results I describe. Just 9.5 percent of immigrants identified as coal-adjacent at the start of the decade were working in coal at the end of the decade, while 63.6 percent of the immigrants working in coal at the start of the decade remained in the coal industry at the decade's end. I further obtain the baseline results when limiting the sample to older immigrants who were unlikely to enter the industry by virtue of their age, as well as when limiting the sample to coal-adjacent immigrants who remained employed outside of coal at the end of a decade (see section G.2 in the supplementary material).
Robustness Checks
As a placebo test, I evaluate whether immigrant's tendency to naturalize varied with future economic contractions in their county.Footnote 97 I find null results as expected, underscoring the unique importance of contemporaneous industrial conditions in shaping the relationship between group concentration and naturalization (see section G.3 in the supplementary material).
Other robustness checks support the main results (see section G in the supplementary material). First, I consider the possibility that the measures of shock intensity are correlated with longer-run growth trends. I find that the results are robust to controlling for intra-decadal growth in local mines and local, non–coal industries. Acknowledging that ethnic ties could cross county borders, I additionally recalculate the group concentration and shock intensity variables to encompass all counties in which immigrants had a direct railroad connection. This test produces commensurate results. I further recode political incorporation to include declarations of intention to naturalize, which likewise yields similar results. I additionally note the possibility of both coal production and naturalization being endogenous to county-specific political and economic conditions. Both production and naturalization may have been associated with local labor action, given the strength of coal unions in much of the country. To account for this association, I exclude county-years that endured significant strike activity; the results persist. Results are similarly robust to the inclusion of county-census fixed effects (comparing immigrants in the same county in the same year). Last, I exclude the few coal-producing states in which non–citizen immigrants were permitted to vote; results are again robust.
Mechanical checks similarly affirm these results. I recluster standard errors at the county level; the results remain significant. I reestimate the interaction models using a binning estimator, ensuring common support in the moderator, which affirms the results. I reestimate the main model, iteratively dropping each county, each ethnic group, and random sets of observations from the sample to check for highly influential outliers; the results persist. I interact the beginning-of-decade covariates with decade fixed effects to allow for differential associations by year (see section E, Table E1, in the supplementary material); the results are consistent. Results are also robust when removing observation weights and when replacing square roots with logarithmic transformations.
Conclusion
Economic threats to dominant ethnic groups may prompt individuals to look inward, fomenting ethnic chauvinism and defensiveness. But when focusing on marginalized groups, a different logic holds. For such groups, group allegiances may be affirmed by concentration in consistently growing industries and shifted by exposure to negative shocks. Groups concentrated in growing industries furnish their members with positive economic information and material resources, which buttresses members’ confidence in their coethnics’ ability to support their welfare. For migrants, this buttress lessens the appeal of political incorporation. Amid industrial decline, however, the advantages of concentration dissipate, prompting migrants to politically integrate into the local community as a means of lessening reliance on their ethnic group. The ethnic topography of an economy—the distribution of groups across industries—is an important determinant of how group attachments evolve in contexts of economic prosperity and decay.
The historical evidence I present supports this argument. In the United States at the turn of the twentieth century, varied ethnic concentration in coal cleaved both immigrant miners and coal-adjacent immigrants in periods of stable growth. Immigrants in groups more concentrated in local mines were substantially less likely to naturalize, confident in their economic position and group ties. Around mines buffeted by negative shocks, however, the negative relationship between group concentration and naturalization diminished as immigrants looked beyond their coethnics for new sources of support. Whereas growth in the coal industry sustained immigrants’ allegiances to their ethnic enclaves, decline corresponded to a transformation, though not a severing, of extant group ties. These trends were most evident among immigrants who were closely tied to their ethnic enclaves and who lived in areas where the material benefits of naturalization were attainable.
This argument should generalize to other industries. Historical accounts suggest that shocks to US manufacturing in the early twentieth century, for example, prompted a similar fraying of ethnic ties among immigrant groups concentrated in the industry.Footnote 98 The findings should further generalize to other time periods and countries, particularly democracies marked by ethnic fragmentation and truncated welfare states. Such democracies are characteristic of much of the developing world, and they similarly often feature ethnic groups equipped with resource-sharing technologies.Footnote 99 My argument may also travel to pockets of developed democracies, such as immigrant communities in the contemporary United States, which feature resource-sharing among coethnics and often concentrate in specific industries.Footnote 100
These findings point to several avenues for future research. Researchers, first, may investigate whether immigrant groups vary in the extent to which these dynamics hold. These dynamics may be less apparent for wealthier immigrant groups that are less reliant on intra-ethnic resource-sharing. They may also break down for the descendants of first-generation immigrants; subsequent generations may be less likely to rely on coethnics due to increasing assimilation and the relative fragility of ethnic resource-sharing arrangements, particularly in settings where formal welfare institutions are available.
Scholars may additionally consider how political elites respond strategically to the concentration of marginalized groups in certain industries. In periods of steady growth, politicians may neglect such groups as levels of political engagement remain low. But politicians may actively seek to capitalize on the anxieties of groups concentrated in declining industries, promising them material benefits in exchange for their votes. A fruitful avenue for future work may be to dissect how politicians determine the nature of such benefits. Do politicians opt for direct investments in an ethnic enclave, which might ignite nativist backlash, or instead seek subsidies to prop up an industry in which targeted groups are concentrated, which may not be as clearly identified by nativists as a transfer to ostracized groups? Researchers might also explore strategic behavior on the part of leaders within marginalized groups. Do leaders of groups concentrated in volatile industries seek to reinforce the cultural attachments of group members to dissuade exit amid industrial decline?
Another promising direction concerns gender identity and economic change, particularly in the context of male-dominated fossil fuel industries.Footnote 101 Recent scholarship illustrates how economic shocks to women's families can transform patriarchal norms around political engagement.Footnote 102 Scholars may probe whether, analogous to my argument, growth in fossil fuel industries historically accentuated the gender gap in rates of political participation in patriarchal settings. In periods of decline, as male relatives in the industry lose income and familial networks become increasingly stressed, women may increasingly look to exit traditional domestic structures and become more politically active.
Scholars may also investigate what these findings portend for the future politics of climate change, which are likely to be defined by transitions away from fossil fuel industries.Footnote 103 Outstanding questions include the extent to which these transitions will transform patterns of political contestation and whether they will trigger identity-based backlashes like those attributed to economic globalization. Notably, fossil fuel industries remain connected to marginalized groups. In India, for example, migrant communities have close ties to nearby coal mines; in the United States, immigrants are well represented in oil and gas workforces.Footnote 104 This article suggests that groups concentrated in these industries may increasingly look to integrate into local polities as the industries contract. By exploring how ethnic groups are distributed across industries, scholars can shed light on how marginalized groups will cope with impending climate transitions and how such transitions will transform identity politics in the years ahead.
Supplementary Material
Supplementary material for this article can be found at https://doi.org/10.1017/S0043887122000168.
Data
Replication files for this article can be found at https://doi.org/10.7910/DVN/PRRXMM.
Acknowledgements
I thank Allison Carnegie, Richard Clark, Jaclyn Davis, Michael Doyle, Page Fortna, Nikhar Gaikwad, Salif Jaiteh, Amanda Kennard, Cleo O'Brien-Udry, Jack Snyder, Daniel Thomas, Johannes Urpelainen, Ryan Weldzius, the reviewers and editors at World Politics, and audiences at Columbia, the London School of Economics, New York University, and the Graduate Student International Political Economy Workshop for helpful comments. An earlier version of this article also received valuable feedback at the 2021 International Studies Association and Midwest Political Science Association annual conferences.