INTRODUCTION
Radiocarbon (14C) is produced in the atmosphere by a reaction of neutrons with atmospheric 14N that produces 14C, which is rapidly oxidized into CO2 and then exchanges with different carbon reservoirs. Natural processes such as solar activity, Earth’s magnetic field, ocean circulation, and rates of exchange between carbon reservoirs all affect the 14C content. Besides these natural variations, human activities also have an impact on atmospheric 14C concentration. Two anthropogenic effects are recorded by atmospheric 14C: first, the Suess effect, which is the addition of carbon dioxide by fossil fuel combustion; and secondly, the increase in 14C concentration in the atmosphere as a result of atmospheric nuclear weapons testing. Both of these anthropogenic factors occur on a global scale, however there are also local Suess effects due to local fossil-fuel sources. So, there are regional discrepancies that are related to the emission zone proximity as well as geographic location (Hua and Barbetti Reference Hua and Barbetti2004).
If we compare the global 14C atmospheric record to regional or local signals, then it is possible to relate this to regional and local changes in human activities such as industrial activity, traffic, domestic use, and land use. Takahashi et al. (Reference Takahashi, Konohira, Hiyama, Minami, Nakamura and Yoshida2002) highlighted an example of traffic-derived CO2 in the atmosphere of an urban forest. Levin et al. (Reference Levin, Kromer, Schmidt and Sartorius2003) used a novel approach for determining the independent budgeting of fossil fuel CO2 over Europe. Using the high-altitude Jungfraujoch sampling station results as the reference level, they were able to show a measured CO2 mixing ratio Cmeas at this location consists of three components: (1) a background component CBg, (2) a biospheric component Cbio, and (3) the fossil fuel component Cfoss. These components are expressed respectively as ∆14Cmeas, ∆14CBg, ∆14Cbio, and ∆14Cfoss. This deconvolution makes it possible to calculate the fossil fuel component.
In the present study, we gathered tree leaves that were collected by different botanists in the Dakar region during 1900–2003 and stored at the Cheikh Anta Diop University. The study region is situated in the area of Presqu'île du Cap Vert, a heavily urban and densely populated area of Dakar that is 550 km2 in area.
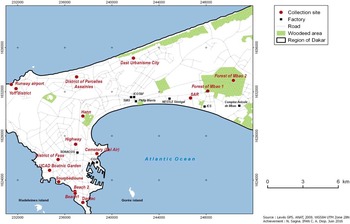
To the east lies the region of Thies, and the Atlantic Ocean surrounds the areas to the north, west, and south of Dakar (Figure 1). All leaves were sampled from deciduous trees. We thus can assume their 14C content represents a single year of atmospheric 14C activity. In this study, the tree leaves are used to determine the amount of atmospheric ∆14C, and from these results the local Suess effect can be indirectly estimated using a mathematical model (Oeschger et al. Reference Oeschger, Siegenthaler, Schotter and Gugelman1975).
Map of the Dakar region showing the sample collection sites (circles) and the industries (squares).

The maximum production of bomb 14C occurred in the Northern Hemisphere (NH), where the majority of atmospheric nuclear tests were conducted (Nydal et al. Reference Nydal, Lovesth and Guillicksen1979; Hua et al. 2013). The maximum concentrations occurred in 1963–1964 and levels of almost two times the concentration levels before 1950 were observed (Nydal et al. Reference Nydal, Lovesth and Guillicksen1979). Since 1964, 14C concentrations have decreased and this trend can be attributed to the transfer of 14C into surface and deep oceans, terrestrial biosphere, as well as the dilution by fossil fuel CO2 (Nydal and Lovseth Reference Nydal and Lovesth1983; Hua and Barbetti Reference Hua and Barbetti2004). Based on the amplitude and the occurrence of the bomb 14C peak, Hua and Barbetti (Reference Hua and Barbetti2004) and Hua et al. (2013) classified global tropospheric 14C records into four zones—three in the Northern Hemisphere, and one for the Southern Hemisphere (SH).
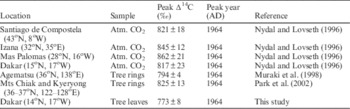
A peak bomb 14C value of 816±23‰ in 1964 was measured by Nydal and Lovseth (Reference Nydal and Lovseth1996). At some other locations in NH zone 2, the ∆14C peak values ranges from 794±4‰ to 862±21‰ (Table 3).
Study Area
The study area is situated in the region of Presqu'île du Cap Vert, a heavily urban and densely populated part of Dakar that is 550 km2 in area. Dakar (14º40′20′′N, 17º25′54′′W is the capital city of Senegal with a population of about 3.5 million people and a density of 4646 inhabitants/m2. The rate of population increase is 2.96% per year. Dakar accounts for only 0.28% of the national territory but 80% of the economic activities of Senegal are concentrated in this area (http://www.ansd.sn/).
To the east lies the region of Thies and the Atlantic Ocean surrounds the areas to the north, west, and south of Dakar (Figure 1). In our present study, we gathered leaves stored at the Cheikh Anta Diop University and collected from 1900 to 2003 by different botanists in the Dakar region. Figure 1 shows the locations of the collection sites. All leaves were sampled from deciduous trees. We thus can assume their 14C content represents a single year of atmospheric 14C activity. In this study, the tree leaves are used to determine the amount of atmospheric ∆14C and from these results the local Suess effect can be indirectly estimated using a mathematical model (Oeschger et al. Reference Oeschger, Siegenthaler, Schotter and Gugelman1975).
Population Growth
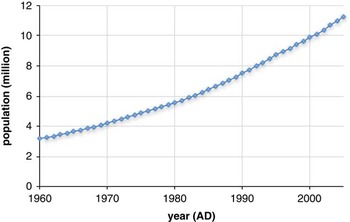
The region of Dakar developed quickly and without major planning due to the natural growth of its population and immigration. It is a major city in Africa—from 400,000 inhabitants in the 1970s, its population had grown to 3,139,325 by 2003, and it is now one of the largest cities on the continent (Dieng 2007). The population of Senegal was estimated to be 10,817,844 in 2005. The rate of annual increase was 2.7% between 1976 and 1988 and 2.4% between 1988 and 2002 (Figure 2).
Growth of the Senegalese population, according to the World Bank (2017) DataBank.

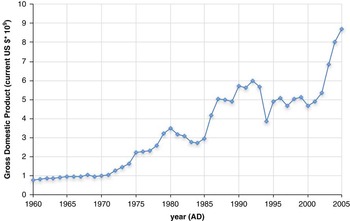
In the last general census (RGHAE) published in September 2014 (http://www.ansd.sn/), Dakar counted for nearly one quarter of the total population of Senegal (23.2% or 13,508,715 inhabitants) even though it encompasses only 0.3% of the total area of the country. Because of its high population density and extensive economic activities (80% of Sengal’s economic activities are based in Dakar) (Figure 3), Dakar is the primary source of CO2 emissions in this region.
Senegal GDP values, according to the World Bank (2017) DataBank.

Senegal’s overall climate is of the sub-desert tropical type, punctuated by wet summers and dry winters. However, the region of Dakar, which is located on the Atlantic Ocean, is characterized by a coastal microclimate. This microclimate is strongly influenced by maritime trade winds and the monsoon, which occur from November until June and from July until October in the directions N-NW and S-SE, respectively. According to the Köppen–Geiger climate classification system, the climate category is BSh (hot, low-latitude steppe, with a mean annual temperature >18°C). The average annual temperature in Dakar is 24.9°C. The hottest month of the year is October with an average temperature of 28.1°C. The average annual precipitation is approximately 469 mm.
MATERIAL AND METHODS
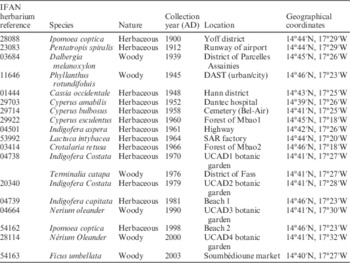
The leaf samples used in this study are from herbaceous and woody species, which were stored in the herbarium of the Botanical Laboratory at IFAN CAD. Twenty samples were collected based on their good state of conservation and the year of collection (Table 1).
Leaf species, collection site, collection year, and geographical location.

METHODS
Raw Data
Four herbaceous, dry-leaf samples (>10 g per sample) were treated at the 14C laboratory of IFAN CAD using the classic method. Each sample was washed in distilled water and treated with 0.5M HCl for 20 min; subsequently the samples were then subjected to 0.1M NaOH. Next, the samples were washed and dried at 30°C. To prepare for liquid scintillation spectrometry, dry samples were then directly added to lithium in the reactor of the synthesis bench and the reaction began at 800°C. After cooling of the reactor, the products [Li (OH)2, Li2C2] synthetized were hydrolyzed to produce acetylene, which was finally transformed into 2 g of benzene by a catalytic reaction at 50°C and then analyzed through the liquid scintillation counter (Tricarb 3170/TL). Samples were numbered with the lab code prefix DKxx (see Table 2).
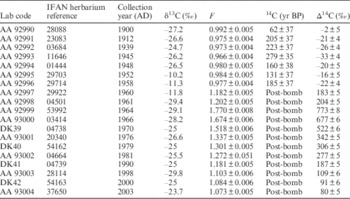
14C concentrations in tree leaves from the Dakar region, gathered AD 1900–2003.

For the remaining 16 samples, these were chemically treated at the 14C laboratory of LOCEAN (Paris VI) using standard combustion techniques to create CO2. The resulting CO2 was flame-sealed into a 6-mm glass tube and shipped for physical measurement at the NSF-Arizona AMS Laboratory. At the Arizona AMS lab, CO2 was graphitized and measured by accelerator mass spectrometry (AMS), as described by Jull et al. (Reference Jull, Burr, Beck, Hodgins, Biddulph, Gann, Hatheway, Lange and Lifton2006). Samples were numbered with the lab code prefix AA-xx (Arizona AMS), as shown in Table 2.
The 14C results are quoted in ∆14C, using the conventional notation (Stuiver and Polach Reference Stuiver and Polach1977) correcting for the age at collection, using Equation (1) for samples collected before AD 1950 and Equation (2) for samples collected after AD 1950, as follows:
 $$\Delta {}_{{}}^{{14}} C\,{\equals}\,1000\left( {Fe^{{\lambda \left( {1950{\minus}t} \right)}} {\minus}1} \right)$$
 $$\Delta {}_{{}}^{{14}} C\,{\equals}\,1000(Fe^{{\lambda \left( {t{\minus}1950} \right)}} {\minus}1)$$
Where λ is the decay constant 1.209×10⁻⁴ based on the half-life of 5730yr, t is the time of collection, and F is the fraction of modern carbon measured (Donahue et al. 1990).
Processed Data
The decrease in 14C concentration due to the local Suess effect can be estimated by using the mathematical equations of Levin et al. (Reference Levin, Kromer, Schmidt and Sartorius2003). According to Levin et al. (Reference Levin, Kromer, Schmidt and Sartorius2003), three components can be defined: a background component (a mixing ratio in a free troposphere, observed at a station) CO2bg, a regional biospheric component CO2bio, and a regional fossil fuel component CO2foss.
The 14C/C ratios of these components in Δ notation are respectively Δ14Cmeas, Δ14Cbg, Δ14Cbio, and Δ14Cfoss. For the calculation of the regional fossil fuel component CO2foss, the following two balance equations have been used, one for the CO2 mixing ratio and one for the 14C/C ratio [proportional to (1000+ Δ14Ci)]:
 $${\rm CO}_{{2{\rm meas}}} \,{\equals}\,{\rm CO}_{{2{\rm bg}}} {\plus}{\rm CO}_{{2{\rm bio}}} {\plus}{\rm CO}_{{2{\rm foss}}} $$
 $$\eqalignno{ {\rm CO}_{{2{\rm meas}}} \left( {1000 ‰{\plus}\Delta ^{{14}} {\rm C}_{{{\rm meas}}} } \right)\,{\equals}\, & {\rm CO}_{{2{\rm bg}}} \left( {1000‰{\plus}\Delta ^{{14}} {\rm C}_{{{\rm bg}}} } \right) \cr & {\plus}{\rm CO}_{{2{\rm bio}}} \left( {1000‰{\plus}\Delta ^{{14}} {\rm C}_{{{\rm bio}}} } \right) \cr & {\plus}{\rm CO}_{{2{\rm foss}}} \left( {1000‰{\plus}\Delta ^{{14}} {\rm C}_{{{\rm foss}}} } \right) $$
These equations are an approximation valid for samples with the similar δ13C source with ∆14Cfoss equal to –1000‰ and we can assume that ∆14Cbio is similar to ∆14Cbg. In this case, the combination of Equations (3) and (4) leads to this equation
 $$CO_{2 \,\,{foss}} \,{\equals}\,CO_{2} _{{bg}} {{\Delta ^{{14}} C_{{bg}} {\minus}\Delta ^{{14}} C_{{meas}} } \over {\Delta ^{{14}} C_{{bg}} {\plus}1000}}(ppm)$$
where CO 2bg is the concentration in clean air (ppm), Δ14 C bg is the 14C concentration in clean air (per mil), and Δ14 C meas is the 14C concentration in study area (per mil).
For the calculation of the CO 2foss and CO 2bg , Δ14 C bg , and Δ14 C meas values are needed.
As no background CO2 concentration for the 20th century is available for Dakar, we used the data from Mauna Loa Station in Hawaii (see Globalview-CO2 2003).
The comprehensive data for the whole century are not provided, so we used two distinct periods to represent the yearly mean 14C concentration values of “clean air.” For the period 1958–1976, the data on 14C concentration in “clean air” for NH zone 2 were used (Hua and Barbetti Reference Hua and Barbetti2004). To complete this period, the 14C concentration values in 1970 and 1976 corresponding to those for the Northern Hemisphere for the period from 1970 onward were added (Hua and Barbetti Reference Hua and Barbetti2004). The data from Schauinsland Station in Germany (Levin and Kromer 1997; Levin and Kromer Reference Levin and Kromer2004) are used for the period 1976–2003.
RESULTS AND DISCUSSION
Dakar City
Table 2 shows the details of the sampling sites, the name of the site where the leaves were collected, and geographical location (latitude, longitude). The species sampled are given in Table 1. The δ13C (‰) values are calculated are referenced to the PDB standard and listed for the period 1900–2003, except for samples measured at Dakar. In those cases, we assumed a value from the literature (Stuiver and Polach Reference Stuiver and Polach1977) for C3 plants of –25‰ to –29‰. Analyzing the measured δ13C values, we realized that there two types of plant leaves: the C4 plants with the following δ13C –10.2‰, –11.3‰, and –11.8‰, and the C13 plants with δ13C ranging from –23.7‰ to –29.8‰. All these δ13C values are included in the expected intervals.
Moreover, Table 2 shows variations of ∆14C in tree leaves from AD 1900 to 2003. These variations can be divided into different periods. First, we can observe that during the pre-bomb period between 1900 and 1958 that the ∆14C decreased from –2±5‰ to –22±4‰. This is due to the burning of fossil fuels (Druffel and Suess 2008; Suess 1955; Houtermans et al. Reference Houtermans, Suess and Oeschger1973). From 1958 to 1964, the ∆14C values increased to 773±8‰, corresponding to the period of the bomb testing causing a large increase in atmospheric 14CO2.
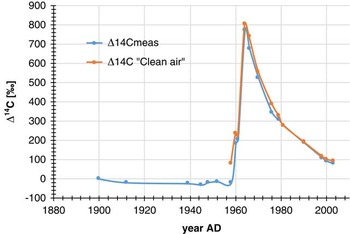
Atmospheric data from other sites (Nydal and Lovseth Reference Nydal and Lovseth1996) show a peak of 817±23‰ in 1964. Compared to our results, one can find a decrease of 50‰ relative to a “clean location” (Table 3). From 1964 to 2003, our data show a decrease in 14C activity over time (773±8‰ to 80±5‰). Our results generally track lower than the 14C variation curves (Figure 4) from 1960 to 2003 for region NH zone 2 (Hua and Barbetti Reference Hua and Barbetti2004; Hua et al. 2013) . This difference can be attributed to a local Suess effect as Dakar is a densely populated, industrialized area.
To estimate long-term changes in 14C concentration, an exponential decay function was fitted to the observed data from 1970 to 2003, giving a correlation coefficient R 2 of 0.99 with a mean life for decay of 16.1 yr (Rakowski et al. 2008). A linear function was fitted to the ∆14C data for the period 1970–2003, showing a decreasing rate of 12.3‰ (per year).
∆14C in tree leaves collected in Dakar city (blue curve, starting at left). The red curve (right) represents global ∆14C for NH zone 2 (Hua and Barbetti Reference Hua and Barbetti2004). (Colors refer to online version.)

Measurements of peak ∆14C in atmospheric CO2 recorded from various locations in NH zone 2.

Fossil Fuel Component
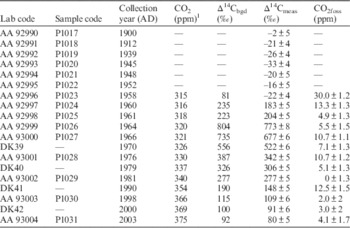
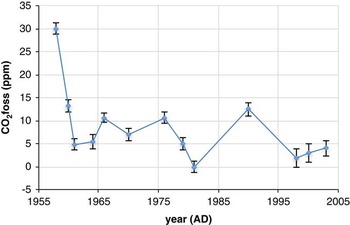
The fossil fuel component CO 2foss of the atmospheric CO2 concentration from 1958 to 2003 was calculated using Equation (5) with the results shown in Table 4. We also plot the time variation of these components are shown in Figure 3.
CO2 fossil values (ppm) from AD 1900–2003.

1 Globalview CO2 (2003).
The results showed large increase in the CO2foss component from 1958 to 1960, leading to the high values obtained: 30.1 ppm and 13.3 ppm, respectively. We know from Nydal and Lovseth (1983) that this period corresponds to nuclear weapons testing, which caused increases in the concentration of 14C in atmosphere. It is possible that these results are due to the fact that the samples collected in 1952–1960 are from C4 plants. Hence, it is possible that the different assimilation mode of atmospheric CO2 can account for this discrepancy, although this needs further investigation. These species are able to absorb CO2 by another enzyme (the phosphoenolpyruvate carboxylase or PEP carboxylase) and to form acids with 4 carbons (Li et al. 1998). These acids in C4 are going to accumulate in the cells of the bundle sheath, which are impermeable to gases. As a consequence, the decarboxylation of acids in C4 increases strikingly the concentration in CO2 within the plant. These properties can explain the differences of δ13C (–10.2; –11.3; –11.8) of these types of samples δ13C (–10.2; –11.3, –11.8) of these types of samples (Cyperus, herbaceous) with other samples which gave consistently lower apparent fossil CO2 components.
Analyzing the CO2foss variations from 1960–2003 (Figure 5), one can realize that from 1960 to 1976 the values are high (13.3±1.3 ppm to 5.5±1.3 ppm) with a mean value of 8.8 ppm while for the period from 1976 to 2003 the values are low (12.5±1.5 ppm to 0 ppm) with a mean of 4.4 ppm. However, we noticed that a high value of 12.5 ppm was obtained in 1990.
Values of the fossil fuel component CO2foss (ppm) calculated using ∆14C in tree leaves from the Dakar region.

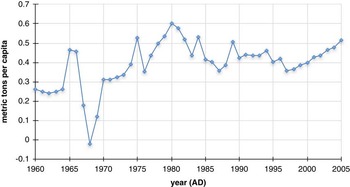
By the formal comparision of the fossil fuel CO2foss variation curve to the one of the World Bank Group concerning Senegal (Figure 6) one can see that the trends of the curves are similar even if the drop of the values from 1960 to 1961 is big in our case. For the period 1960–1976, we see a variability in the fossil values (Figure 5) with a mean value of 8.8 ppm. These values are still high compared with the additional fossil fuel contribution at Schauinsland, which is only 1.4 ppm (Levin and Kromer Reference Levin and Kromer2004; Levin et al. Reference Levin, Hamer, Kromer and Meinhardt2008). This shows the fossil-fuel CO2 addition by the Dakar region. From 1961 to 1966 the values increased from 4.9 ppm to 10.7 ppm, an increase of around 120%, comparable to 133% obtained from the World Bank data during the same time period (Figure 6). From 1966 to 1970 a decrease is noted with 34% for the calculated values and 30% for estimated CO2 emissions. From 1970 to 1976 an increase of 14% with the data of World Bank data is less than the calculated value, which is 51%. On the other hand from 1976 to 1981 our values decrease when those of the World Bank data increase. On the contrary, concerning the period from 1981 to 1990, the values increase when those of the World Bank data decrease. From 1990 to 1998 a dimunition of 80% for the calculated values against 13% from the World Bank data is noted. From 1998 to 2003 the increase of CO2foss values is 11% while to one obtained from the World Bank data is 20%.
CO2 emissions (metric tons per capita) according to the World Bank (2017) DataBank.

One can say that the variations in general of the calculated fossil fuel CO2 emissions are coherent with those of the World Bank data excepted in the intervals of 1976–1981 and 1981–1990.
CONCLUSION
Δ14C measurements in tree leaves collected from the urban area of Dakar in 1900–2003 are systematically lower than values measured in “clean air,” which is due to anthropogenic CO2 emissions from fossil fuel use. For the period 1970–2003, data are fitted with an exponential and linear curve of the decline of the combined 14C signal, which gave more consistent values of decreasing rate and decay constants. The fossil fuel component was estimated and the values are slightly high, with a mean of 8.8 ppm for 1960–1976. From 1976 to 2003 the values are low with a mean of 4.4 ppm. This method provides a valuable environmental monitoring tool and could be compared to other urban data. These results show that the variations of CO2 emission from fossil fuel are consistent with the World Bank data for this region, however, for some years anomalous values occur (periods of 1976–1981 and 1981–1990) and these need to be corrected by knowing the background level of the atmospheric CO2. For better understanding and evaluation of the effects caused by emission of CO2 from fossil fuel, we need to develop a local carbon cycle model. In addition, new sampling should be done monthly and during the two distinct seasons (dry and rainy), and a long-term record is needed to get better estimates of changes in fossil fuel CO2 values.
ACKNOWLEDGMENTS
This work was supported by the Botanic Department of the Faculty of Science (Cheikh Anta Diop University, Dakar) and the radiocarbon laboratory of IFAN ChA Diop of UCAD. We wish to express our thanks to the Paris Museum team (France) and to the late J F Saliège (LOCEAN, Paris IV, France) for his constant help, and to Mitzi de Martino of the Arizona radiocarbon laboratory for assistance in 14C measurements. In particular, my thanks go to Dr Tim Jull (University of Arizona AMS-Radiocarbon Laboratory, USA) for his assistance in terms of language and of content made in this paper. Our thanks also go to associate editor Christine Hatté (LSCE, Gif sur Yvette-Paris, France) for giving a great deal of assistance for this paper, and we also thank reviewer Felix Vogel. Many thanks also go to Alpha Oumar Diallo of the IFAN 14C laboratory (Cheikh Anta Diop, Dakar) for his valuable help in 14C measurements.