INTRODUCTION
Mechanisms underlying the spatial distribution of trees are a source of debate (Hyatt et al. Reference HYATT, ROSENBERG, HOWARD, BOLE, FANG, ANASTASIA, BROWN, GRELLA, HINMAN and KURDZIEL2003) and with increasing research has come a heightened appreciation of the complexity of the process (Corlett Reference CORLETT2011, Muller-Landau et al. Reference MULLER-LANDAU, WRIGHT, CALDERON, CONDIT and HUBBELL2008). In addition to the quality and quantity of seeds dispersed by a primary seed disperser (Schupp Reference SCHUPP1993), several variables alter this seed shadow, including effects of seed handling (Murray et al. Reference MURRAY, RUSSELL, PICONE, WINNETT-MURRAY, SHERWOOD and KUHLMANN1994, Traveset et al. Reference TRAVESET, RIERA and MAS2001, Vander Wall & Beck Reference VANDER WALL and BECK2012), secondary dispersal and predation (Chapman Reference CHAPMAN1989, Forget & Milleron Reference FORGET and MILLERON1991, Nathan & Casagrandi Reference NATHAN and CASAGRANDI2004, Nogales et al. Reference NOGALES, NIEVES, ILLERA and TRAVESET2007), niche availability (Clark et al. Reference CLARK, PALMER and CLARK1999, Condit et al. Reference CONDIT, ASHTON, BUNYAVEJCHEWIN, DATTARAJA, DAVIES, ESUFALI, EWANGO, FOSTER, GUNATILLEKE, GUNATILLEKE, HALL, HARMS, HART, HERNANDEZ, HUBBELL, ITOH, KIRATIPRAYOON, LAFRANKIE, LAO, MAKANA, NOOR, KASSIM, RUSSO, SUKUMAR, SAMPER, SURESH, TAN, THOMAS, VALENCIA, VALLEJO, VILLA and ZILLIO2006) and distance- and density-dependent effects (Balcomb & Chapman Reference BALCOMB and CHAPMAN2003, Clark & Clark Reference CLARK and CLARK1984, Connell Reference CONNELL, Boer and Gradwell1971, Harms et al. Reference HARMS, WRIGHT, CALDERÓN, HERNÁNDEZ and HERRE2000, Hyatt et al. Reference HYATT, ROSENBERG, HOWARD, BOLE, FANG, ANASTASIA, BROWN, GRELLA, HINMAN and KURDZIEL2003, Janzen Reference JANZEN1970). Given the number and potential impact of distance- and density-dependent survival variables, adult plant distributions are not typically expected to reflect primary seed shadows (Balcomb & Chapman Reference BALCOMB and CHAPMAN2003, Howe & Smallwood Reference HOWE and SMALLWOOD1982).
Research aimed at detecting the effect of primary seed dispersal on adult tree distributions has involved comparing primary dispersal modes to adult tree distributions (Condit et al. Reference CONDIT, ASHTON, BAKER, BUNYAVEJCHEWIN, GUNATILLEKE, GUNATILLEKE, HUBBELL, FOSTER, ITOH, LAFRANKIE, LEE, LOSOS, MANOKARAN, SUKUMAR and YAKAMURA2000, Hubbell Reference HUBBELL1979, Levine & Murrell Reference LEVINE and MURRELL2003, Seidler & Plotkin Reference SEIDLER and PLOTKIN2006) and has revealed intriguing, but conflicting, patterns. Working in a tropical dry forest in Costa Rica, Hubbell (Reference HUBBELL1979) found that animal-dispersed species were more aggregated than abiotically dispersed species. Similarly, Condit et al. (Reference CONDIT, ASHTON, BAKER, BUNYAVEJCHEWIN, GUNATILLEKE, GUNATILLEKE, HUBBELL, FOSTER, ITOH, LAFRANKIE, LEE, LOSOS, MANOKARAN, SUKUMAR and YAKAMURA2000) found that seedlings and adults of animal dispersed species in a Panamanian forest were more clumped than abiotically dispersed species. In contrast, measuring aggregation parameters in Panama and in Malaysia, Seidler & Plotkin (Reference SEIDLER and PLOTKIN2006) found the opposite; abiotically dispersed tree species were more aggregated than animal-dispersed species. This approach is advantageous in that it allows for the comparison of several tree species exhibiting multiple dispersal phenotypes; however, the comparison of dispersal mode with tree spatial distributions is limited because it assumes that dispersal mode is a consistent predictor of primary dispersal patterns (Levine & Murrell Reference LEVINE and MURRELL2003). Caution should also be used in interpreting results because different indices of aggregation were used in different studies, and because the spatial distribution of microhabitat variables in study regions may differ.
An alternative approach for determining how primary dispersal impacts tree distributions involves directly comparing dispersal kernels with tree spatial distributions (Levine & Murrell Reference LEVINE and MURRELL2003) and some studies have convincingly linked biotically generated primary dispersal patterns with tree distributions (Julliot Reference JULLIOT1997). For example, Russo & Augspurger (Reference RUSSO and AUGSPURGER2004) found that aggregated dispersal patterns produced by a single primate disperser species in a Peruvian forest are similar to aggregated adult tree distributions. However given the high diversity of dispersers per tree in most tropical forests (Loiselle et al. Reference LOISELLE, BLENDINGER, BLAKE, RYDER, Dennis, Schupp, Green and Westcott2007), primary dispersal from one disperser source may be confounded by seeds deposited from multiple sources.
Here we test the hypothesis that initial spatial seed dispersal patterns are concordant with the spatial pattern of adult trees (Levine & Murrell Reference LEVINE and MURRELL2003). Specifically, we compare the spatial distribution of adults of a dioecious angiosperm (Genipa americana Linnaeus, 1754) to the seed shadow produced by its key primary disperser, the white-faced capuchin monkey (Cebus capucinus Linnaeus, 1758) in a tropical dry forest in Santa Rosa National Park, Costa Rica (Sorensen & Fedigan Reference SORENSEN and FEDIGAN2000). We predict that seeds and trees will be similarly spatially aggregated at this site, due to the limited seed disperser community at this site for this plant species, and based on the findings of similar aggregations in monkey-produced seed-dispersal patterns and adult tree distributions at other sites (Balcomb & Chapman Reference BALCOMB and CHAPMAN2003, Russo & Augspurger Reference RUSSO and AUGSPURGER2004).
METHODS
Data collection
Genipa americana fruits in the early wet season (May–June). Fruits that are not removed from the tree, remain on the tree for up to 1 y. The seed size (mean = 7.98 mm × 5.72 mm, n = 200) and tough exocarp (Enquist & Sullivan, unpubl. data) of G. americana preclude all arboreal primary dispersers but white-faced capuchin (Cebus capucinus), spider monkey (Ateles geoffroyi Kuhl, 1820) and possibly coati (Nasua narica Linnaeus, 1766) from accessing the seeds. However, the coati is very uncommon in this forest fragment and during 24 h of continuous observation of G. americana, no coati was observed. The short canopy height of this forest prevents Ateles geoffroyi from ranging within it, leaving C. capucinus the key primary disperser of G. americana in this area. Capuchin groups have been present in the area for at least 40 y (Fedigan et al. Reference FEDIGAN, FEDIGAN and CHAPMAN1985) and at the time of the study only a single group of 19 individuals used the area. This allowed for a direct comparison of the seed shadow, including seed treatment, produced by a key primary disperser and the spatial distribution of this tropical forest tree.
Two observers recorded the dispersal of G. americana seeds by the capuchin during focal animal follows (mean = 463 min, n = 50) of all adults over two early wet seasons (May–July, 2005 and 2006). The duration of fruit-feeding events was recorded and when visibility was of high quality seed treatment was determined. The location of each focal animal defecation (n = 248) was recorded using a GPS (Garmin Gecko; accuracy of 10 m). Dispersal distance was determined by estimating distance from a defecation site to an adult tree visited within the range of capuchin gut passage time (Valenta & Fedigan Reference VALENTA and FEDIGAN2010) using recorded waypoints in ArcGIS V9.3. In cases where two consecutive defecations from the same parent tree were observed, these distances were also calculated. Faecal samples containing G. americana seeds (n = 78) were returned to the laboratory, where seeds were counted, inspected for damage, and planted to evaluate germination (Valenta & Fedigan Reference VALENTA and FEDIGAN2009).
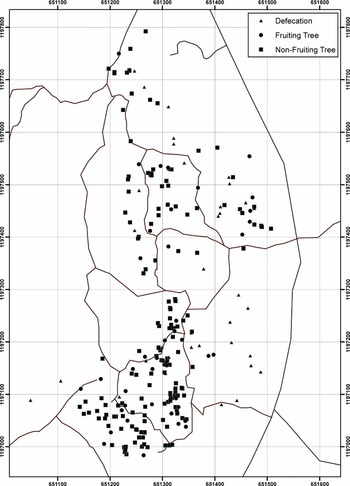
To record the locations of fruiting G. americana trees within a 60-ha plot of the 103 ha of the home range of the group, five observers walked in straight lines within sight of one another, and when a tree was located, each tree > 5 cm dbh was measured, its location determined, and the presence of fruits noted (Figure 1). To determine whether secondary dispersal or predation of fruits occurs, we placed 20 ripe, intact, and marked fruits beneath the canopies of three fruiting trees, and monitored them weekly for 2 mo directly under the canopy, as well as within a 10-m radius of the canopy edge, recording the presence of the 20 marked fruits, as well as any fruit movement.
Map of study area in Santa Rosa National Park, Costa Rica, showing locations of fruiting and non-fruiting Genipa americana trees >5 cm dbh, and early wet season defecations. Brown lines represent researcher trails, black lines represent access roads.

To determine the extent of secondary seed dispersal and/or predation, we placed piles of 10 G. americana seeds collected from capuchin defecations (n = 200) in 20 locations at various distances from parent trees (range = 50−580 m) and nearest fruiting conspecific trees (range = 3−210 m). We monitored seeds 3 d after deposition and every 7 d thereafter until the end of the study, and recorded all cases of disappearance and germination.
Nearest neighbour and MRPP analyses
We analysed the spatial distributions of adults (n = 202) and all early wet-season defecations independently first by calculating nearest neighbour values of both in ArcGIS V9.3. Nearest neighbour values represent the average distance between each adult tree and the nearest early wet-season defecation. Next we used Multi-Response Permutation Procedures, MRPP in the program Blossom (Mielke & Berry Reference MIELKE and BERRY2001; 10000 permutations) to determine whether there were differences in these clustering patterns. The MRPP compares intragroup average distances with the average distances that would result from all possible combinations of the data under the null hypothesis that the distribution of trees and defecations are not different. This allowed a direct comparison of adult tree and defecation patterns in order to determine whether intra-group distances were significantly different.
Spatial distributions of adult Genipa americana and all early wet-season defecations
We analysed the spatial distributions of adults (n = 202) and all early wet-season defecations (n = 248) with multiple statistical measures in order to characterize different aspects of the spatial structure of these point patterns. First, we calculated nearest neighbour values of both datasets in ArcGIS V9.3. Second, we calculated both the cumulative (D(r)) and the non-cumulative (g(r)) univariate summary statistics. The univariate distribution function of the nearest neighbour distances, D(r) is a non-cumulative normalized neighbourhood density function that can be interpreted as the probability that the average adult tree has its nearest neighbouring adult tree within radius r (or alternatively, the probability that the average defecation has its nearest neighbouring defecation within radius r). The univariate, non-cumulative normalized neighbourhood density function g(r) describes the expected density of either trees or defecations at distance r, divided by the mean density of trees or defecations in the study area (Wiegand et al. Reference WIEGAND, HUTH and MARTINEZ2009). Both of these statistics were used to test for departures from null models of complete spatial randomness (CSR), as the use of these two statistics together holds increased power to characterize variation in spatial patterns (Wiegand et al. Reference WIEGAND, HE and HUBBELL2013). Third, we calculated a pair-correlation function, L(r). L(r) is the non-cumulative version of the more commonly used K-function, that removes the scale dependence of K for independent patterns and stabilizes the variance (Besag Reference BESAG1977, Wiegand & Moloney Reference WIEGAND and MOLONEY2014). It offers the advantage over the K-function of being able to isolate aggregation or dispersion at specific distance classes by analysing point densities within rings of a specified width (in our case 10 m) extending from a given point. Thus, while the K-function gives the number of expected points within a given distance of a typical point, the pair-correlation function can be interpreted as the expected number of points at a given distance from a typical point. This value is then normalized by the intensity of points within the study area. We used 199 simulations of our null model of CSR to generate simulation envelopes using the software Programita (Wiegand & Moloney Reference WIEGAND and MOLONEY2004, Reference WIEGAND and MOLONEY2014), where the top envelope signified the top 2.5% of simulations and the bottom envelope signified the bottom 2.5% of simulations. Departure outside of the simulation envelopes at a particular distance signifies departure from the null model at that distance. A goodness-of-fit test (Loosemore & Ford Reference LOOSEMORE and FORD2006) was used to determine overall departure from the null model over all distance classes (1–50 m). For all analyses, the study area is comprised of the smallest rectangle that encompasses all of the data points.
Characterization of seed dispersal
We assessed an index of effective seed dispersal as the distance of seed deposition relative to the nearest fruiting conspecific tree with longer distance being considered more effective. To do this, we utilized bivariate versions of the point-pattern analyses described above (L(r), D12(r) and g12(r)) to determine if the defecations with seeds that fell within the plot (N = 36) were clustered around fruiting trees (n = 45). It is important to note that we map and analyse defecations containing seeds, and on average defecations contained more than a single seed. In these bivariate analyses, our null model of independence used an antecedent condition in which G. americana tree locations were fixed and the defecations were allowed to vary around trees according to a toroidal shift null model that preserves the underlying geometry of the defecation point pattern (Getzin et al. Reference GETZIN, WIEGAND and HUBBELL2014).
RESULTS
All G. americana fruits placed beneath fruiting tree canopies were removed by the end of the study. Over 40% of the C. capucinus early wet-season (May–July) diet was comprised of G. americana fruits; an order of magnitude higher than the next most consumed species. In 92% of cases (n = 101), seeds were swallowed whole and no instance of seed destruction was observed. Capuchins dispersed an average of 17 G. americana seeds per defecation (range = 1–93, SD = 16.3, n = 78). Of the 200 seeds placed in experimental plots, 3% (n = 7) remained at the end of the study, all of which germinated within 14 d of deposition. It is possible that some seeds were safely re-deposited, while the majority were likely preyed upon.
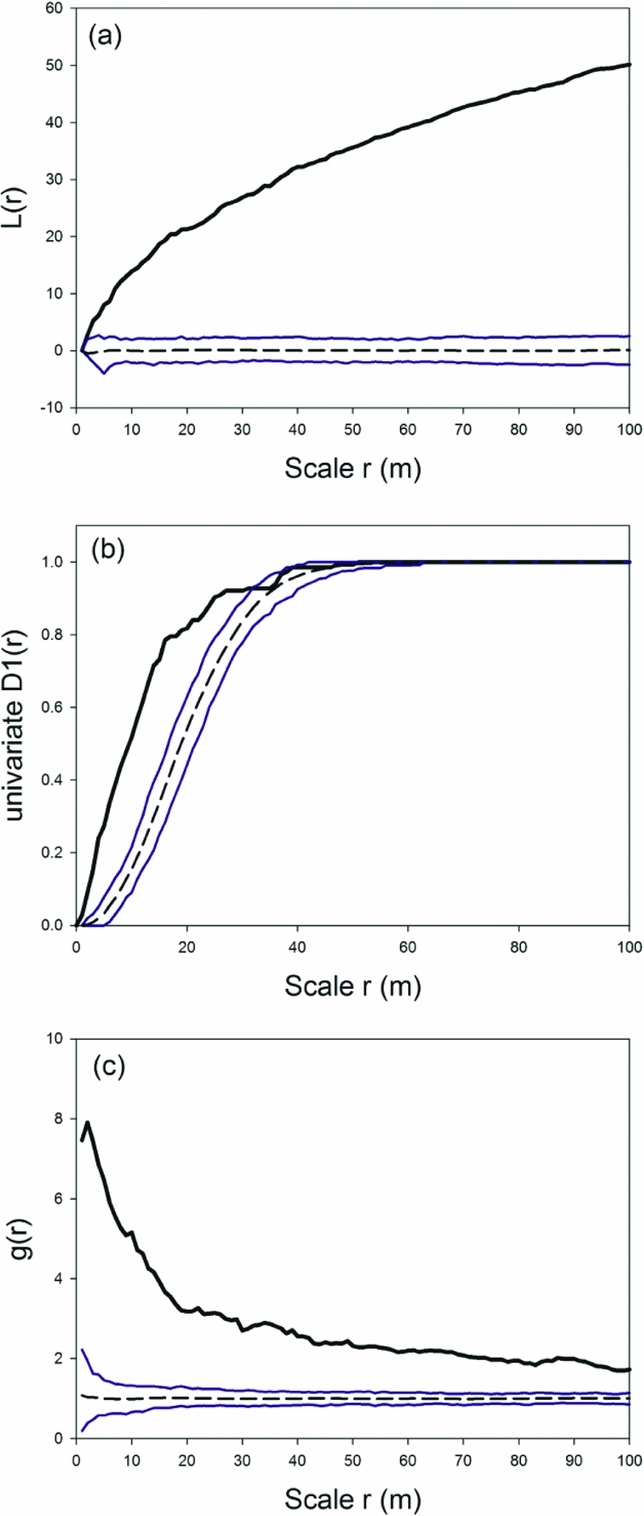
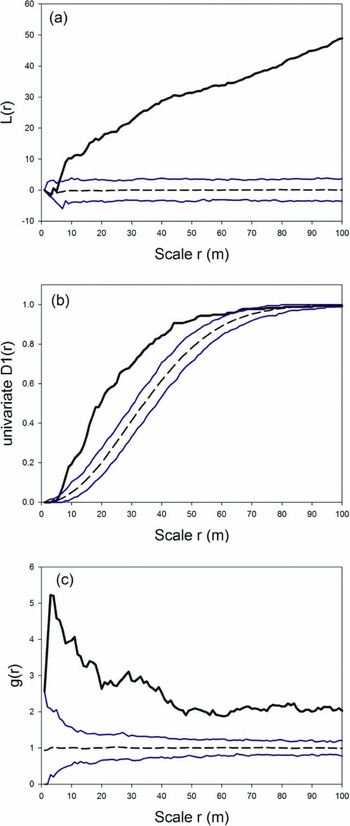
Capuchin defecation patterns were clustered with a mean distance between nearest neighbours of 23 m (Nearest Neighbour Index: 0.69, P < 0.001, Z = −9.33, see also Figure 3b). Genipa americana trees were also clustered, with a mean distance between nearest neighbours of 11.5 m (Nearest Neighbour Index: 0.63, P < 0.001, Z = −10.1, Figure 2b). All G. americana trees had at least one nearest neighbour within 40 m, while only 80% of defecations had a nearest neighbour within this distance. Significant clumping of both point patterns occurs across all distances tested (Figure 2, G. americana GofF: P < 0.001, Figure 3, wet-season defecations GofF: P < 0.001). Differences in mean distances between trees and mean distances between defecations were significant (MRPP: −13.95, P < 0.001).
Results of L(r) (a), D(r) (b) and g(r) (c) univariate functions, showing that all adult Genipa americana trees in the study plot in Santa Rosa National Park, Costa Rica, are significantly clustered. The large-scale clustering shown in this figure is due to large areas of the sample plot without adult individuals. Solid black lines represent observed distributions, solid blue lines represent confidence envelopes, dashed black lines represent expected distributions under the null model of complete spatial randomness.
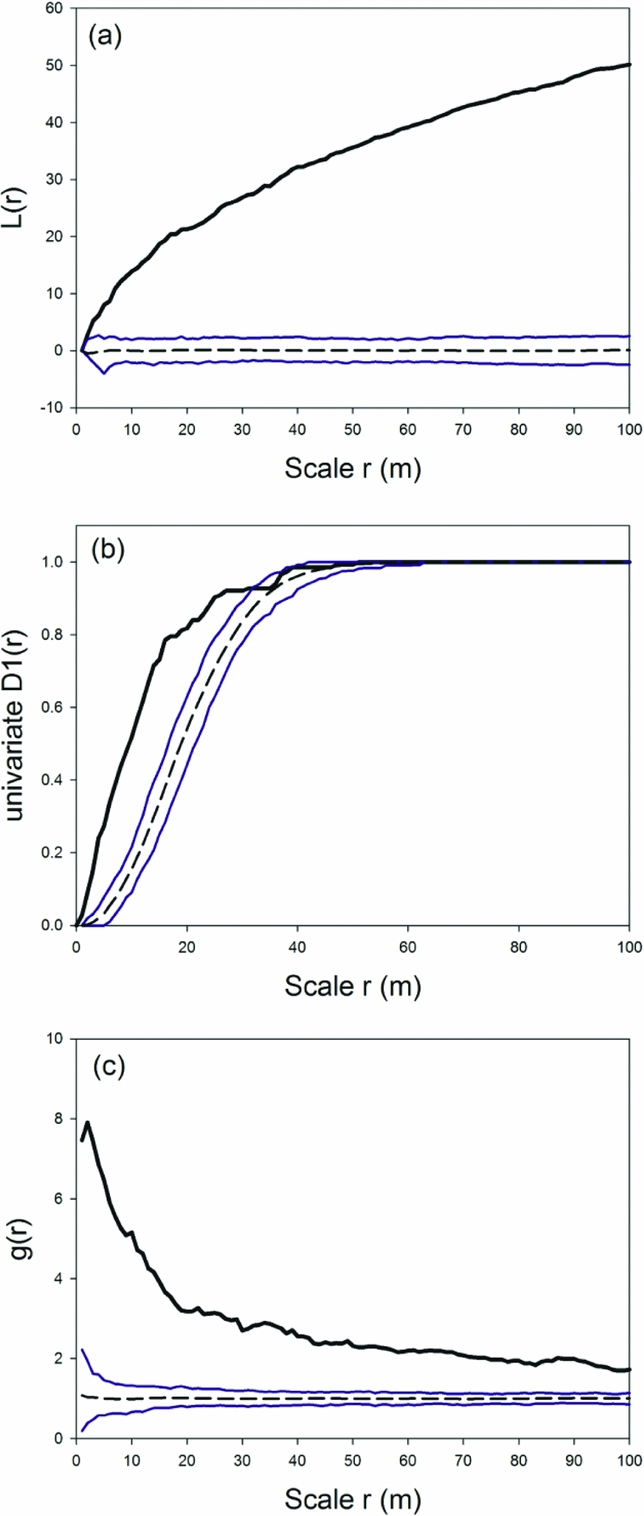
Results of L(r) (a), D(r) (b) and g(r) (c) univariate functions, showing that all early wet season defecations in the study plot in Santa Rosa National Park, Costa Rica, are significantly clustered. Solid black lines represent observed distributions, solid blue lines represent confidence envelopes, dashed black lines represent expected distributions under the null model of complete spatial randomness.

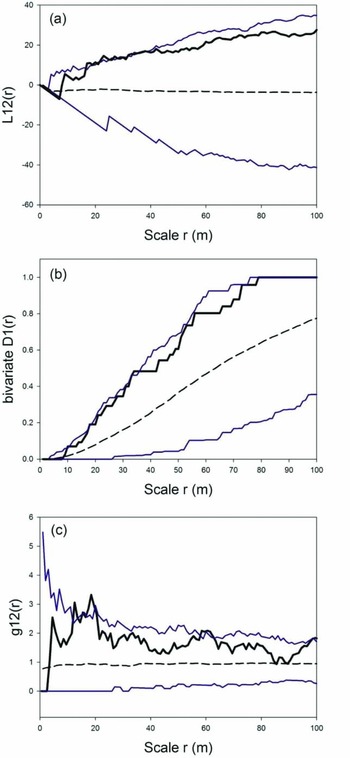
Capuchins defecated G. americana seeds an average of 257 m from parent trees (range = 18–608, n = 73), with an average of 52 m from fruiting G. americana trees (range = 7.74–115, SD = 32.4, n = 36). Both spatial summary statistics indicated greater aggregation than expected by the null model of independence, with pair-correlation function tests indicating significant departures from the null model at several distances (Figure 4). Specifically, there were greater numbers of defecations than expected at 13, and between 16 and 19 m from fruiting G. americana trees, with the greatest departure from the null model occurring at 18 m (g(r)). However, while significant departures from the null model occurred at several distances, bivariate distributions did not reflect overall departure from the null model of independence across all distances tested (1–50 m, D12(r) GofF: P = 0.075, g12(r) GofF: P = 0.085).
Results of L(r) (a), D(r) (b), and g(r) (c) bivariate functions indicating greater numbers of early wet season defecations than expected at 13, and between 16 and 19 m from fruiting Genipa americana trees in the study plot in Santa Rosa National Park, Costa Rica. Solid black lines represent observed distributions, solid blue lines represent confidence envelopes, dashed black lines represent expected distributions under a toroidal shift null model.

DISCUSSION
Our data demonstrate that the seed shadow produced by this mammalian seed disperser, thought to be the most important disperser for G. americana, is significantly clustered, as is the pattern of adult trees, despite documented distance- and density-dependent mortality, and high rates of secondary seed removal and predation (Chapman Reference CHAPMAN1989, Valenta & Fedigan Reference VALENTA and FEDIGAN2009, Reference VALENTA and FEDIGAN2010). White-tailed deer (Odocoileus virginianus Zimmerman, 1780) and tapir (Tapirus bairdii Gill, 1865) are present at this site and capable of secondarily dispersing such seeds, while agouti (Dasyprocta punctate Linnaeus, 1758), collared peccary (Tayassu pecari Link, 1795), and rodents are probably seed predators (Janzen & Martin Reference JANZEN and MARTIN1982). Seed and tree spatial aggregation at this site is consistent with findings of aggregation in monkey-produced seed-dispersal patterns and adult tree distributions at other sites (Balcomb & Chapman Reference BALCOMB and CHAPMAN2003, Russo & Augspurger Reference RUSSO and AUGSPURGER2004).
It is possible that seed dispersal and tree distribution patterns are similar due to animal dispersers trap-lining fruiting adults of the same species (Dew & Wright Reference DEW and WRIGHT1998). In cases where certain species are heavily exploited, as in the case of G. americana, trap-lining can result in the massive deposition of seeds near or beneath conspecific trees. Here, despite the importance of G. americana in the diet of C. capucinus, the effective seed dispersal distance averaged 52 m (range = 7–115 m, SD = 32.4 m, n = 36) indicating that the high presence of G. americana in their diet – and the resultant increase in time spent at fruiting G. americana trees at this time – is not driving similarities in distribution patterns. Additionally, defecations containing G. americana seeds are most clumped relative to fruiting trees at a spatial scale of 18 m, and over the course of the study no G. americana seeds were seen to be dispersed by monkeys directly beneath fruiting G. americana trees. It is important to note that adult trees represent patterns that result after multiple years of seed deposition. Alternatively, adult tree distribution patterns could be driven by the spatial distribution of microhabitat variables.
Negative density- and distance-dependent mortality can thin seed and seedling clumps between transitional stages (Augspurger Reference AUGSPURGER1983). Thinning of the primary seed shadow is expected in Santa Rosa National Park because post-dispersal mortality is high and shows negative density-dependence (Valenta & Fedigan Reference VALENTA and FEDIGAN2010). Interestingly, G. americana trees are more significantly clustered than capuchin defecations. This suggests that while post-dispersal thinning may influence adult tree distributions at this site, it is not the only important factor influencing adult spatial distributions.
Negative density- and distance-dependent seed, seedling and sapling mortality has been demonstrated for numerous plant species (Harms et al. Reference HARMS, WRIGHT, CALDERÓN, HERNÁNDEZ and HERRE2000). Despite negative density-dependence of G. americana seeds and seedlings at this site (Valenta & Fedigan Reference VALENTA and FEDIGAN2010), high rates of secondary seed dispersal and predation (Chapman Reference CHAPMAN1989), and high effective seed dispersal distances, the spatial pattern of G. americana seed dispersal produced by a key vertebrate disperser is apparently influencing the aggregated spatial distributions of adult trees.
ACKNOWLEDGEMENTS
We thank the staff of the Area de Conservacion Guanacaste, especially R. Blanco Segura, for permission to research in the park. We are grateful to E. Murillo-Chacon and G. McCabe for contributions in the field, and to Dr K. Bannar-Martin, D. Sarkar, G. Laird, T.S. Steffens, G. Bridgett and C. Toborowsky for technical support. We thank the Province of Alberta and University of Calgary (KV) and an NSERC Discovery Grant (LMF) for funding. All research was conducted in accordance with the protocols approved by the University of Calgary (Protocol # B108R-03). All necessary permits were obtained for the described field studies from the Government of Costa Rica and the administration of Santa Rosa National Park, and all research adhered to the national laws of Costa Rica.