INTRODUCTION
High-resolution geomagnetic records carry crucial information about Earth's deep interior and functioning of geodynamo. The full vector data (declination, inclination, and intensity) have been obtained from geomagnetic observatories since the beginning of the nineteenth century, yielding only a limited perspective of geomagnetic field fluctuations. In order to reveal the spatial and temporal variations of Earth's magnetic field (EMF) prior to instrumental measurements, burned archaeological artifacts and volcanic rocks, carrying a thermoremanent magnetization, are generally used. Available archaeomagnetic data from South America are still sparse and of dissimilar quality. The whole region contributes less than 7% to the global database (Brown et al., Reference Brown, Donadini, Nilsson, Panovska, Frank, Korhonen, Schuberth, Korte and Constable2015; Poletti et al., Reference Poletti, Trinidade, Hartmann, Damiani and Rech2016). This makes it almost impossible to define any long-term tendency about the variation of the geomagnetic field strength. The regional particularities should also be considered since the studied area belongs to the magnetically complex South Atlantic Magnetic Anomaly, with a very low (more than one-third of the expected field) surface magnetic field (Hartmann and Pacca, Reference Hartmann and Pacca2009). Because of marked regional anomaly, it is expected that the geomagnetic records through archaeological and geological periods are rather different than those from similar curves from Europe and Asia, at least for some specific time intervals. Thus, the estimation of the geomagnetic field evolution over archaeological time periods for the great part of South America is of great importance.
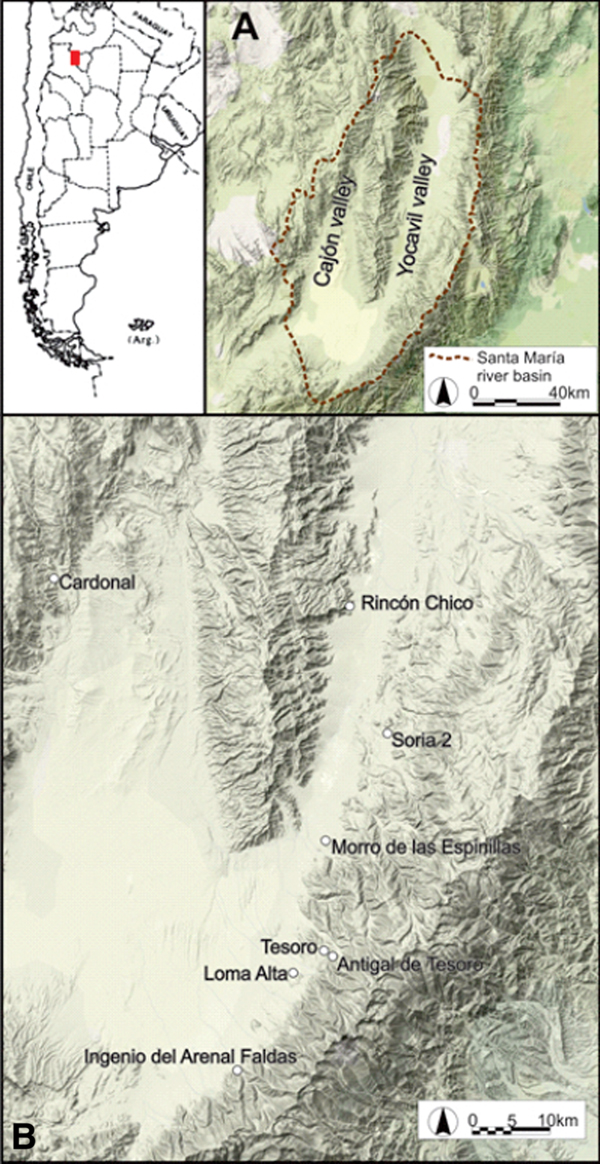
The pioneering studies carried out since the early 1960s may only have historical character since no high-standard, absolute archaeointensity methods were applied (Nagata et al., Reference Nagata, Kobayashi and Schwarz1965; Kitizawa and Kobayashi, Reference Kitizawa and Kobayashi1968). In the last decade, however, many high-resolution studies were reported from Brazil (Hartmann et al., Reference Hartmann, Genevey, Gallet, Trindade, Etchevarne, Le Goff and Afonso2010, Reference Hartmann, Genevey, Gallet, Trindade and Le Goff2011; Poletti et al., Reference Poletti, Trinidade, Hartmann, Damiani and Rech2016), but the obtained record is limited to the last 500 yr. In Argentina, the first archaeomagnetic studies were carried out on obsidian objects to establish the provenance of source material (Vásquez et al., Reference Vásquez, Nami and Rapalini2001). On the one hand, some fragments of Late Holocene ceramics (with associated radiocarbon dating from 1640 to 730 14C yr BP) were analyzed for the wetland region of the lower Paraná basin, and some others from the Catamarca area (Goguitchaichvili et al., Reference Goguitchaichvili, Greco and Morales2011, Reference Goguitchaichvili, Loponte, Morales and Acosta2012), with similar results to those obtained in southern Brazil, but far from what is expected from global models (Pavón-Carrasco et al., Reference Pavón-Carrasco, Osete, Torta and De Santis2014). Thus, it is absolutely critical to obtain more high-quality determinations supported by numerical dating. In the present study, we analyze 98 samples (21 potsherds) belonging to different archaeological sites (Fig. 1) from northwest Argentina, unambiguously correlated to the available radiometric ages ranging between 1940–114014C yr BP.
(color online) (a) General context of study area along the Santa María river basin. (b) Location of archaeological sites analyzed in this study.

Despite the great archaeological and cultural heritage, no reference paleosecular variation curve (PSVC) for South America is yet available. The principal objective of this investigation is to retrieve the past evolution of the geomagnetic field strength beyond the observatory records. This investigation attempts to build an absolute geomagnetic intensity variation curve for the great part of South America during the last two millennia analyzing some well-dated, burned archaeological artifacts from Argentina, Chile, Brazil, Bolivia, and Peru.
ARCHAEOLOGICAL CONTEXT AND SAMPLE DETAILS
The study area comprises the Santa María river basin (Fig. 1), which is part of the Calchaquí Valleys, a series of long valleys with a general north-south orientation, located in northwestern Argentina and belonging to the Sierras Pampeanas Megastructure (Tineo, Reference Tineo2005; Paoli et al., Reference Paoli, Ledesma, Elena, Mosciaro and Noe2011). Archaeological investigations in the region began at the end of the nineteenth century, having produced until now an important number of published data and collections of different artifacts. Over the last two decades, systematic works have been carried out at numerous locations, including cemeteries and housing and manufacturing spaces, covering a much longer temporal range than that of the archetypal late pre-Hispanic populated centers (for some up-to-date reviews see Williams, Reference Williams2003, Reference Williams, Albeck, Scattolin and Korstanje2010; González and Tarragó, Reference González and Tarragó2005; Tarragó and González, Reference Tarragó and González2005, Reference Tarragó, González, Myriam Tarragó and González2008; Scattolin, Reference Scattolin, Williams, Ventura, Callegari and Yacobaccio2007, Reference Scattolin, Albeck, Scattolin and Korstanje2010; Scattolin et al., Reference Scattolin, Cortés, Bugliani, Calo, Domingorena, Izeta and Lazzari2009, Reference Scattolin, Bugliani, Pereyra Domingorena, Cortés, Lazzari, Izeta, Calo, Korstanje and Lazzari2015).
The most critical issue during any archaeomagnetic survey is the unambiguous relationship between the sample (in our case, pottery fragments) and the associated radiometric dating (Goguitchaichvili et al., Reference Goguitchaichvili, García-Ruiz, Pavón-Carrasco, Morales Contreras, Soler-Arechalde and Urrutia-Fucugauchi2018). Thus, we selected only samples with available radiocarbon ages and well-constrained archaeological context. Moreover, in each case we applied the so-called degree-certainty (see Goguitchaichvili et al., Reference Goguitchaichvili, García-Ruiz, Pavón-Carrasco, Morales Contreras, Soler-Arechalde and Urrutia-Fucugauchi2018) test to judge the sample-events (S-E) association, as described by Waterbolk (Reference Waterbolk1983): (A) full certainty, sample and events constitute the same archaeological object; (B) high probability, direct functional relation between the organic material (sample) and the diagnostic archaeological findings; (C) medium probability, no functional relation, but the context argue in favor of their association; or (D) reasonable possibility, unclear association in the same sedimentary matrix.
Also important is the association with pottery: four degrees of association between dates and pottery (D-P) are recognized (Greco and Palamarczuk, Reference Greco and Palamarczuk2014; Goguitchaichvili et al., Reference Goguitchaichvili, García-Ruiz, Pavón-Carrasco, Morales Contreras, Soler-Arechalde and Urrutia-Fucugauchi2018): (I) high probability, direct functional relation between the ceramics and the dated events; (II) medium probability, fragments with high degree of reassembly associated with an occupational floor; (III) reasonable possibility, fragments dispersed in the sedimentary matrix, or even over an occupational floor, but in scarce quantity; or (IV) insignificant association, low and unclear presence of ceramic material.
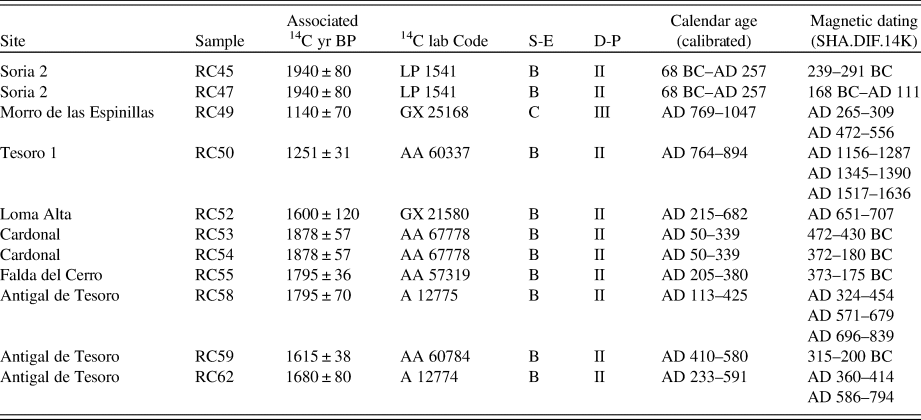
Both S-E and D-P association were assessed in every case and explicitly stated for each selected sample (Table 1). The samples under study belong to the following archaeological sites.
Age estimations based on available radiometric dating for each studied potsherd. Also shown are age estimations inferred from archaeomagnetic dating (Pavón-Carrasco et al., Reference Pavón-Carrasco, Osete, Torta and De Santis2014).

Soria 2
This is a housing complex located in an archaeological area with evidence of long-term occupation. The excavation allowed the identification of two dominant sub-quadrangular, domestic, stone enclosures. The carbon sample found at an open patio structure was dated to 1940 ± 8014C yr BP (Palamarczuk et al., Reference Palamarczuk, Spano, Magnífico, Weber, López and Maniasiewicz2007). This is a reliable age, since it is consistent with the dated burials that sealed the occupation of the site (Spano et al., Reference Spano, Grimoldi and Palamarczuk2014; Greco Reference Greco2014).
Cardonal
Dated between 41 BC and AD 378, this village is one example of the first sedentary agricultural communities in northwest Argentina (Scattolin et al., Reference Scattolin, Bugliani, Pereyra Domingorena, Cortés, Lazzari, Izeta, Calo, Korstanje and Lazzari2015). Approximately 100 circular or sub-circular stone structures are disposed in household compounds, surrounded by corrals and farming enclosures. The site was extensively excavated and 11 accelerator mass spectrometry radiocarbon ages were reported (Scattolin et al., Reference Scattolin, Bugliani, Pereyra Domingorena, Cortés, Lazzari, Izeta, Calo, Korstanje and Lazzari2015). The pottery fragments analyzed in the present study come from the floor of Structure 2, associated with a radiocarbon age of 1878 ± 57 14C yr BP.
Falda del Cerro de Ingenio del Arenal
The site is divided in two sectors, one of 105 circular and sub-circular structures of different sizes and the other of 51 smaller and more concentrated structures surrounded by a perimeter wall (Lazzari and Pereyra Domingorena, Reference Lazzari, Pereyra Domingorena, Austral and Tamagnini2008; Pereyra Domingorena, Reference Pereyra Domingorena2010). Ceramic fragments, faunal remains, lithic artifacts, and copper ore were recovered in both sectors (Pereyra Domingorena, Reference Pereyra Domingorena2010) and charcoal from a hearth in Compound A, Structure 20 was dated to 1795 ± 3614C yr BP (Scattolin, Reference Scattolin, Williams, Ventura, Callegari and Yacobaccio2007).
Antigal de Tesoro
Antigal de Tesoro occupies 0.8 hectares on the top of on a small hill, where circular or sub-circular structures are concentrated. At least 50 structures were residential and 15 were dedicated to agro-pastoral tasks (Scattolin, Reference Scattolin, Williams, Ventura, Callegari and Yacobaccio2007). The excavations revealed that most of the structures were the loci of domestic tasks from whence numerous fragments of vessels and clear hearths in the living floors were found (Lazzari, Reference Lazzari2006). The available radiometric ages of the associated ceramic samples are 1615 ± 38 (Structure 16), 1680 ± 80 (Structure 19), and 1795 ± 70 14C yr BP (Structure 46).
Loma Alta
The site is formed by nine clusters of sub-circular residential enclosures built in stone, dispersed among agricultural fields and corrals. Area and test pit excavations were conducted at Structures 44, 46, and 47 within Compound E. Structure 47 was used as a courtyard for multiple tasks including food processing and tool manufacture and maintenance (Scattolin, Reference Scattolin1990). The artifacts included in this study were recovered from the occupation levels (Deposit III), where it was possible to identify in situ features such as a hearth with two pot bottoms inside, grinding stones, botanical macro-remains, fragments of animal bones, and numerous ceramics fragments. Loma Alta has nine radiocarbon ages from which we consider a single radiometric measurement of 1600 ± 120 14C yr BP associated with the pottery sample analyzed in present investigation (Scattolin, Reference Scattolin, Williams, Ventura, Callegari and Yacobaccio2007).
Tesoro I
The site comprises around 70 stone-walled agriculture enclosures and corrals of sub-square and sub-polygonal shape. Several household compounds have been found. Excavations at Compound A uncovered an outside refuse area and a circular room revealing the remains of domestic activities with two hearths excavated on the bed rock. Other excavations were made in Compounds B and D (Lazzari Reference Lazzari2006). The age (1251 ± 31 14C yr BP) is from the fireplace in the bedrock, repeatedly exposed to fire, and with abundant ceramic fragments of Compound A. The archaeomagnetically measured fragment corresponds to an ordinary pot that was excavated on the dated combustion structure.
Morro de las Espinillas
This settlement is surrounded by a stone perimeter fence and consists of a concentrated village composed of domestic units and other structures, some of larger dimensions such as open spaces, and circulation paths. The artifacts found constitute domestic residue. So far, a series of test pits have been carried out from which three radiocarbon ages were obtained, the one considered in this study is 1140 ± 70 14C yr BP (Scattolin, Reference Scattolin2003). Both the radiocarbon ages and the ceramic samples analyzed come from floor levels of occupation found in small excavations areas.
LABORATORY TECHNIQUES
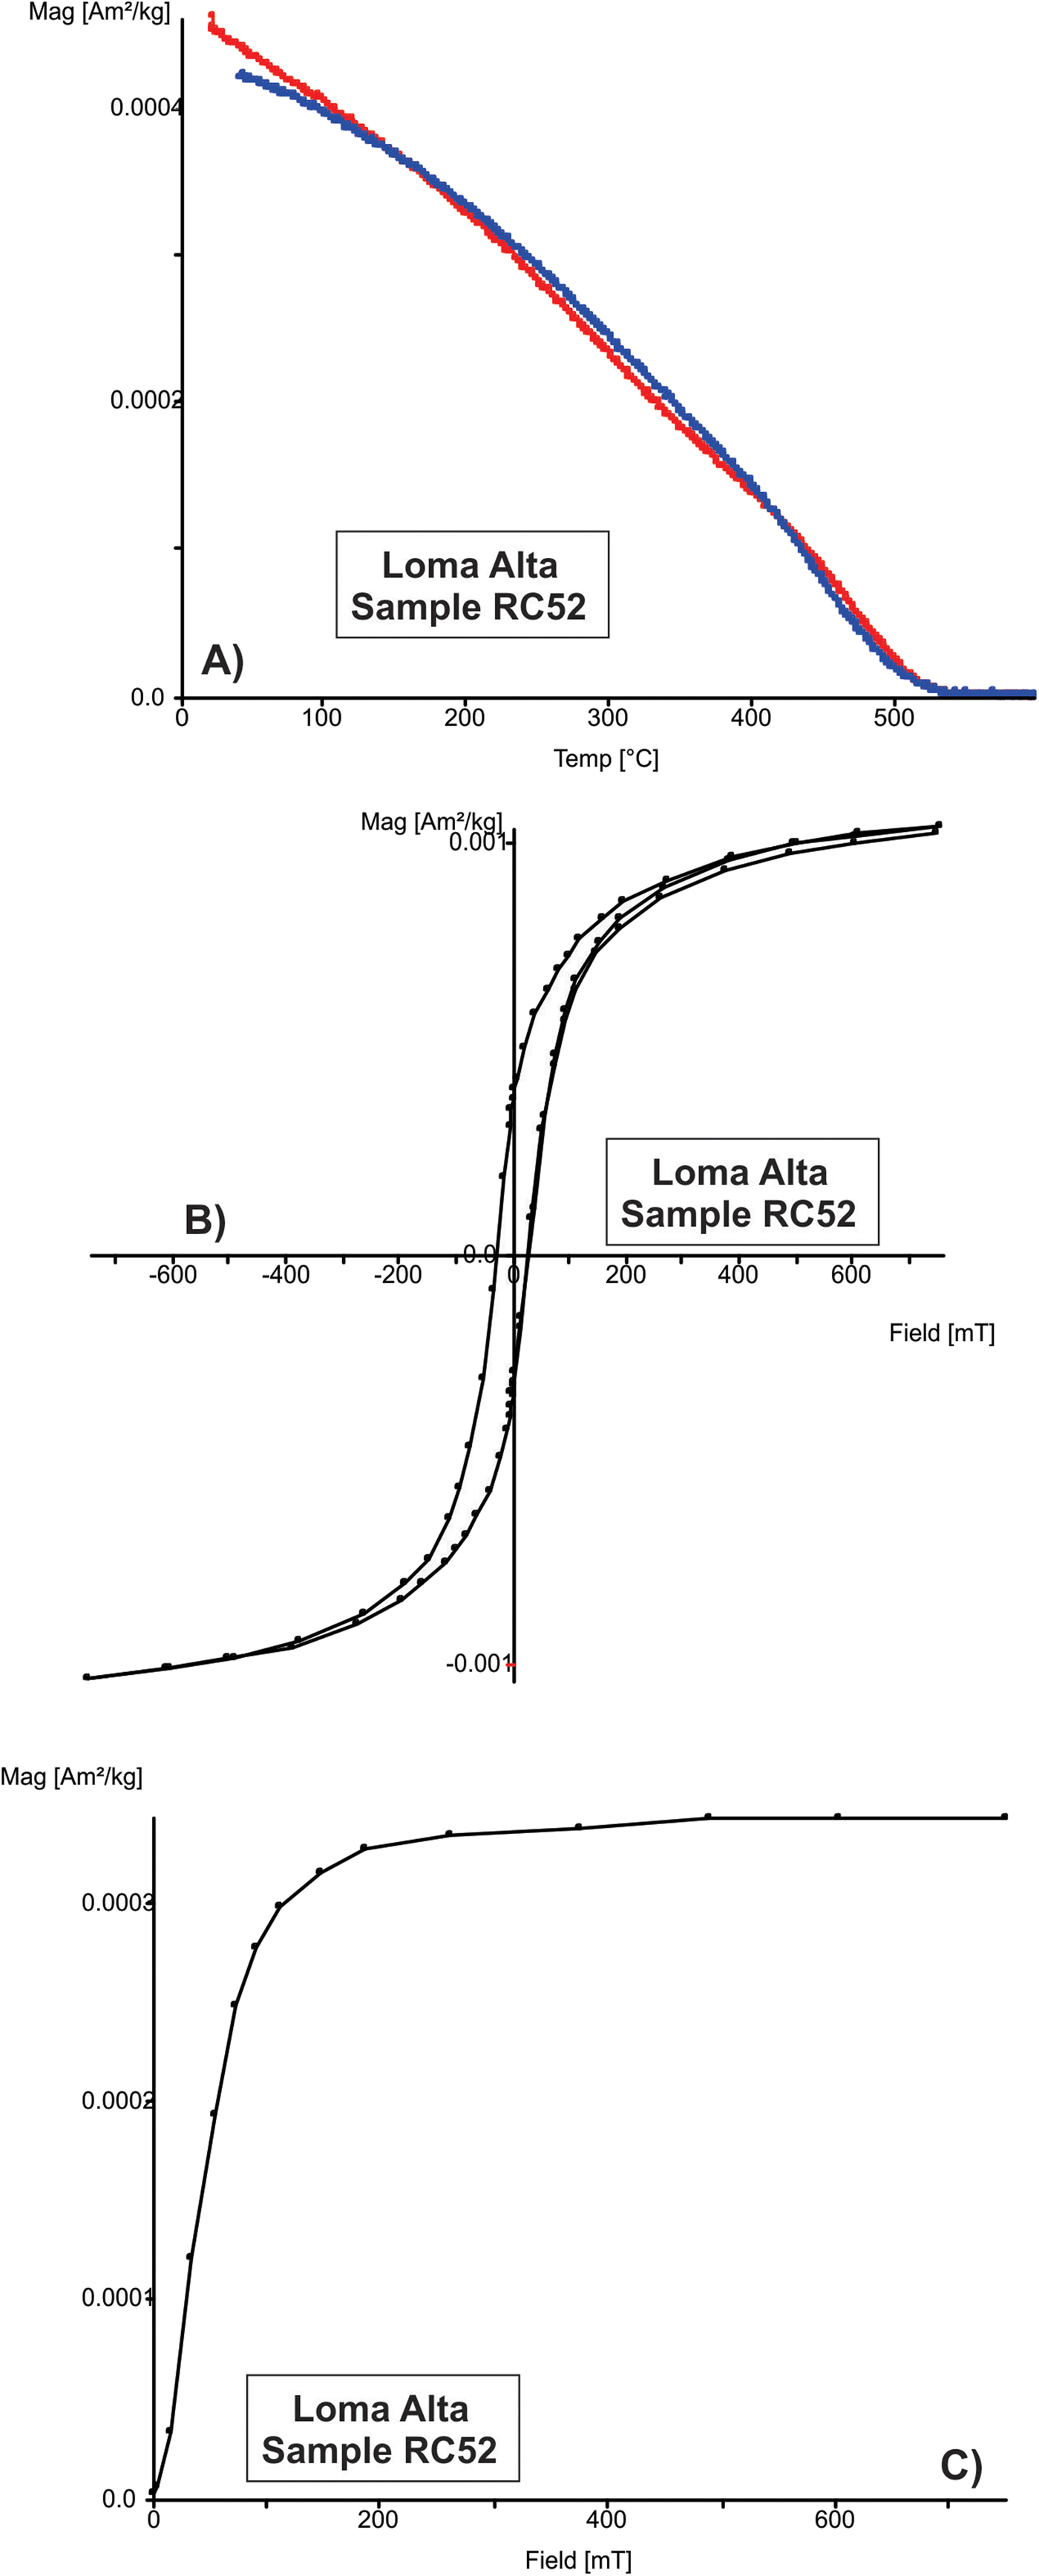
Prior to absolute intensity determination, a detailed rock-magnetic analysis was carried out in order to estimate the magnetic carriers and their thermal stability. Both factors are essential for selecting the most promising samples for Thellier (Thellier and Thellier, Reference Thellier and Thellier1959; Coe et al., Reference Coe, Grommé and Mankinen1978) double-heating experiments. The full battery of magnetic experiments consisted of the continuous record of saturation magnetization versus temperature, hysteresis cycles (Fig. 2), and associated isothermal remanent magnetization acquisition (IRM) curves using a variable field translation balance. IRM acquisition curves were recorded in a maximum applied field of 0.85 T. Hysteresis parameters were determined after paramagnetic and diamagnetic corrections. We used the RockMag Analyser 1.0 software for data analysis. Continuous thermomagnetic curves were obtained by heating samples in air up to 620°C and cooling them down to room temperature.
(color online) Rock-magnetic properties of pre-selected samples for paleointensity experiments: (a) continuous thermomagnetic (Ms-T) curve; (b) hysteresis plot; and (c) corresponding isothermal remanent magnetization acquisition curve.

An ASC TD48 dual chamber thermal demagnetizer (equipped with field coils) was used for archaeointensity experiments and a JR6a spinner magnetometer (AGICO) served to measure the natural remanent magnetization. The Thellier variant (Thellier and Thellier, Reference Thellier and Thellier1959; Coe et al., Reference Coe, Grommé and Mankinen1978) for paleointensity measurements was employed in this study. The magnetic field laboratory was set to 40 μT, with a 0.5 μT or less precision. For the first set of samples, 11 temperature steps were distributed throughout the whole experiment and control heatings (so-called pTRM checks) were performed after every second temperature step. For the second set of samples, only nine steps were distributed until 515°C because almost 90% of the initial remanent magnetization is removed at this temperature. All pottery fragments were divided into six fragments and oriented in salt pellets with six different positions in order to reduce the magnetic anisotropy effects (Morales et al., Reference Morales, Acosta, Gonzalez-Moran, Alva-Valdivia, Robles-Camacho and Hernandez-Bernal2009, Reference Morales, Goguitchaichvili, Aguilar-Reyes, Pineda-Duran, Camps, Carvallo and Calvo-Rathert2011. Cooling rate experiments were performed following a slightly modified procedure from that described by Chauvin et al. (Reference Chauvin, Garcia, Lanos and Laubenheimer2000). The duration of slow cooling was 7 h and 15 min.
RESULTS
Twenty-one potsherd fragments were first subjected to the full battery of rock-magnetic experiments as a first filter to reject those samples with unstable thermal behavior (irreversible continuous thermomagnetic curves) and characteristic multidomain behavior. Seventeen fragments successfully passed this test, yielding the following properties (Fig. 2). Saturation magnetization versus temperature curve showed stable, reasonably reversible behavior, indicating low-Ti close to the magnetite phase as the main remanence carrier (Fig. 2a). The fact that there is no abrupt drop (the so-called Hopkinson effect) of susceptibility in the vicinity of Curie temperature probably reflect the broad range of magnetic grains with different chemical composition, coercive force, and spontaneous magnetization. Representative hysteresis plots showed a quite simple behavior (Fig. 2b), without any wasp-waisted or potbellied behavior (Roberts et al., Reference Roberts, Cui and Verosub1995). Hysteresis ratios (Mrs / Ms = 0.38 and Bcr / Bc = 1.63 on average) pointed to dominantly small pseudo-single domain states (Dunlop, Reference Dunlop2002). The associated isothermal remanence (IRM) acquisition curves indicate that saturation was reached at about 250–280 mT (Fig. 2c). Seventeen fragments, yielding the above described behavior, were pre-selected for Thellier double-heating absolute paleointensity experiments.
Ninety-eight specimens belonging to these 17 potsherds were pre-selected for archaeointensity experiments. The following acceptance criteria were applied to the individual determinations: (1) no significant deviation of Natural Remanent Magnetization (NRM) end points towards the laboratory field directions; (2) positive control heating (within 15% of room temperature until 400°C and within 10% above); (3) no concavity observed on NRM-TRM (Thermoremanent Magnetization) plots; (4) Coe's quality factor q generally about five or higher; (5) a remanence fraction f more than one-third of initial remanence; and (6) a minimum of six aligned points on the NRM decay versus TRM acquisition curve (also known as Arai-Nagata plots).
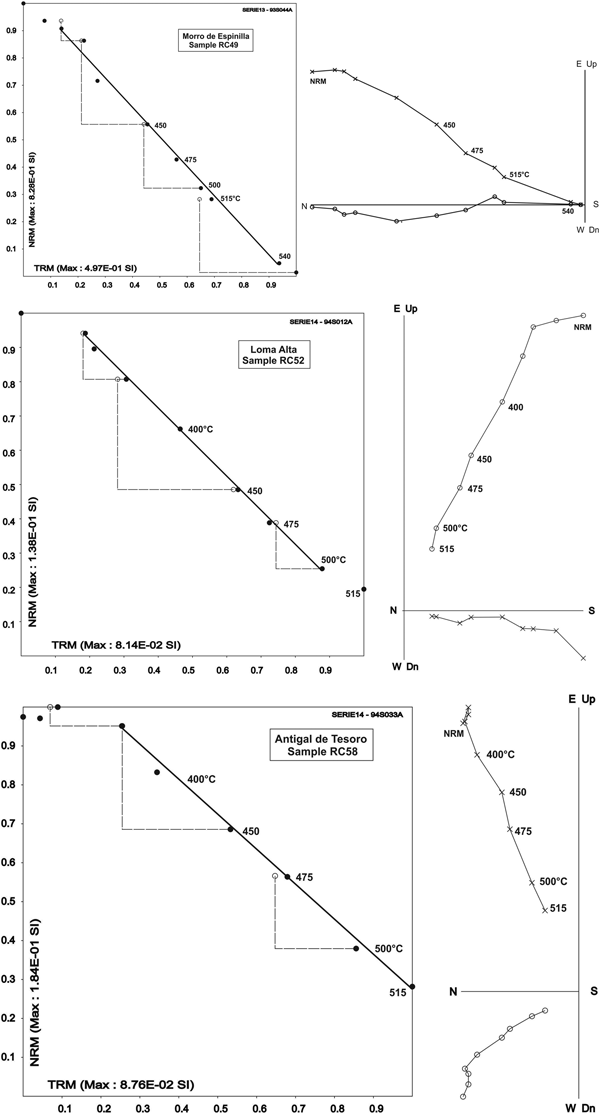
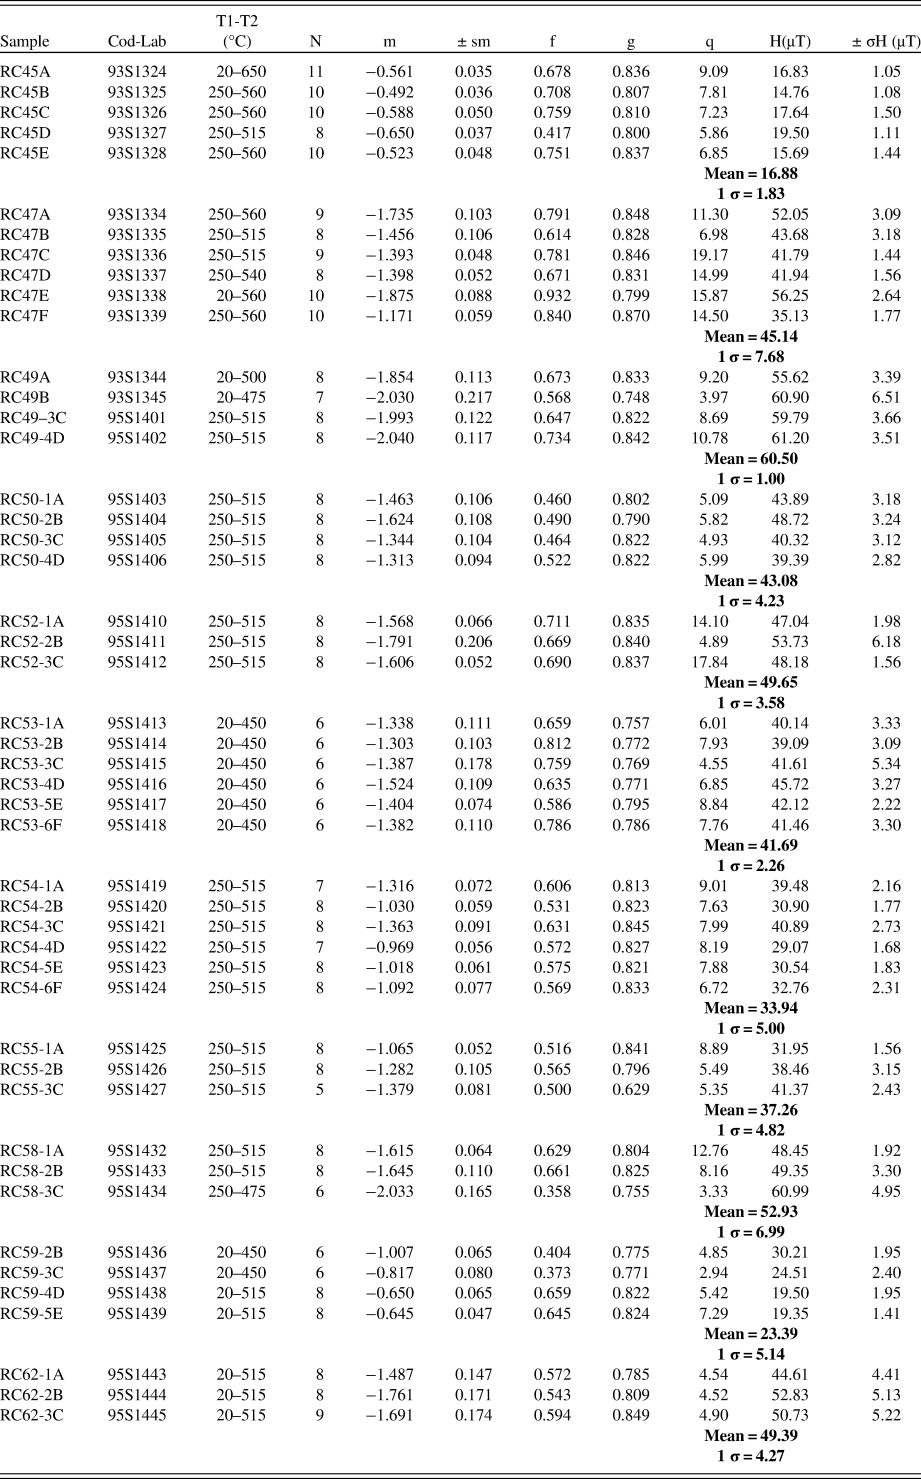
Only 47 specimens, belonging to 11 fragments, yielded reliable determinations under these acceptance criteria (Fig. 3, Table 2). For these samples, the remanence fraction f used for determination ranges between 0.36 and 0.84, while the quality factor q ranges from 3.97 to 19.2. The main reasons for failure to determine absolute geomagnetic intensity of more than half of the analyzed samples were either frankly deviated pTRM checks or clearly defined concave-up shape.
Representative Natural Remanent Magnetization (NRM)-Thermoremanent Magnetization (TRM) plots (so-called Arai-Nagata plots) and associated orthogonal vector demagnetization diagrams for the representative samples. See text for more details.

Archaeointensity results at sample level. T1-T2, the temperature interval of intensity determination; N, the number of heating steps used for the intensity determination; f, the fraction of Natural Remanent Magnetization used for intensity determination; g, the gap factor; q, the quality factor as defined by Coe et al. (Reference Coe, Grommé and Mankinen1978); H, archaeointensity value corrected for cooling rate effect.

DISCUSSION
The main reason of failure of absolute archaeointensity determinations lies in the fact that a limited number of burned artifacts that satisfy some very specific rock-magnetic conditions may be used for such determination (e.g., Kosterov et al., Reference Kosterov, Perrin, Glen and Coe1998). Both Thellier (Thellier and Thellier, Reference Thellier and Thellier1959) and microwave (Shaw et al., Reference Shaw, Walton, Yang, Rolph and Share1996) paleointensity techniques may be considered the most reliable methods to retrieve the magnitude of the EMF during the cooling of a volcanic rock (Hill et al., Reference Hill, Gratton and Shaw2002). In contrast, the Shaw (Reference Shaw1974) method represents a non-heating paleointensity method and uses an anhysteretic remanent magnetization or a saturation isothermal remanent magnetization to model the natural TRM to avoid heating-induced alteration. Absolute intensity determination, however, has an advantage because no oriented samples, and thus no in situ structures, are required. Despite the great effort made during the last decades, still no intensity PSVC are available for South America.
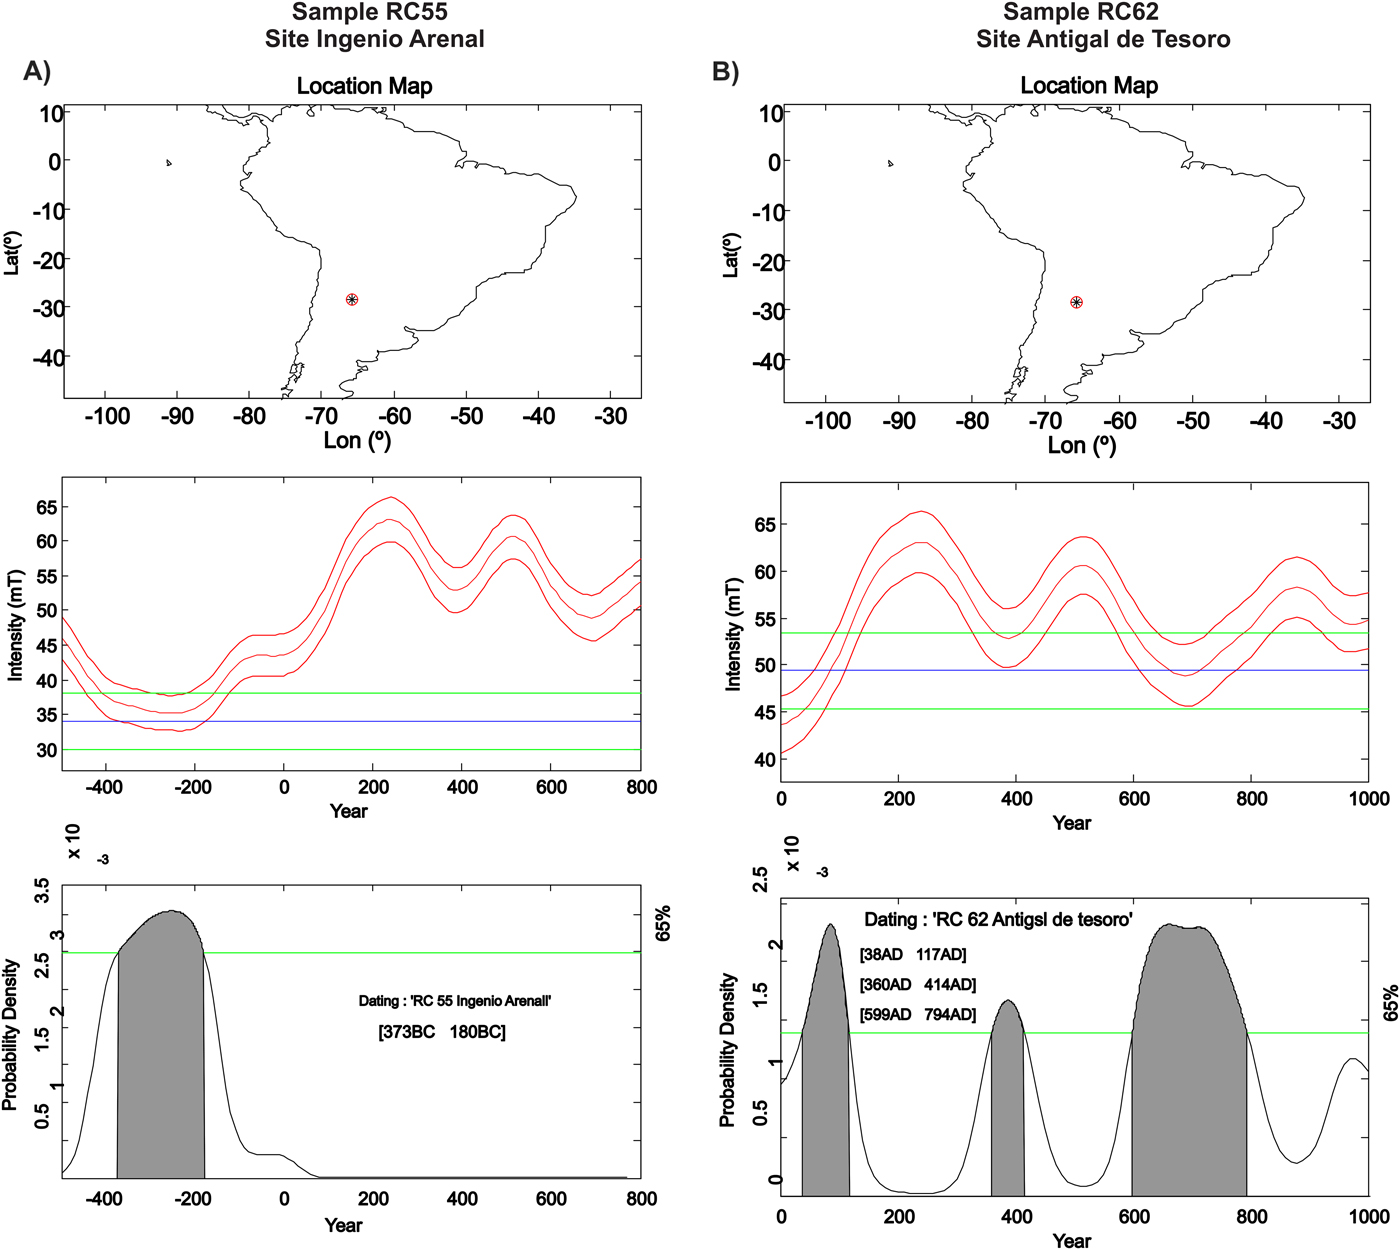
Alternatively, the use of global geomagnetic field models (GFM) may provide PSVC for the last 14 ka based on the information obtained from volcanic lava flows and burned archaeological artifacts. These GFM offer a general perspective of the variation of the full vector of EMF for the area of interest for a certain period of time. The SHA.DIF.14k is a GFM based on archeointensity determination available in most updated GEOMAGIA50v3 (Brown et al., Reference Brown, Donadini, Nilsson, Panovska, Frank, Korhonen, Schuberth, Korte and Constable2015) databases. The use of the last SHADIF.14K model of Pavón-Carrasco et al. (Reference Pavón-Carrasco, Rodríguez-González, Osete and Torta2011, Reference Pavón-Carrasco, Osete, Torta and De Santis2014) for the last 14 ka has little or no resolution in South America. This is well-illustrated in Table 1, which shows that the time intervals provided by both associated radiometric and archaeomagnetic dating are generally different (Fig. 4 and 4b, Table 1). Thus, this first attempt to construct the reference PSVC should be considered as of great relevance.
(color online) Archaeomagnetic dating results for some pottery fragments from northwest Argentina using the MATLAB tools provided by Pavón-Carrasco et al. (Reference Pavón-Carrasco, Rodríguez-González, Osete and Torta2011, Reference Pavón-Carrasco, Osete, Torta and De Santis2014). a) Sample RC55. b) Sample RC62. See text for details.

We compiled the available similar technical quality determinations for the area to have a detailed perspective of EMF strength fluctuation through time for the region. All available data used in the present study are distributed in an area covering Peru, Bolivia, Brazil, Chile, and Argentina. Most of the archaeointensities are available in the last version of GEOMAGIAv3 (Brown et al., Reference Brown, Donadini, Nilsson, Panovska, Frank, Korhonen, Schuberth, Korte and Constable2015) and ArcheoInt (Genevey et al., Reference Genevey, Gallet, Constable, Korte and Hulot2008). The archaeointensities were relocated to a common location in order to avoid spatial dependences and to provide continuous temporal information of the geomagnetic field in the selected region.
The relocation procedure was achieved assuming a geocentric axial dipole field (Le Goff et al., Reference Le Goff, Gallet, Genevey and Warmé2002; Lanos et al., Reference Lanos, Le Goff, Kovacheva and Schnepp2005), where the relocated intensities F R are calculated by the virtual axial dipole model expression (Barton et al., Reference Barton, Merrill and Barbetti1979):
 $$F_R = F_S\sqrt {\lpar {1 + 3\;{\cos}^2\;\theta_R} \rpar /(1 + 3\;{\cos} ^2\;\theta _S)} \; $$
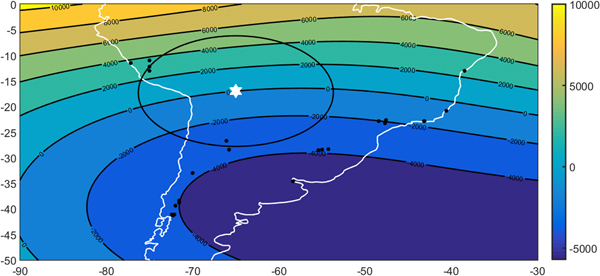
where F s is the in situ intensity, θ S is the site geographical colatitude, and θ R is the colatitude of the reference point, within the territory of Bolivia chosen as the reference location (17°S, 65°W). The relocation of the intensity data introduces an error due to the non-dipole harmonic contributions of the geomagnetic field (Barton et al., Reference Barton, Merrill and Barbetti1979; Daly and LeGoff, Reference Daly and Le Goff1996), which increases with the distance from the reference location. This error (also called relocation error) was studied by Casas and Incoronato (Reference Casas and Incoronato2007) for different spatial and temporal coverage. We have performed a similar study by using synthetic intensity data from the IGRF-12 model (Thébault et al., Reference Thébault, Finlay, Beggan, Alken, Aubert, Barrois and Bertrand2015) covering the area of interest (Fig. 5). The maximum relocation error for the archaeointensities accepted was less than 4 μT, a value lower than the average intensity uncertainty of our selected database (see also Goguitchaichvili et al., Reference Goguitchaichvili, García-Ruiz, Pavón-Carrasco, Morales Contreras, Soler-Arechalde and Urrutia-Fucugauchi2018).
(color online) Analysis of relocation error for South America using the latitude -17° and longitude -65° in Bolivia to perform the relocation exercise performed using intensities of South America provided by the IGRF-12 model.

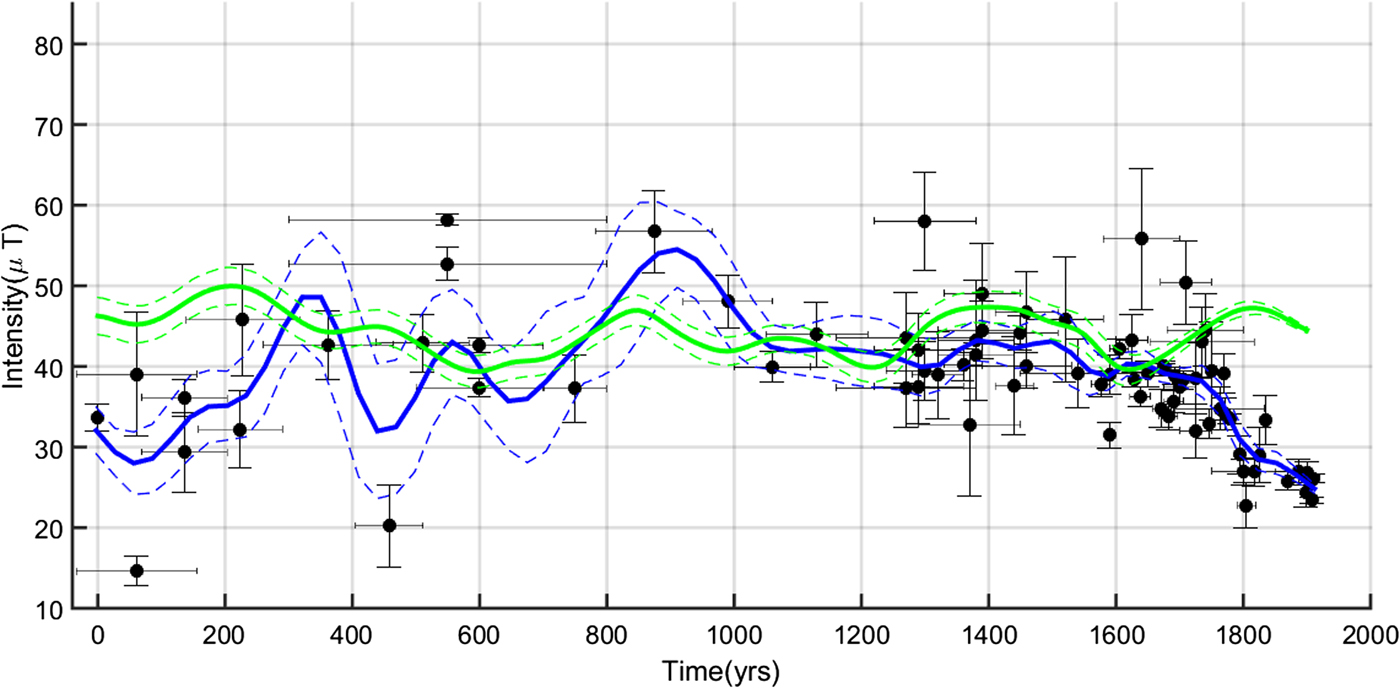
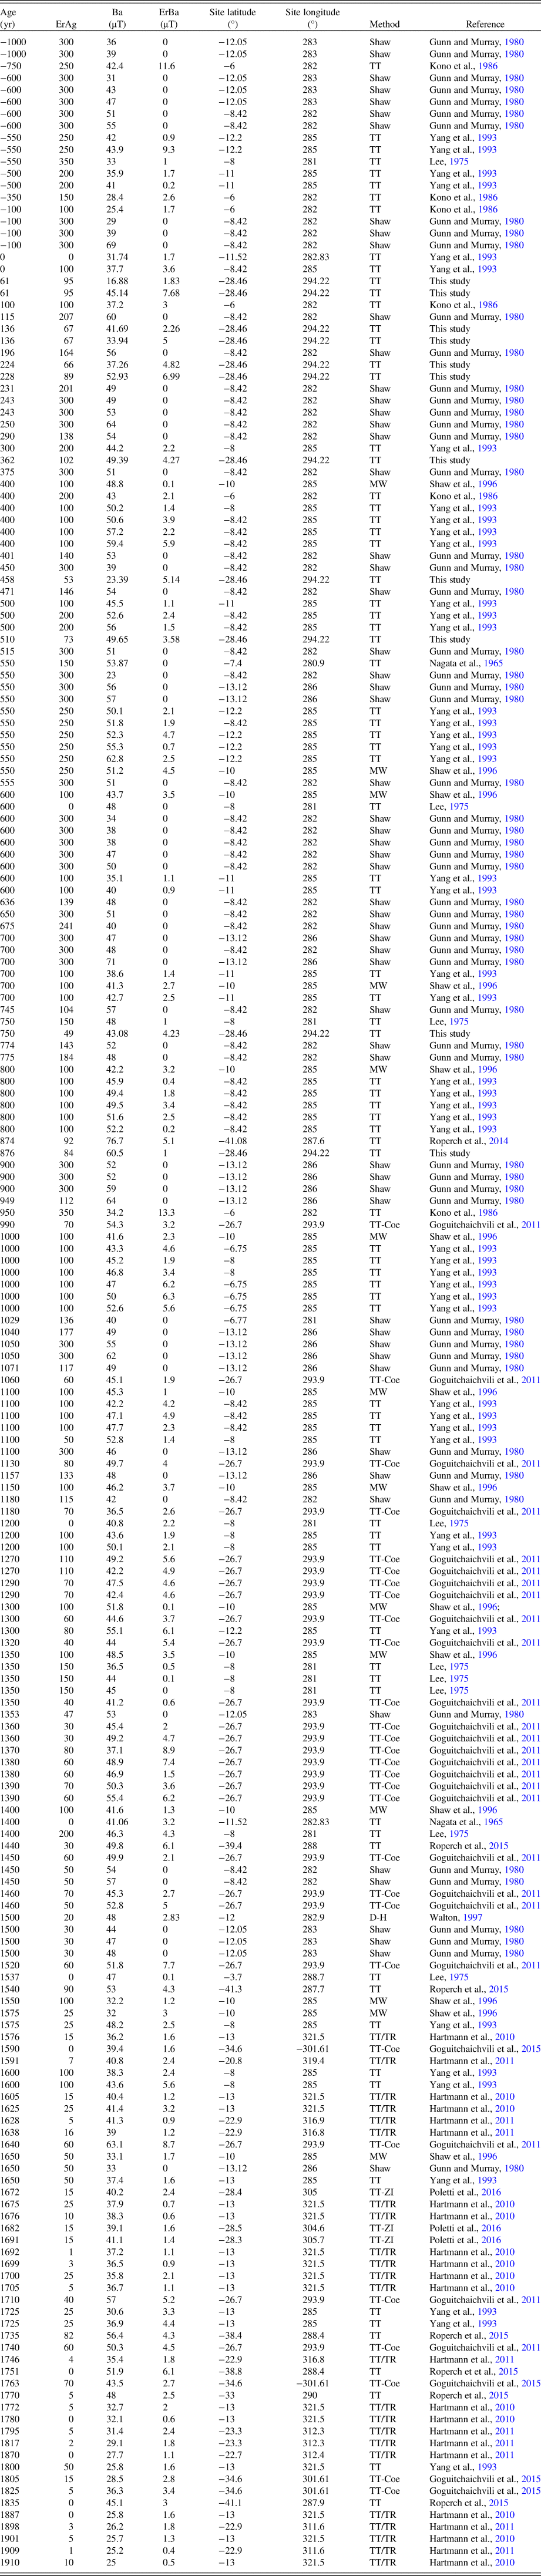
The available database is composed of 213 archaeointensity determinations obtained using the Thellier method (Thellier and Thellier, Reference Thellier and Thellier1959) and its modifications—the multi-specimen method of Dekkers and Böhnel (Reference Dekkers and Bonhël2006) and the microwave technique (Shaw, Reference Shaw1974). The database was classified on the basis of the most reliable intensities of South America with at least three specimens and with an intensity error (1 σ) lower than σ E ≤ 10 μT. Only 79 out of 213 published archeointensity data for the last 2000 yr were accepted (Fig. 6).
Paleosecular variation curve (PSVC) for the last two millennia for South America based on the selected data (blue line, please see text for the selection criteria) compared with the SHA.DIF.14k global geomagnetic field model (green line; after Pavon-Carrasco et al., Reference Pavón-Carrasco, Osete, Torta and De Santis2014). (For interpretation of the references to color in this figure legend, the reader is referred to the web version of this article.)

The intensity variation curve was built using a bootstrap method (following the approach of Thébault and Gallet, Reference Thébault and Gallet2010. The algorithm fits the data (see also Goguitchaichvili et al., Reference Goguitchaichvili, García-Ruiz, Pavón-Carrasco, Morales Contreras, Soler-Arechalde and Urrutia-Fucugauchi2018) to a continuous temporal spline function where each individual datum is considered as the combination of two statistical distributions: (1) a Gaussian distribution with mean and standard deviation given by the intensity parameters; and (2) a homogeneous distribution in time with minimum and maximum values delimited by the age uncertainties.
The approach requires several iterations, where for each of them a PSVC,  $\hat{f}$, is generated by randomly picking up the data from the above detailed statistical functions and applying the next expression:
 $$$\hat{f} = \lpar {A^TWA + \lambda D} \rpar ^{-1}A^TW^T$$$
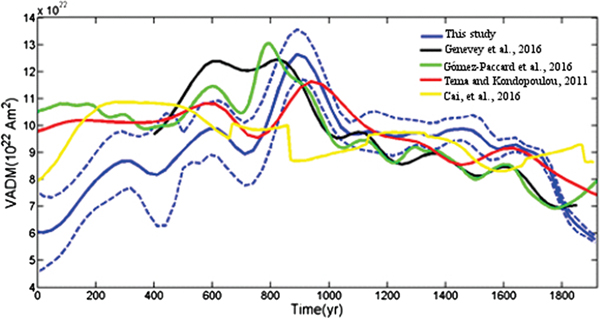
where f represents the intensity estimations whose uncertainties are used to perform the diagonal weight matrix W with w ii = 1/σF2. A is the parameter matrix based on a set of cubic b-splines with knot points every 50 yr. The matrix D represents a penalty function that constrains the solution by means of the damping parameter λ. The index T means the transpose matrix. The PSVC of the present study shows a regular behavior for the last two millennia with a trend that indicate an intensity decrease from ~AD 1500, as expected and indicated in previous studies for Europe and Asia (Fig. 6 and 7; Tema and Kondopoulou Reference Tema and Kondopoulou2011; Pavón-Carrasco et al., Reference Pavón-Carrasco, Osete, Torta and De Santis2014; Cai et al., Reference Cai, Jin, Tauxe, Deng, Qin, Pan and Zhu2016; Genevey et al., Reference Genevey, Gallet, Jesset, Thébault, Bouillon, Lefèvre and Le Goff2016; Gómez-Paccard et al., Reference Gómez-Paccard, Osete, Chauvin, Pavón-Carrasco, Peréz-Asensio, Jiménez and Lanos2016). The present PSVC was compared with the intensity predicted by the SHA.DIF.14k model for the area in question, showing a significant difference for the interval of 0 to AD 1000. It should be also noted that this time interval is not sufficiently covered. A well-defined maximum, however, around ~AD 900 is also observed on SHADIF.14k curve, which probably indicates a proper characteristic of the geomagnetic strength field of the area. Almost the same trend of intensity decreases and generally similar behavior is detected between AD 1000 to 2000 on both (present study and SHADIF.14k) curves.
(color online) Variation of the virtual axial dipole moment obtained in this study compared with regional curves from western Europe (Genevey et al., Reference Genevey, Gallet, Jesset, Thébault, Bouillon, Lefèvre and Le Goff2016; Gómez-Paccard et al., Reference Gómez-Paccard, Osete, Chauvin, Pavón-Carrasco, Peréz-Asensio, Jiménez and Lanos2016), eastern Europe (Tema and Kondopoulou, Reference Tema and Kondopoulou2011), and Asia (Cai et al., Reference Cai, Jin, Tauxe, Deng, Qin, Pan and Zhu2016).

This first, regional, intensity PSVC may be considered the most reliable one because we selected only determinations with available radiocarbon dating and well-constrained archaeological context. Moreover, in each case we applied the so-called degree-certainty test (see Goguitchaichvili et al., Reference Goguitchaichvili, García-Ruiz, Pavón-Carrasco, Morales Contreras, Soler-Arechalde and Urrutia-Fucugauchi2018) to judge the S-E association as described by Waterbolk (Reference Waterbolk1983). The present PSVC was compared with the PSVC for eastern Europe (Tema and Kondopoulou, Reference Tema and Kondopoulou2011), western Europe (Genevey, Reference Genevey, Gallet, Jesset, Thébault, Bouillon, Lefèvre and Le Goff2016; Gómez-Paccard et al., Reference Gómez-Paccard, Osete, Chauvin, Pavón-Carrasco, Peréz-Asensio, Jiménez and Lanos2016), and Asia (Cai et al., Reference Cai, Jin, Tauxe, Deng, Qin, Pan and Zhu2016) for the same temporality in terms of virtual axial dipole moments. Some coincidences may be appreciated (Fig. 7) between the PSVC of eastern Europe and the PSVC of the present study (Tema and Kondopoulou, Reference Tema and Kondopoulou2011). Rather good agreement, however, is observed with similar curves for western Europe between 850–1150 BC and Asia between 1000–1500 BC. The monotonic decrease of absolute geomagnetic intensity for relatively recent periods seems to be a most common feature for all these curves obtained at very different locations.
Courtillot et al. (Reference Courtillot, Gallet, Le Mouël, Fluteau and Genevey2007) suggested that the fluctuations of absolute geomagnetic field strength may be correlated with climate changes over multi-decadal time scales. The cooling (warming) episodes are synchronous with the intensity increase (decrease) and seem to be influenced by the geomagnetic field through the modulation of the cosmic ray flux interacting with the atmosphere. Goguitchaichvili et al. (Reference Goguitchaichvili, Loponte, Morales and Acosta2012) partly supported this hypothesis studying some historical buildings in Buenos Aires. Indeed, Stine (Reference Stine1994) reported a persistent warm climate in Patagonia between AD 1200 and 1350 and thus one should expect a considerable intensity decrease. In the same context, Argollo and Mourguiart (Reference Argollo, Mourguiart, Argollo and Mourguiart1995) reported evidence for a relatively large cooling interval from AD 1600 to 1900 in Bolivia (a so-called “small ice age”) based on paleoclimatic indicators of Lake Titicaca. Interestingly, relatively high intensity values are observed between AD 1200 and 1400, while the clear intensity decrease is also detected between AD 1600 and 1900. Although these specific data apparently support the debated relationship between absolute intensity and paleoclimate changes, more and better-distributed data are strongly required to validate this hypothesis.
CONCLUSIONS
Detailed rock-magnetic analysis was carried out on 21 potsherds from Catamarca area (northwest Argentina) to select the most suitable samples for Thellier paleointensity experiments. Most of samples provided almost reversible continuous thermomagnetic curves, pointing to the presence of small pseudo-single-domain, Ti-poor titanomagnetite as the main remanence carrier. Double-heating archaeointensity measurements provided 47 technically reliable individual determinations belonging to 11 potsherds distributed between 1940 and 114014C yr BP. These new data from northwest Argentina were analyzed together with other available, similar-quality determinations from the adjacent regions. The relocation-error analysis allowed us to incorporate some high-quality determinations belonging to the sites located in Brazil, Bolivia, Peru, and Chile. The first PSVC show some differences compared with the global prediction model SHA.DIF.14k probably due to the improper selection of individual archaeointensity determinations.
The obtained reference curve is exclusively based on archaeointensity determinations supported with radiometric dating and well-constrained archaeological context. In each case, the so-called degree-certainty test to judge the S-E association was strictly applied. This first PSVC curve provided some crucial information about the fluctuation of the strength of the geomagnetic field during the last two millennia, showing rather similar variation patterns with respect to the Asian curve from approximately 1000 to 1500 BC and the European one between 850 and 1150 BC. The same is not true for other regions of world, however, where absolute intensity references curves are available. Thus, at this stage, it is hard to confirm any global feature of the EMF strength fluctuation. Some marked differences with respect to the global geomagnetic prediction model SHA.DIF.14k may be partly explained in terms of inadequate data selection but also some influence of non-dipole contribution probably due to the South Atlantic Magnetic Anomaly. Finally, we suggest that this first reference PSVC may be used as a most reliable regional archaeomagnetic dating tool for the last two millennia.
Table of the available, selected archaeointensities from South America showing: age, ErAg, the dispersion of the age; Ba, the absolute intensity; ErBa, the dispersion of the intensity; Lat, Lon, the coordinates; the methods used as Shaw; TT, TT-Coe, TT-ZI, TT/TR, Thellier's method and its modification; MW, microwave; D-H, double-heating; Ref, the References.

ACKNOWLEDGMENTS
The authors are thankful for the financial support provided by UNIVERSIDAD NACIONAL AUTONOMA DE MEXICO-PAPIIT IN101717 and CONSEJO NACIONAL DE CIENCIA Y TECNOLOGIA grant number 252149.