1. Introduction
Groundwater arsenic poses a significant health risk for tens of millions of people in South and Southeast Asia. In 2000 roughly half of the population of Bangladesh were consuming groundwater with arsenic above the World Health Organization's 10 μg/L safety standard, with one-third having arsenic above the national standard of 50 μg/L (World Bank, 2005). Arsenic has many negative health effects – with latency periods of 5–15 years for earlier effects and 20 or more years for cancers (Argos et al., Reference Argos, Kalra and Rathouz2010; Chen et al., Reference Chen, Graziano and Parvez2011). In Bangladesh, well testing has been the critical spur for households to switch away from arsenic-unsafe wells, at least for drinking. We examine the evolution of the well-switching responses by households to gauge whether the tests' impact on switching behavior eroded or increased over time. We also document a loss of test information that affects switching.
Until the 1970s, water in ponds was the primary source of drinking water in Bangladesh. Groundwater from tube wells (often 30–100 m deep) was promoted to reduce water-borne disease, a leading cause of high infant mortality rates. Most wells were privately installed, given low costs of installation and the convenience and privacy of having one's own well (Caldwell et al., Reference Caldwell, Caldwell, Mitra and Smith2003). By 1990, groundwater was the main drinking source for over 90 per cent of the population and over 95 per cent in the rural areas (World Bank, 2005). It was not known at that time that the groundwater contained naturally occurring arsenic. Testing later revealed significant contamination in Bangladesh, leading the World Bank to create the Bangladesh Arsenic Mitigation Water Supply Program (BAMWSP), which tested five million tube wells countrywide using field kits, for free, during 1999–2003. Wells with arsenic above 50 μg/L were painted red (‘unsafe’). Those with arsenic below 50 μg/L were painted green (‘safe’).
Arsenic levels – determined by the local geology – can vary greatly even within a village (British Geological Survey, 2001; van Geen et al., Reference van Geen, Ahsan and Horneman2002; Reference van Geen, Trevisani, Immel, Jakariya, Osman, Cheng, Gelman and Ahmed2006). Thus, well testing and labeling for arsenic could encourage ‘well switching’ away from unsafe wells, i.e., choosing not to drink water from unsafe wells and, instead, drinking from safer wells. BAMWSP's tests motivated households whose wells were painted red to switch wells – often to neighbors' safe wells but sometimes to safe community wells (Ahmed et al., Reference Ahmed, Ahuja, Alauddin, Hug, Lloyd, Pfaff, Pichler, Saltikov, Stute and van Geen2006). At least in the short run, reductions in arsenic exposure achieved through well testing and switching have been larger than that achieved via any other means (Ahmed et al., Reference Ahmed, Ahuja, Alauddin, Hug, Lloyd, Pfaff, Pichler, Saltikov, Stute and van Geen2006).Footnote 1
It has been suggested, however, that households might return to their prior wells over time (Hanchett et al., Reference Hanchett, Nahar, van Agthoven, Geers and Rezvi2002). That could follow from a reduced supply of safe wells if their owners stopped providing access, due to increased pump wear-and-tear or concerns about privacy. Demand for safe wells also could decline if concerns about arsenic fade after unsafe tests. Yet early switches could lead to later switching. Observing switching by neighbors could increase perceived gains from safe water or lower perceived costs of using others' wells – either of which could lead to leaving an unsafe well later, after having initially stayed put. Thus, there are reasons to believe that well switching could either fall or rise across time.
We examine the medium-run impacts on well switching of BAMWSP's pre-2003 arsenic testing, within one sub-district of Araihazar. In 2008, we conducted a follow-up survey to record well switching during 2005–2008 among a randomly selected subset of households whose initial well-switching behaviors, during 2003–2005, had been recorded previously. Successive decisions by each household, over time, permit us to evaluate whether impacts of arsenic testing on household well-switching behavior eroded or increased over time. We believe this is the first study of switching over time for arsenic. It is one of few examining the longer run impacts of health information interventions (see also Nyström et al., Reference Nyström, Andersson, Bjurstam, Frisell, Nordenskjöld and Rutqvist2002; Ozminkowski et al., Reference Ozminkowski, Ling, Goetzel, Bruno, Rutter, Isaac and Wang2002; Beardslee et al., Reference Beardslee, Wright, Gladstone and Forbes2007, all concerning developed countries).
Our results suggest that arsenic testing produced increasing behavioral response over time. Of households at unsafe wells who had switched wells by 2005, 88 per cent were at the 2005 well in 2008. None went back to old wells. Of households at unsafe wells who had not switched by 2005, a significant share switched by 2008, doubling the share of households who had ever switched from unsafe wells. In this case, information's impact increased over time.
Yet we do see one cost of the passage of time. The recollection of test results fell, as 22 per cent of households recalled their 2003 arsenic test results in 2005 but, by 2008, were unable to do so. Switching by households with inaccurate recall was more common from safe wells than from unsafe, a pattern opposite to that for households with accurate recall of arsenic. That too supports ongoing arsenic tests to reinforce this useful information intervention.
Below, section 2 provides a brief review of the empirical literature concerning roles of health-risk information in health-improving behavior, with a focus in particular upon Bangladesh. Section 3 then sketches several conceptual perspectives on the dynamics of well switching, which suggest testable hypotheses. Section 4 describes our data and provides descriptive statistics, while section 5 presents our results and section 6 discusses their implications.
2. Related empirical literature
2.1. Information provision and health-improving behaviors
In public health, information campaigns have been used to promote safer sexual practices (Alstead et al., Reference Alstead, Campsmith, Halley, Hartfield, Goldbaum and Wood1999), regular monitoring of health (Fender et al., Reference Fender, Prentice, Gorst, Nixon, Duffy, Day and Smith1999; Black et al., Reference Black, Yamada and Mann2002), cessation of smoking (Siegel and Beiner, Reference Siegel and Biener2000; Farrelly et al., Reference Farrelly, Healton, Davis, Messeri, Hersey and Haviland2002), and reduction in transmission of infectious diseases (Preston, Reference Preston1996). Nutrition labels on food products aim to motivate appropriate choice in one's diet (some relatively recent examples are Harnack and French, Reference Harnack and French2008; Downs et al., Reference Downs, Loewenstein and Wisdom2009; Wisdom et al., Reference Wisdom, Downs and Loewenstein2010).
Information provision about health in developing countries has confronted leading causes of heavy disease burdens to motivate exposure-reducing practices including better hygiene, vaccination and choices to reduce HIV risk (Sircar et al., Reference Sircar, Sengupta, Mondal, Gupta, Saha, Ghosh, Deb and Pal1987; Stanton and Clements, Reference Stanton and Clements1987; Siriwardena et al., Reference Siriwardena, Rashid, Johnson and Dewey2002; Fewtrell et al., Reference Fewtrell, Kaufmann, Kay, Enanoria, Haller and Colford2005; Jalan and Somanathan, Reference Jalan and Somanathan2008; Thornton, Reference Thornton2008; Pattanayak and Pfaff, Reference Pattanayak and Pfaff2009; Kennedy et al., Reference Kennedy, Medley, Sweat and O'Reilly2010; Pattanayak et al., Reference Pattanayak, Poulos, Yang and Patil2010). Developing country governments may be challenged to provide the desired environmental conditions (e.g., clean air and water) and may lack the institutional and technological capacity to ensure adherence to environmental and health standards or respond to disease outbreaks. When they possess risk information, individuals can take action to help avoid health risks.
Research on health information's impacts suggests that it motivates better health practices but also that its effects are likely to vary with risk, education and income (see, e.g., Shimshack et al., Reference Shimshack, Ward and Beatty2007; Jalan and Somanathan, Reference Jalan and Somanathan2008). Most of this evidence has been based on data for two years or less (such studies include, e.g., Duflo et al., Reference Duflo, Dupas, Kremer and Sinei2006; Dupas, Reference Dupas2010), thus not much is known about whether behavioral changes vanish, persist or even expand.
2.2. Arsenic information and exposure-reducing behaviors
BAMWSP conducted countrywide arsenic testing of the groundwater from wells between 1999 and 2003. In a 25 km2 area of Araihazar region, however, well tests were provided in 2000 by a team of researchers from Columbia University (van Geen et al., Reference van Geen, Zheng and Veersteeg2003). Much of the prior study of behavioral impacts from arsenic testing has been done within this area.
Madajewicz et al. (Reference Madajewicz, Pfaff, van Geen, Graziano, Hussein, Momotaj, Sylvi and Ahsan2007) conducted a survey of household behaviors in this 25 km2 area. They found that general information on arsenic risks, as disseminated through television, did not lead to well switching. However, specific well tests led over half of those at unsafe wells to switch, despite walking costs. For the same area, Opar et al. (Reference Opar, Pfaff, Seddique, Ahmed, Graziano and van Geen2005) found one year later that almost two-thirds of the households at unsafe wells had switched – albeit in some cases to untested wells – versus only 15 per cent of the households at safe wells having switched. Both articles indicated that distance to a safe well, and whether one owned the unsafe well, were important factors in well switching. Again for this area, Chen et al. (Reference Chen, van Geen, Graziano, Pfaff, Madajewicz, Parvez, Hussain, Slavkovich and Ahsan2007) considered the combined effect of an in-person communication of tests alongside health information, well labeling and village-level education. This study found that urinary arsenic levels had dropped over time among the individuals in those households that reported well switches, while not changing much for individuals in households that reported not having switched.
This sub-region of Araihazar may be influenced by the presence of Columbia University's team. Schoenfeld (Reference Schoenfeld2005) surveyed other areas within Araihazar where the well testing had been provided by BAMWSP alone, to limit the impact of the research program, and found lower although still significant impacts of well testing within these BAMWSP-only areas.
3. Conceptual frameworks
Existing static models consider tradeoffs faced by households choosing among strategies for arsenic-exposure reduction, including whether to act at all to reduce arsenic exposure. In the spirit of the models within Grossman (Reference Grossman1972) and Freeman (Reference Freeman III1993), Madajewicz et al. (Reference Madajewicz, Pfaff, van Geen, Graziano, Hussein, Momotaj, Sylvi and Ahsan2007) describe a household that maximizes utility, assumed to be a function of illness and the consumption of leisure and other goods. Facing both income and time constraints, the household allocates some of each to reduce illness through both prevention and treatment. Factors affecting allocation are exogenous exposure (arsenic in one's well) and exogenous prices for prevention (for instance, walking time to a safe well in order to avoid exposure).
Net benefits of switching may change over time, however, which can affect well switching. Switching's net benefit might fall over time, leading households to reverse prior switching. Hanchett et al. (Reference Hanchett, Nahar, van Agthoven, Geers and Rezvi2002) and Caldwell et al. (Reference Caldwell, Caldwell, Mitra and Smith2003) claim that the risk from arsenic is unclear for many households – especially given public endorsement of groundwater in the 1970s – so that arsenic risk information may need to be reinforced to dissuade the use of unsafe wells. Arsenic concern could also fall over time if risk perceptions fall with the time after the risk information is presented (Karlan et al., Reference Karlan, McConnell, Mullainathan and Zinman2010, for example, highlights this possibility). Households may also switch back to unsafe sources if safe-well owners reduce access to their wells – offering access in a crisis while expecting such usage to end (Fehr and Fischbacher, Reference Fehr and Fischbacher2003). Along these lines, Hanchett et al. (Reference Hanchett, Nahar, van Agthoven, Geers and Rezvi2002) describe the sense of humanitarian outreach when news of an arsenic contamination crisis broke but also note, based on detailed interviews, that rising social tensions led those still drinking from unsafe wells to sometimes claim that no safe alternatives were available despite low-arsenic wells being present in the vicinity.
On the other hand, net benefits of switching could rise over time – increasing switching if that rise in net benefits is sufficient for households to switch later after staying put earlier. Such a rise could be due to a new exogenous supply of information on the risk from arsenic; however, within our study area, no new arsenic well tests had been carried out since 2003. Information may also be acquired by observing neighbors' behaviors, leading households to mimic early switchers. Alternatively they may adjust their perceptions of factors which drive switching, for instance raising their perceptions of risk from arsenic or lowering their perceptions of costs of using others' wells, by inferring from neighbor actions (research on such ‘social learning’ includes Miguel and Kremer, Reference Miguel and Kremer2004; Munshi and Myaux, Reference Munshi and Myaux2006).
The net perceived benefits of switching also vary with the arsenic level in the well that is currently used for drinking – and even that information can change, with implications for well switching over time. With no re-testing for arsenic after 2003, the red and green paint that was applied by BAMWSP could and did wash away by 2008. Such loss of information can change perceptions of what is safe. Well switching could increase if those at safe wells come to think that their wells are unsafe. On the other hand, households with unsafe wells who may have switched later would not do so if they came to believe their wells were safe.
4. Data and descriptive statistics
4.1. Data
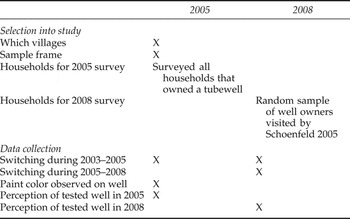
We revisited a randomly selected subset of the households studied by Schoenfeld (Reference Schoenfeld2005). The sample frame for that study of 2003–2005 switching was a database with 30,000 test results from BAMWSP (table 1). Schoenfeld (Reference Schoenfeld2005) selected eight villages in Araihazar with over 80 per cent unsafe wells and 54 villages with 40–60 per cent of unsafe wells. Each village received arsenic test results from BAMWSP, i.e., not from university researchers. In each of the 62 villages, the 2005 field team surveyed all of the wells that BAMWSP had tested and approached well owners' wives (or a close female relative) to conduct a short survey. A total of 3,056 households were interviewed (at 3,056 distinct wells, i.e., one per well).
Sources and timeline for key variables

We returned during January–April of 2008 to record the well switching during 2005–2008. We exclude from our analyses: one village with 52 surveyed households, where we pre-tested our survey; and two villages with six surveyed households, due to time constraints. In each of the remaining 59 villages, a random number was generated for each well listed in the 2005 study and the interviews were conducted in ascending order of those numbers. We could not interview all households, thus those living within villages with fewer (more) households are over (under)-sampled. To address these unequal probabilities of selection we use sampling weights, finding no statistically significant differences between results with and without weights. Our 2008 sample includes 1,557 households from 59 villages.
The Bangladesh Medical Research Council and Columbia's Institutional Review Board approved the 2005 well testing and test reporting in Araihazar. The 2005 field team recorded the Global Positioning System (GPS) coordinates of the well, the color of paint applied to the well by BAMWSP (if still visible), respondents' recollections of their test result, and self-reported switching behavior for 2003–2005 (see table 1 for data timing). The Institutional Review Board for the Protection of Human Subjects in Non-Medical Research at Duke University approved the 2008 study in Araihazar (protocol #2184). Informed consent was obtained at the start of the interviews. In the 2008 survey, we recorded self-reported well switching for 2005–2008 and for 2003–2005, recollections of test results, socioeconomic indicators and motivations for leaving wells during 2003–2008.
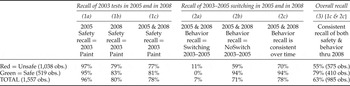
As we asked households in 2008 to again recall their switching choices during 2003–2005, we were able to check the consistency of reported behavior by comparing these responses with what was reported about 2003–2005 switching to Schoenfeld (Reference Schoenfeld2005). In 78 per cent of cases, the responses matched (table 2, column 2c totals). Among those 22 per cent where responses did not match, 12 per cent of households reported in 2005 that they switched during 2003–2005 but then reported in 2008 that they had not, while 10 per cent of the households reported in 2005 that they had not switched during 2003–2005 but then reported in 2008 that they had switched.
Recall: 2003 test results and 2003–2005 switching behavior

Notes: Columns 1a, 1b and 1c report the percentage of unsafe, safe and total households whose recollections of test results matched the color of paint applied on the well-heads in 2003, and observed by the study team in 2005.
Columns 2a and 2b report the percentage of safe, unsafe and total households with consistent recollections of 2003–2005 switching decisions (with those who switched in 2a and those who did not in 2b). Households were asked to report 2003–2005 behavior in 2005 and again asked to report 2003–2005 behavior in 2008.
Column 3 reports the percentage of unsafe, safe and total households who consistently recalled both of their arsenic test results and their 2003–2005 switching behaviors, from 2003 through 2008, i.e., our core sample.
We also compared recollections of well safety across the 2005 and 2008 surveys to check for consistency in the recall of well-test results. We merged the 2008 responses regarding the perceived safety of wells tested by BAMWSP with observations made in 2005 regarding the color applied to the well by BAMWSP, as well as the households' perceptions in 2005 about the arsenic safety of the same well. We find that 78 per cent of households consistently recalled their well-safety perceptions in both 2005 and 2008 (table 2, column 1c totals).
4.2. Descriptive statistics
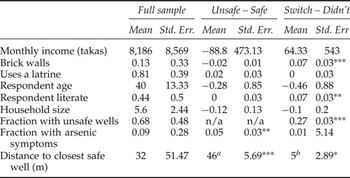
For our full sample of 1,557 households, the average number of household members was six (table 3). Almost all interview respondents (98 per cent) were female heads of household, i.e., those primarily responsible for water-source choices. Respondents were 40 years old on average, often illiterate (44 per cent could read and write in Bangla), and had a relatively low mean monthly household income (8,186 Takas, or US$356 using a purchasing power parity rate of 23 Takas to US$1, World Bank, 2008). While 81 per cent of households had access to a latrine, only 13 per cent owned dwellings with brick walls. Self-reports indicated that 9 per cent had at least one member who had displayed symptoms of related illnesses. Across all households, the average distance to a safe well was 32 m (Schoenfeld, Reference Schoenfeld2005), consistent with our prior finding that most of the households in this area were not far from at least one safe source.
Descriptive statistics

Notes: *, ** and *** denote significance at 10%, 5% and 1%, respectively.
a The distance to safe for households with safe wells is zero, so this is the average for unsafe wells.
b The distance to safe is higher for those who switch because most switching is from unsafe wells, influencing also the coefficient in table 5, which differs if studying unsafe wells (as in table 4).
Source: Authors' 2008 survey, all calculated using sampling weights and clustering at the village level.
5. Results
Before focusing on the evolution of well-switching responses, we confirm that on average arsenic testing influenced well switching across our full two-period sample of 1,557 wells.Footnote 2 About one-third (519) of the sample households received a safe test result from BAMWSP by 2003. Of these, 85 per cent never switched wells by 2008. Of the two-thirds (1,038) of sample households that received unsafe results in 2003, 59 per cent never switched by 2008. Thus, more switching was observed at unsafe wells as fewer stayed put than at safe wells (p<0.0001).
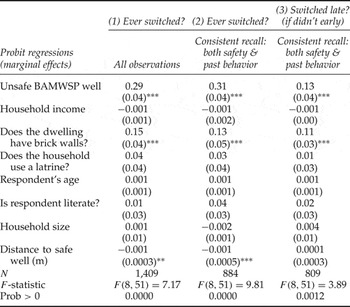
Table 4 repeats the comparison above, controlling for factors that affect switching such as household income and distance to a safe well, which we use henceforth in all regressions.Footnote 3 We also want to address any incorrect recall by restricting our sample to households with consistent recall over time of arsenic-test results and well switching during 2003–2005.Footnote 4 Most households recalled their pre-2003 arsenic test results correctly in 2005 and in 2008 (77 per cent of unsafe, 81 per cent of safe; table 2, column 1c) and most households consistently recalled their 2003–2005 decisions about whether or not to switch (70 per cent of unsafe, 94 per cent of safe; table 2, column 2c).Footnote 5 Combining these filters, 985 households (575 or 55 per cent of unsafe, 410 or 79 per cent of safe) consistently recalled both test results and 2003–2005 switching through 2008 (table 2, column 3). As in column 2 of table 4, we focus on these 985 households controlling for other factors.
Well switching and arsenic test results

Notes: Binary dependent variable is equal to one if the household switched from the well during the time period.
All regressions consider the households that recalled their switching behaviors during 2003–2005 consistently. In columns 2 and 3, we additionally filter observations to only those households who consistently perceived the arsenic status of their well correctly in both the 2005 and 2008 surveys.
Perfect recall indicates that the households were able to consistently report their 2003 test result in 2005 and in 2008, along with consistently reporting their 2003–2005 switching behaviors in both 2005 and 2008.
Estimates are adjusted using sampling weights, and have been corrected for intra-village correlation.
Standard errors are in parentheses, with *, **, *** indicating significance at 10%, 5% and 1%, respectively.
Source: Authors' calculations from 2005 and 2008 survey.
5.1. Did the behavioral impact of arsenic testing erode or increase over time?
We examine first the 2005–2008 choices by those 985 households with consistent test and behavior recall (in section 5.2 we study inconsistent recall and the impacts of lost arsenic information). For those who had switched in the first period, we check whether switches were persistent. For households who had not switched in the first period, we look for later well switching. Test impacts may erode if early well switching is reversed later, and that effect dominates. Yet impacts can rise if early well switching is persistent and later well switching occurs.
5.1.1. Persistence of early switching away from arsenic-unsafe wells
We consider the hypothesis that some early switchers who had switched during 2003–2005 might have returned during 2005–2008 to the unsafe wells that they had left earlier. In fact, we find that the vast majority of early switchers from unsafe wells stuck with their choices. Of the 16 per cent of households at unsafe tested wells who had switched wells during 2003–2005, 14 per cent (or almost 88 per cent of the early switchers) did not switch wells again during 2005–2008. This implies a very high level of persistence of early switching. Further, not one of the 2 per cent at unsafe wells who switched twice moved back in 2005–2008 to their 2003 unsafe well (two-thirds reported the later switches as being to another well they perceived to be safe).
5.1.2. Arsenic testing's impact on late switching for early non-switchers
We consider next the hypothesis that some of the households who did not switch earlier decided to switch wells later, i.e., during 2005–2008 – and we find that 17 per cent of them did. Given a 16 per cent rate of early switching from unsafe wells, the second-period well switching approximately doubles the fraction of households who had ever switched wells by 2008.
To link the 2005–2008 switching to arsenic tests that BAMWPS had provided before 2003, we check whether the late switching rates differ for households with safe and unsafe wells and, in particular, for households mentioning arsenic as one driver of switching decisions. Of the 128 households at unsafe wells who explicitly mentioned arsenic as one motivation, 26 per cent switched wells only later. In contrast, of the 372 households at safe wells who stated that they perceived their water was arsenic safe, not even 1 per cent switched during 2005–2008.
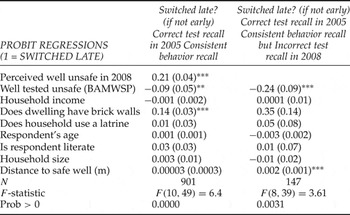
We formalize such a comparison in the regression presented in column 3 of table 4, where we show that households with unsafe wells who did not switch early were 13 per cent more likely to switch wells late than were those households at safe wells who had not switched early. The difference is statistically significant, highlighting the underlying fact that while 54 per cent of our sample is at unsafe wells, 75 per cent of 2005–2008 switches took place at unsafe wells.
5.2. Would it help to reinforce the provision of arsenic information?
We next consider the effects of a loss of arsenic information over time on well switching. Arsenic-safety perceptions changed by 2008 for 22 per cent of 1,557 households (table 2, column 1c). In 2005, BAMWSP's paint was visible on all 1,557 wells (1,038 unsafe, 519 safe) and almost all households (97 per cent at unsafe, 95 per cent at safe) recalled the arsenic safety of primary drinking wells (table 2, column 1a). By 2008, paint was rarely discernible. Only 77 per cent of those households at unsafe and 81 per cent at safe wells correctly recalled the 2003 well-test results (table 2, column 1c).
Table 5 links the changes in arsenic recall to well-switching decisions during 2005–2008. Column 1 shows that safety perceptions are critical by including as explanatory factors not only safety perceptions but also tested well safety. A perceived lack of safety raises switching. Tested safety, in contrast, appears to reduce switching. That is driven by those households at unsafe wells who came to believe their wells were safe and did not switch, along with households at safe wells who came to believe their wells were unsafe and thus switched.
Well switching and arsenic test recall

Notes: Estimates are adjusted using sampling weights, and have been corrected for intra-village correlation.
Standard errors reported in parentheses. *, **, *** indicate significance at 10%, 5% and 1%, respectively.
Source: Authors' calculations from 2005 and 2008 survey.
Column 2 looks at households with inaccurate recall to study its switching consequences. Starting with statistics, among safe-well households who changed their safety perceptions, 26 per cent switched in 2005–2008, while among those at unsafe wells who changed perceptions only 11 per cent switched in 2005–2008. Thus, the loss of information yielded perverse switches. Column 2 of table 5, for households who did not switch early, links actual well safety to switching in 2005–2008 conditional on inaccurate test recall. Households at unsafe wells had a 24 per cent lower probability of switching (p<0.01) – suggesting a potential impact from reinforcing information about arsenic risk to reduce the probability of perverse switching.
6. Discussion
We found that the behavioral responses to arsenic tests of well water increased over time, due to the persistence of early well switches alongside new switches in the second period. We also found a significant share of households who, by 2008, could no longer recall the test results provided before 2003. This loss of information affected behavior perversely.Footnote 6
Testing wells is cheap, at least compared to solutions such as piping and treatment of water (World Bank, 2005; Johnston et al., Reference Johnston, Hanchett and Khan2010). Our results suggest that inexpensive tests led to departures from unsafe wells within two years which persisted at least another three years, plus further well switching years after testing. Nationwide, switching following testing is responsible for most of the reduction in arsenic exposure in Bangladesh to date (Ahmed et al., Reference Ahmed, Ahuja, Alauddin, Hug, Lloyd, Pfaff, Pichler, Saltikov, Stute and van Geen2006). Yet well testing still receives less attention than capital-intensive interventions.
Nothing better demonstrates that lack of attention than the fact that no public well testing has occurred since 2003. In 2008, we found that one-fifth of households could no longer recall accurately the test results they had received before 2003. With the passage of time such a loss of information likely has continued, and worsened, with perverse outcomes. This suggests a potential gain from reinforcing environmental health risk information.
Further, due to the ongoing installation of new private wells, at least one-third of wells in Bangladesh are untested for arsenic (WASH Research Team, 2008; George et al., 2002; Schoenfeld, Reference Schoenfeld2005, records cases of households staying at untested wells and households switching to untested wells, again suggesting a gain from further well testing). Thus, a significant fraction of the rural population is potentially being exposed to risks of arsenic-induced illnesses. As many health risks from arsenic are higher if the arsenic exposure is longer, our results suggest the ongoing lack of well testing is missing an opportunity to help such vulnerable populations.