




No CrossRef data available.
HOW TO OBTAIN BATHTUB-SHAPED FAILURE RATE MODELS FROM NORMAL MIXTURES
Published online by Cambridge University Press: 01 October 2004
Abstract
We obtain some techniques to study the shape of reliability functions (failure rate, mean residual life, etc.) by using the s-equilibrium distribution of a renewal process defined by Fagiuoli and Pellerey (Naval Res. Logist., 1993). We apply these techniques to study how to obtain distributions with bathtub shaped failure rate (BFR) from mixtures of two positive truncated normal distributions.
Information
- Type
- Research Article
- Information
- Probability in the Engineering and Informational Sciences , Volume 18 , Issue 4 , October 2004 , pp. 511 - 531
- Copyright
- © 2004 Cambridge University Press
1. INTRODUCTION
In reliability theory and survival analysis, a positive random variable X usually represents the life length of a unit or a component in a system. Let us suppose that X is an absolutely continuous random variable with density function f (t). In this context, the distribution function F(t) = Pr(X ≤ t) represents the probability of failure before time t and the reliability function R(t) = Pr(X ≥ t) represents the probability of correct functioning at time t.
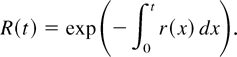
The most used functions to describe the aging of the units are the failure rate r(t) = f (t)/R(t) and the mean residual life μ(t) = E(X − t|X ≥ t). It is well known that both of them uniquely determine the distribution function (i.e., they have all of the information about the model). For example, the inversion formula for r(t) is
These functions are also used to compare and classify different units. The definitions for the likelihood ratio (≤lr), failure rate (≤fr), and mean residual life (≤mrl) orders and increasing (decreasing) failure rate (IFR (DFR)) and decreasing (increasing) mean residual life (DMRL (IMRL)) classes can be found in [20]. It is well known that
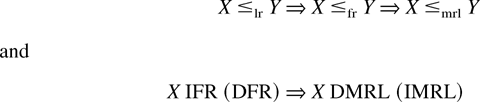
Throughout, increasing (decreasing) means nondecreasing (nonincreasing).
In this context, we use positive random variables and, hence, the Normal distribution N(μ,σ) is replaced by the positive truncated Normal distribution N+(μ,σ), defined by the density

and Φ(x) is the standard Normal distribution. Note that if X ≡ N+(μ,σ), then E(X) > μ and Var(X) < σ2. If μ + 3σ >> 0, then

. The failure rate for the positive truncated Normal coincides with the failure rate for the Normal distribution (Mill's ratio) for t > 0 and, hence, it is increasing.
However, in practice, the failure rates estimated from datasets have a bathtub shape, denoted by BFR; that is, they first strictly decrease from 0 to t1, then they are constant from t1 to t2 (t1 ≤ t2), and, finally, they increase from t2 to ∞. The failures in the first period are called early failures and they are due to manufacturing defects. The failures in the second period (useful life period) are called chance failures and the failures in the last period (wear out) are due to the aging process. The times t1 and t2 are called change points.
Analogously, a model has an upside-down failure rate (UFR) if r(t) strictly increases from 0 to t1, it is constant from t1 to t2 (t1 ≤ t2) and it decreases from t2 to ∞. Similar classes (BMRL and UMRL) can be defined for the mean residual life. We use the following notation. A model is IBFR when r increases in (0,t0) and it has a bathtub shape in (t0,∞). Analogously, a model is BBFR when it is BFR in (0,t0) and BFR in (t0,∞).
In the last 20 years, many theoretical models with BFRs have been proposed from different methods (see the reviews in [14,17]). In this article, we show that BFRs can be obtained from a mixture of two positive truncated normal models with IFRs. In our opinion, this is the correct way to obtain a BFR distribution because it explains why this shape arises naturally from a mixture of two different kind of units (units with and without manufacturing defects).
Few articles study how to obtain BFR distributions from mixtures. Krohn [13] proposed obtaining BFR models from a mixture of three Weibull distributions (a DFR Weibull for the early failures, an exponential for the useful life period, and an IFR Weibull for the wear period). Vaupel and Yashin [22] obtained plots of BFR models from mixtures of an exponential and a model with linear failure rate. Unfortunately, these results are not true when t → ∞ since the failure rate of the mixture is equal to the failure rate of strong units when t → ∞ (see [3]). Glaser [8], Gupta and Warren [9], and Wondmagegnehu [23] studied special cases of Weibull and gamma mixtures. Other interesting articles that study, in general, the shape of the failure rate obtained from a mixture are [1,3,4,10,15,21].
The article is organized as follows. In Section 2, we introduce the model. In Sections 3 and 4, we obtain some general techniques to determine the shape of r(t) and μ(t) and then, in Section 5, we study the mixtures of positive truncated Normal distributions. Finally, in Sections 6 and 7, we give some examples and remarks on this model from a practical point of view.
2. THE MODEL
Let us suppose that an absolutely continuous positive random variable Xp is a mixture of two random variables X1 and X0. Hence, the density fp is a mixture of two densities f1 and f0,

where 0 ≤ p ≤ 1, the reliability (or survival function) is also a mixture,

and the failure rate and the mean residual life are dynamic mixtures,


where

Hence,

Moreover, from [3], we have, under some mild conditions,

It is well known that if X0 and X1 are DFR, then Xp is also DFR. However, the result is not true for IFR distributions.
If X1 represents correct manufactured units and X0 represents units with manufacturing defects, then the following practical assumptions can be made:
(i) p > p0 (e.g., p > 0.5);
(ii) X1 ≥fr X0;
(iii) X1 and X0 are IFR;
(iv) r1(0) < r0(0).
Do these conditions imply a BFR mixture? In general, the answer to this question is negative, but we are interested in studying it in mixtures of positive truncated normal models. Note that condition (ii) implies R1(t) ≥ R0(t) and E(X1) ≥ E(X0). Condition (iv) implies f0(0) > 0. Note that in the IFR Weibull model, this condition does not hold, and, hence, we cannot obtain a BFR mixture.
3. GENERAL RESULTS
Glaser [8] used the function η(t) = −f′(t)/f (t) to study the failure rate shape. Glaser's result is very useful since, in many models, it is easier to study η(t) than r(t). For example, in the normal model, r(t) does not have an explicit expression but η(t) = (t − μ)/σ2, and hence, from Glaser's result, r(t) is increasing. The function η(t) can be also used to characterize the likelihood ratio order (X ≤lr Y [hArr ] ηX(t) ≥ ηY(t)) and the increasing and decreasing likelihood ratio classes (ILR, DLR) by the monotonicity η(t). The ILR class is usually defined by the logconcavity of the density function (see [20, p.405]) and it is equivalent to the class of PF2 densities defined in [2]. From Glaser's result, we have that ILR (DLR) implies IFR (DFR). Analogously, we can define the BLR class when η(t) has a bathtub shape, and the ULR, IBLR, DULR, BBLR, and UULR classes (we use the same notation for the classes defined by η(t) as that used for the classes defined by r(t) or μ(t)).
Recently, Gupta and Warren [9] have extended Glaser's result, showing that r′(t) = 0 has at most one solution on the closed interval [zk−1,zk], where z0 = 0 < z1 < ··· < zn are the zeros of η′(t). They also showed that r′(t) = 0 does not have any solution in (zn,∞). In Theorem 4.3 of [9] they extend Glaser's result, showing that IBLR (DULR) implies IFR, BFR, or IBFR (DFR, UFR, or DUFR). Similar results were obtained independently by Block, Savits, and Singh [5]. We have extended this result in the following lemma.
Lemma 1: If r′(t) is continuous in (0,∞) and r(t) strictly increases (decreases) in (a,b) and strictly decreases (increases) in (b,c), then η(t) strictly increases (decreases) at b.
The proof is obtained from

and

Thus, if X is BBLR, then it is IFR, BFR, IBFR, or BBFR (i.e., r has an easier shape than η with the same monotonicity at the end).
The equilibrium distribution of a renewal process associated with a positive random variable X with mean μ is determined by the density
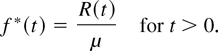
We denote by X* a random variable having this density. It is well known (see, e.g., [6,11]) that r*(t) = 1/μ(t). Moreover, we note that η*(t) = r(t).
If E(Xs) < ∞, Fagiuoli and Pellerey [6], defined the s-equilibrium distribution of a renewal process associated to X as the distribution of

. If X(s) denotes a random variable having the s-equilibrium distribution, then X(0) =st X, X(1) =st X*, X(2) =st X**, and so forth, where =st denotes equality in law. They also defined the s-CLASS by

For example, 1-IFR = DMRL. Analogously, the s-order is defined by

and the s-function by

For example, the 1-lr order is the hr order, the 2-lr order is the mrl order, and the 1-failure rate is r(1)(t) = 1/μ(t). Analogously, we note that if E(Xs) < ∞ for s = 2,3,…, then
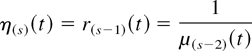
and

Hence, Glaser's and Gupta and Warren's results can be applied to η(s)(t) and r(s)(t) = η(s+1)(t), obtaining respectively the two following theorems.
Theorem 2: If E(Xs+1) < ∞ for s = 0,1,2,…, then
1. η(s) increasing (decreasing) ⇒ η(s+1) increasing (decreasing);
2. η(s) bathtub (upside-down) ⇒ η(s+1) bathtub or increasing (upside-down or decreasing).
Theorem 3: If E(Xs+1) < ∞ for s = 0,1,2,…, then η(s+1)′(t) = 0 has at most one solution on the closed interval [zk−1,zk], where z0 = 0 < z1 < ··· < zn are the zeros of η(s)′(t) and η(s+1)′(t) = 0 does not have any solution in (zn,∞).
Remark 4: Note that the shape of η(s+1) (r(s+1) or μ(s+1)) is easier than η(s) (r(s) or μ(s)). For example, if η(s) is increasing (decreasing), then η(s+k) is increasing (decreasing) for k = 1,2,… In particular, if s = 1, from (10), the shape of μ(t) can be obtained from the shape of r(t). For example, from Glaser's result, we obtain the well-known result IFR (DFR) ⇒ DMRL (IMRL) and, if r(t) is BFR (UFR), then μ(t) is DMRL or UMRL (IMRL or BMRL) and the change point for μ(t) is smaller than the change point for r(t) (another well-known result). Theorem 3 in [16] and Theorem 2 in [7] are now immediate. Moreover, the formulas for η(t) and r(t) can be translated to r(t) and μ(t). For example, (8) gives

Remark 5: If X has a decreasing density function f (t), then we can define the preceding equilibrium distribution X(−1) by the reliability R(−1)(t) = f (t)/f (0). Obviously, X(−1)* =st X. Hence, we can study the shape of η(r,μ) from the shape of η(−1)(t) = −f′′(t)/f′(t). Analogously, if the ith derivative f(i)(t) ≤ 0 for i = 1,…,s, then we can define X(−s) and use η(−s) to study η(r,μ).
Remark 6: The results given by Rojo [18] for age-smooth distributions can be also translated to the equilibrium distributions since it is also age-smooth. For example,

((iii) in Theorem 2.1 in [18]) can be obtained (by using (ii) in Theorem 2.1 in [18]) from the mild condition
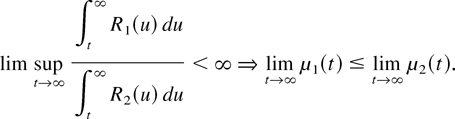
Lemma 2.1 in [18] can be also translated to η and r when f is decreasing and X(−1) is age-smooth of index −ρ.
4. GENERAL RESULTS FOR MIXTURES
To apply Glaser's and Gupta and Warren's results to mixtures, we note that from (2), ηp(t) = −fp′(t)/fp(t) is also a dynamic mixture:

where

Moreover, we note that the equilibrium distribution of a mixture is another mixture (with different weights) of the equilibrium distributions of the components; that is,
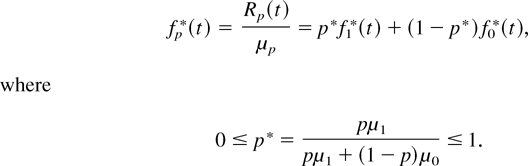
Analogously, the s-equilibrium distribution of a mixture is another mixture of the s-equilibrium distributions of the components. Hence, from the results given in the preceding section, the results obtained for the failure rate of mixtures can be translated to the mean residual life of mixtures by using (10). Analogously, the results obtained for η(t) in mixtures can be translated to r(t), 1/μ(t), and, in general, η(s)(t). For example, the mixture of two IMRL distributions is also IMRL. Moreover, Theorems 2.1 and 2.2 obtained by Block and Joe [3] can be applied to μ(t), obtaining, under some conditions, the following theorem.
Theorem 7: The asymptotic behavior of the mean residual life of the mixture is equal to that of the mean residual life of stronger components; that is, if μ1(t) ≥ μ0(t), then

We use the following notation g(t) [nearr ] ([searr]) c as t → ∞, when limt→∞ g(t) = c and there exists t′ such that g(t) increases (decreases) for t > t′.
We have obtained the following results.
Proposition 8: If 0 < p < 1 and r1(t) ≤ r0(t) for t ≥ t1, then the following hold:
1. R0(t)/R1(t) [searr] K ≥ 0 as t → ∞.
2. p(t) [nearr ] K′ = p/[p + (1 − p)K] ∈ (0,1] as t → ∞.
3. If lim inft→∞ r0(t)/r1(t) > 1, then K = 0 and K′ = 1.
4. If limt→∞ r0(t)/r1(t) = c, then limt→∞ f0(t)/f1(t) = K and limt→∞ w(t) = K′. Moreover, K = 0 or c = 1.
5. If limt→∞ η0(t)/η1(t) = c′ and limt→∞ r0(t)/r1(t) = c, then limt→∞ f0′(t)/ f1′(t) = K. Moreover, K = 0 or c′ = 1.
6. If μ1(t) ≥ μ0(t), η0(t)/η1(t) decreases to c′, and f0(t)/f1(t) decreases to K, then ηp(t)/η1(t) decreases to 1.
Proof: From (1), we have

If r1(t) ≤ r0(t) for t ≥ t1, then R0(t)/R1(t) decreases to K ≥ 0. Hence, we obtain item 2 from (5).
Moreover, if lim inft→∞ r0(t)/r1(t) > 1, then there exist d > 1 and t2 > 0 such that r0(t) > dr1(t) > r1(t) for t > t2. Thus, we have

From (1), it is easy to show that

, and, hence, K = 0 and K′ = 1.
Moreover, as

if limt→∞ r0(t)/r1(t) = c, then
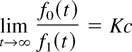
and, from L'Hôpital, we obtain

and K = 0 or c = 1. Moreover, limt→∞ w(t) = K′.
To obtain item 5, we note that
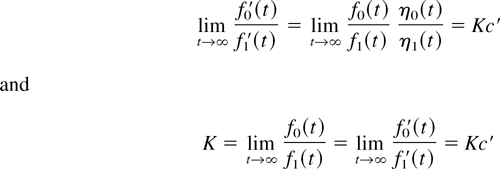
hold. Moreover, item 6 is obtained from

Remark 9: If r1(t) ≤ r0(t) for all t, then R0(t)/R1(t) decreases and p(t) increases for all t. Moreover, note that

holds, and, hence, if r0 /r1 decreases, then rp /r1 decreases to 1 for all p > 0. This result was given by Block and Joe [3]. Also note that if r0 /r1 decreases, then f0 /f1 decreases and w increases. Block and Joe's result can be also obtained from item 6 and (10). Analogously, from Section 3 results, we obtain that if μ0(t) ≤ μ1(t) and μ0(t)/μ1(t) increases, then μp(t)/μ1(t) increases to 1.
Moreover, we have the following result.
Proposition 10: If (2) holds, then

Proof: From (3) and (5), we have

and, hence, (16) holds. █
Remark 11: We note that expression (3.2) in Gupta and Warren [9] is wrong. In particular, from (16), we obtain the following well-known result: If both X1 and X0 are DFR, then the mixture is DFR. We can obtain similar results for η(t), μ(t), and, in general, η(s)(t).
5. MIXTURES OF POSITIVE TRUNCATED NORMAL DISTRIBUTIONS
First, we give some properties for positive truncated Normal distributions. Some of these properties are also true for (untruncated) Normal distributions.
Proposition 12. If X ≡ N+(μ,σ), then the following hold:
1. η(t) = (t − μ)/σ2.
2. r′(t) = (r(t) − (t − μ)/σ2)r(t).
3. r (t) > (t − μ)/σ2.
4. E(X) = μ + σ2r(0).
5. r(t) increases to ∞ as t → ∞.
6. μ(t) decreases to 0 as t → ∞.
7. limt→∞ r(t)/t = 1/σ2.
8. r(t) − (t − μ)/σ2 decreases to 0 as t → ∞.
9. limt→∞ tμ(t) = σ2.
10. limt→∞(1/μ(t)) − (t − μ)/σ2 = 0.
11. limt→∞ r′(t) = 1/σ2.
Proof: From the definitions and (8), items 1 and 2 are immediate. Moreover, from Kotz and Shanbhag [12] (see also [19]), we have

for t ≥ 0, and, hence, items 3 and 4 hold.
From items 2 and 3, r(t) increases and μ(t) decreases for all t. Moreover, from item 3 and (9), limt→∞ r(t) = ∞ and limt→∞ μ(t) = 0. Hence,

Analogously, from (17), we obtain
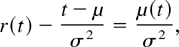
which decreases to 0 as t → ∞.
Applying L'Hôpital, we have

and, hence, item 9 holds.
Analogously, from (17), we obtain

and, hence, item 10 holds. Finally, from item 2 and (17), we have
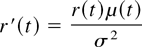
and, hence,

holds. █
Remark 13: Note that the asymptotic behavior of a normal failure rate is equivalent to a linear failure rate. If g(t) = r(t) − (t − μ)/σ2 and r*(t) is the failure rate of a standard normal, then g(μ + kσ) = (r*(t) − k)/σ. Hence, for k = 3, we obtain g(t) ≤ 0.283099/σ for t ≥ μ + 3σ.
We consider now a mixture of two positive truncated Normal distributions Xi ≡ N+(μi,σi), i = 0,1. First, we note that the failure rate of the mixture of truncated Normal distributions is not equal to the failure rate of a mixture of (untruncated) Normal distributions in t > 0. We have obtained the following properties.
Proposition 14: If Xp is a mixture of X0 ≡ N+(μ0,σ0) and X1 ≡ N+(μ1,σ1), with 0 < p < 1 and X1 ≥fr X0, then the following hold:
1. σ12 ≥ σ02.
2. limt→∞ r0(t)/r1(t) = σ12/σ02 ≥ 1.
3. If σ12 > σ02, then R0(t)/R1(t) decreases to 0 and p(t) increases to 1 as t → ∞.
4. If σ12 > σ02, then f0(t)/f1(t) [searr] 0 and w(t) [nearr ] 1 as t → ∞.
5. If σ12 = σ02, then μ0 < μ1, f0(t)/f1(t) decreases to 0, w(t) increases to 1, R0(t)/R1(t) decreases to 0, and p(t) increases to 1 as t → ∞.
6. If (t − μ1)/σ12 < (t − μ0)/σ02, then w(t) increases.
7. If μ0 < μ1 (>), then r0(t)/r1(t) [searr] σ12/σ02 ([nearr ]) and rp(t)/r1(t) [searr] 1 as t → ∞.
8. ηp′(t) = w(t)(1/σ12) + (1 − w(t))(1/σ02) − w(t)(1 − w(t))((t − μ1)/σ12 − (t − μ0)/σ02)2.
9. ηp(t) [nearr ] ∞ as t → ∞.
Proof: Items 1–3 can be obtained from Propositions 8 and 12. Items 4–6 can be obtained from

To obtain item 7, we note that the asymptotic behavior of r0 /r1 is equal to that of

which decreases (increases) to σ12/σ02 when μ0 < μ1 (>). The property for rp /r1 is obtained from (15). Moreover, from (12),

where
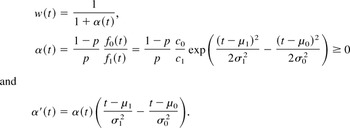
Thus, differentiating, we have

and, hence, result 8 holds. Moreover, limt→∞ ηp′(t) = 1/σ12 > 0 because

Thus, result 9 holds. █
Corollary 15: If Xp is a mixture of X0 ≡ N+(μ0,σ0) and X1 ≡ N+(μ1,σ1), with 0 < p < 1, σ1 = σ0, and δ = σ02/(μ0 − μ1)2, then

Moreover, the change points of ηp are determined by

Proof: If σ1 = σ0, then from the preceding proposition,

and ηp′(t) ≥ 0 if and only if (1 − w(t))w(t) ≤ δ.
As x(1 − x) ≤ ¼ for 0 < x < 1, then ηp′(t) > 0 when δ > ¼. Hence, from Glaser's result, the mixture is IFR. As w(t) increases, the same result holds when

, and

If

, and

then there exist z1 > 0 such that w(z1)(1 − w(z1)) = δ, ηp′(z1) = 0, ηp′(t) < 0 for 0 < t < z1 and ηp′(t) > 0 for t > z1. Thus, from Glaser's result, Xp is BFR or IFR.
The same result holds when

, and

If

, and

then there exist z1 < z2 such that w(zi)(1 − w(zi)) = δ, i = 1,2, ηp′(t) > 0 for 0 < t < z1, ηp′(t) < 0 for z1 < t < z2, and ηp′(t) > 0 for t > z1. From Theorem 4.3 in [9], Xp is IFR, BFR, or IBFR. █
We have obtained a general result when the variances are not equal and η0(t) ≥ η1(t).
Corollary 16: If Xp is a mixture of X0 ≡ N+(μ0,σ0) and X1 ≡ N+(μ1,σ1), with 0 < p < 1, σ1 > σ0, and η0(t) ≥ η1(t) for t > 0, then the following hold:
1. If w(0) ≥ x1 and γ(0) ≥ 0, then Xp is IFR.
2. If w(0) ≥ x1 and γ(0) < 0, then Xp is IFR or BFR.
3. If w(0) < x1 and γ(t1) ≥ 0, then Xp is IFR.
4. If w(0) < x1 and γ(t1) < 0, then Xp is IFR, BFR, or IBFR,
where
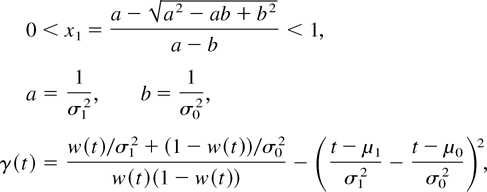
and t1 is uniquely determined by w(t1) = x1.
Proof: First, we note that η0(t) ≥ η1(t) (X1 ≥lr X0) implies X1 ≥fr X0. Hence, from the preceding proposition, w(t) increases, limt→∞ w(t) = 1, and ηp′(t) ≥ 0 (≤) if and only if γ(t) ≥ 0 (≤). Thus,

where

and 0 < a = 1/σ12 < b = 1/σ02. Thus, p(0) = −b and p(1) = a, and p(x) = 0 has a unique solution x1 in (0,1). Hence, as w increases, if w(0) ≥ x1, then γ(t) increases for all t and we have properties 1 and 2. If w(0) < x1, then γ(t) has a minimum at t1 > 0, where t1 is uniquely determined by w(t1) = x1, and we obtain properties 3 and 4. █
The following corollary completes the possible cases.
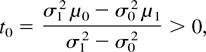
Corollary 17: If Xp is a mixture of X0 ≡ N+(μ0,σ0) and X1 ≡ N+(μ1,σ1), with 0 < p < 1, σ1 > σ0 and
then the following hold:
1. If w(t0) ≥ x1, then Xp is IFR.
2. If w(t0) < x1, w(0) < x1, γ(0) ≥ 0, and γ(t1) ≥ 0, then Xp is IFR.
3. If w(t0) < x1, w(0) < x1, γ(0) < 0, and γ(t1) ≥ 0, then Xp is IFR or BFR.
4. If w(t0) < x1, w(0) < x1, γ(0) ≥ 0, and γ(t1) < 0, then Xp is IFR, BFR, or IBFR.
5. If w(t0) < x1, w(0) < x1, γ(0) < 0, and γ(t1) < 0, then Xp is IFR, BFR, IBFR, or BBFR.
6. If w(t0) < x1, w(0) ≥ x1, γ(0) > 0, γ(t1) ≥ 0, and γ(t2) ≥ 0, then Xp is IFR.
7. If w(t0) < x1, w(0) ≥ x1, γ(0) ≤ 0, and γ(t2) ≥ 0, then Xp is IFR or BFR.
8. If w(t0) < x1, w(0) ≥ x1, γ(0) > 0, and γ(ti) ≥ 0 for i = 1 or i = 2, then Xp is IFR, BFR, or IBFR.
9. If w(t0) < x1, w(0) ≥ x1, γ(0) ≤ 0, and γ(t2) < 0, then Xp is IFR, BFR, IBFR, or BBFR.
10. If w(t0) < x1, w(0) ≥ x1, γ(0) > 0, γ(t1) < 0, and γ(t2) < 0, then Xp is IFR, BFR, IBFR, BBFR, or IBBFR.
where t1 and t2 are uniquely determined by w(t) = x1 and t1 < t2.
Proof: First, we note that

and, hence, w decreases in (0,t0) and increases in (t0,∞). Moreover, 0 < p < 1 and σ1 > σ0 imply that limt→∞ w(t) = 1. Hence, taking into account that γ(t0) ≥ 0, we have the following cases:
If w(t0) ≥ x1, from (18), the sign of γ′(t) is the same as that of η0(t) − η1(t), and we obtain item 1.
If w(t0) < x1 and w(0) < x1, then w(t) = x1 has a unique positive solution t1 > t0. Hence, from (18), γ increases in (0,t0), decreases in (t0,t1), and increases in (t1,∞), and we obtain items 2–6.
If w(t0) < x1 and w(0) ≥ x1, then w(t) = x1 has two positive solutions t1 and t2 such that t1 < t0 < t2. Hence, from (18), γ decreases in (0,t1), increases in (t1,t0), decreases in (t0,t2), and increases in (t2,∞), and we obtain items 6–10. █
Remark 18: Note that

and, hence, the preceding corollary includes all possible cases. Moreover, rp′(0) > 0 (<) if and only if rp(0) > ηp(0) (<). We also note that from the results given in Section 3, we have the shape and some information about the change points of μ(t).
Moreover, we have the following properties.
Proposition 19: If Xp is a mixture of X0 ≡ N+(μ0,σ0) and X1 ≡ N+(μ1,σ1) with 0 < p < 1 and X1 ≥fr X0, then the following hold:
1. rp′(t) = p(t)(r1(t) − (t − μ1)/σ12)r1(t) + (1 − p(t))(r0(t) − (t − μ0)/σ02) ×r0(t) − p(t)(1 − p(t))(r1(t) − r0(t))2.
2. rp′(t) = (p(t)r1(t) + (1 − p(t))r0(t))2 − (p(t)[(t − μ1)/σ12]r1(t) + (1 − p(t))[(t − μ0)/σ02]r0(t)).
3. If 0 ≤ t ≤ min(μ1,μ0), then rp′(t) > 0.
4. rp(t) [nearr ] ∞ as t → ∞.
Proof: The proof of item 1 is immediate from (16) and item 2 can be obtained from item 1 since

Hence, item 3 is obtained from item 2. Moreover, as limt→∞ p(t) = 1 and limt→∞ Rp(t)/R0(t) = ∞, then

which is equal to 0 (σ1 = σ0) or ∞/∞ (σ1 > σ0). In the second case, we have

since, from Proposition 12, rp → r1 and ri′ → 1/σi2, as t → ∞. Hence, from (16)
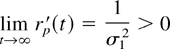
and property 4 holds. █
Remark 20: From the preceding proposition, if f0(0) >> f1(0) ≅ 0 (i.e., μ1 + 3σ1 >> 0), then rp′(0) < 0 if and only if
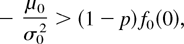
which implies μ0 < 0. This condition is equivalent to comparing η0(0) with rp(0) ≅ (1 − p)r0(0). In particular, if η0(0) ≅ r0(0) (or if X0 has a linear failure rate), then (19) holds. Also note that if μ0 < 0 and p → 1, then (19) holds. Note that in the case w(0) ≅ 0, w increases and ηp′(0) ≅ 1/σ02 > 0. Hence, if (19) holds, then Xp is BFR.
Remark 21: Corollaries 15–17 can also be applied to (untruncated) Normal distributions Xi ≡ N(μi,σi) (the failure rate shape is the same as that of the translated models Xi ≡ N+(μi + c,σi), where c > max(μ0 + 3σ0,μ1 + 3σ1)). In this case, we have that rp′ increases from (−∞,min(μ0,μ1)). Moreover, η0(t) ≥ η1(t) implies σ0 = σ1. Thus, if σ1 = σ0 (μ0 < μ1), then w(−∞) = 0 and Xp is IFR or IBFR. If σ1 > σ0, then w(−∞) = 1 and γ(−∞) = ∞, and, hence, Xp is IFR, IBFR, or IBBFR.
Remark 22: Corollaries 15–17 can also be used to study the shape of mixtures of linear failure rates which have the same shape as the translated models Xi ≡ N+(μi − c,σi), where c > 0 verifies ri(t + c) ≅ ηi(t + c) for t > 0 and i = 1,2. Note that this model includes the exponential distribution. Thus, if X0 and X1 are two models with linear failure rates ri(t) = ai t + bi, for t > 0, where ai,bi ≥ 0 and i = 1,2, we have the following cases. If a0 = a1 and b0 > b1, then the shape of the failure rate of the mixture is obtained from Corollary 15 by using
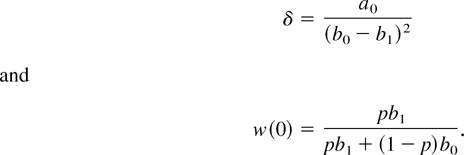
Analogously, if a0 > a1 and b0 > b1, then the shape of the failure rate of the mixture is obtained from Corollary 16 by using

Finally, if a0 > a1 and b0 < b1, then the shape of the failure rate of the mixture is obtained from Corollary 17 and t0 = (b1 − b0)/(a0 − a1).
6. EXAMPLES
In this section, we give some examples showing that all of the different shapes given in Section 5 for the failure rate can be obtained from the mixture of positive truncated Normal distributions. We pay special attention to BFR models.
Example 23: If X1 ≡ N+(3,3) and X0 ≡ N+(6,3), then rp(t) increases in (0,∞) for all p, since σ0 = σ1 = 3 and

The failure rates for p = 0, 0.2, 0.4, 0.6, 0.8, 1 are given in Figure 1.

Failure rates for the mixture of N+(3,3) and N+(6,3) with p = 0, 0.2, 0.4, 0.6, 0.8, and 1.
Example 24: If X1 ≡ N+(9,1) and X0 ≡ N+(3,1), then
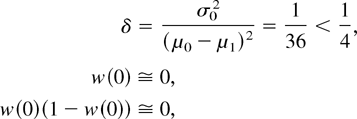
and, hence, Xp is IFR or IBFR. The mixture failure rates are given in Figure 3. Note that we have a BFR from (cp,∞). Thus, a censure in (0,cp) gives practical BFR. This is equivalent to censuring approximately 60% of early failures represented by X0. We obtain similar results if we consider more truncated normal distributions for early failures, but in this case, cp is closer to zero (see Fig. 2).

Failure rates for the mixture of N+(1,1) and N+(7,1) with p = 0, 0.2, 0.4, 0.6, 0.8, and 1.

Failure rates for the mixture of N+(3,1) and N+(9,1) with p = 0, 0.2, 0.4, 0.6, 0.8, and 1.
Example 25: To obtain a BFR mixture, we need μ0 < 0 and (19). Thus, if we consider N+(−3,3) and N+(10,3), (19) implies p > 0.34432 and, in this case, we obtain a BFR mixture. If p ≤ 0.34432, then Xp is IBFR. In Figure 4, we give r0,r1,η0,η1, and rp for p = 0.34432. Note that (19) is equivalent to comparing η0(0) = 1/3 with rp(0) ≅ (1 − p)r0(0) ≅ (1 − p)/2 (A in Figure 4). We give the mixture failure rates for p = 0.2, 0.4, 0.6, and 0.8 in Figure 5. Observe that a truncated normal N+(−3,3) is very similar to a linear failure rate.

Failure rate for the mixture of N+(−3,3) and N+(10,3) with p = 0.34432.

Failure rates for the mixture of N+(−3,3) and N+(10,3) with p = 0, 0.2, 0.4, 0.6, 0.8, and 1.
Example 26: In Figure 6, we show the failure rates obtained from a mixture of N+(5,1) and N+(−1,3) for p = 0.2, 0.4, 0.6, and 0.8. The mixture is BBFR for p = 0.8 and IBBFR for p = 0.4.

Failure rates for the mixture of N+(5,1) and N+(−1,3) with p = 0, 0.2, 0.4, 0.6, 0.8, and 1.
7. CONCLUSIONS
First, we note that to have a BFR mixture from positive truncated normal models, we need μ0 < 0. From a practical point of view, this is equivalent to assuming a censored burn-in period larger than μ0 for the units with manufacturing defect which, in practice, is quite usual (we test at the factory until, at least, the observed mean time of failure for this kind of unit). This condition holds if we suppose a linear failure rate for X0. Thus, under assumptions (i)–(iv) given in Section 2 and the conditions μ0 < 0, r1(0) ≅ 0 and (19), we obtain a BFR mixture from positive truncated normal models.
Sometimes, we have bathtub estimated failure rates from models which do not have BFR due to some practical considerations. For example, in practice, it is very difficult to estimate r(t) when R(t) is small. It is also difficult to estimate r(t) near t = 0 (especially when μ0 << μ1). Hence, models such as that of Figure 2, are, in practice, BFR.
The main conclusion is that BFR models appear naturally from mixtures of usual IFR models. We think that this is the correct way to obtain the BFR model, since it explains the reason for the shape of the failure rate from the use of two different populations. Moreover, we can use the extensive literature on this topic.
Acknowledgment
This work was supported by Ministerio de Ciencia y Technologia under grant BFM2003-02947.
References
REFERENCES
Al-Hussaini, E.K. &
Sultan, K.S.
(2001).
Reliability and hazard models based on finite mixture models.
Handbook of Statistics 20, Advances in Reliability
139–183.CrossRef
Barlow, R.E. &
Proschan, F.
(1975).
Statistical theory of reliability and life testing.
New York:
Holt, Rinehart and Winston.
Block, H.W. &
Joe, H.
(1997).
Tail behavior of the failure rate functions of mixtures.
Lifetime Data Analysis
3:
269–288.Google Scholar
Block, H.W.,
Jong, Y., &
Savits, T.H.
(1999).
Bathtub functions and burn-in.
Probability in the Engineering and Informational Sciences
13:
497–507.Google Scholar
Block, H.W.,
Savits, T.H., &
Singh, H.
(2002).
A criterion for burn-in that balances mean residual life and
residual variance.
Operations Research
50:
290–296.Google Scholar
Fagiuoli, E. &
Pellerey, F.
(1993).
New partial orderings and applications.
Naval Research Logistics
40:
829–842.Google Scholar
Finkelstein, M.S.
(2002).
On the shape of the mean residual lifetime function.
Applied Stochastic Models in Business and Industry
18:
135–146.Google Scholar
Glaser, R.E.
(1980).
Bathtub and related failure rate characterizations.
Journal of the American Statistical Association
75:
667–672.Google Scholar
Gupta, R.C. &
Warren, R.
(2001).
Determination of change points of non-monotonic failure rates.
Communications in Statistical Theory and Methods
30:
1903–1920.Google Scholar
Jiang, R. &
Murthy, D.N.P.
(1998).
Mixture of Weibull distributions—Parametric characterization
of failure rate function.
Applied Stochastic Models and Data Analysis
14:
47–65.Google Scholar
Klar, B. &
Müller, A.
(2003).
Characterizations of classes of lifetime distributions generalizing
the NBUE class.
Journal of Applied Probability
40:
20–32.Google Scholar
Kotz, S. &
Shanbhag, D.N.
(1980).
Some new approaches to probability distributions.
Advances in Applied Probability
12:
903–921.Google Scholar
Krohn, C.A.
(1969).
Hazard versus renewal rate of electronic items.
IEEE Transactions on Reliability
18(2):
64–73.Google Scholar
Lai, C.D.,
Xie, M., &
Murthy, D.N.P.
(2001).
Bathtub-shaped failure rate life distributions.
Advances in Reliability
69–104.CrossRef
Linch, J.D.
(1999).
On conditions for mixtures of increasing failure rate distributions
to have an increasing failure rate.
Probability in the Engineering and Informational Sciences
13:
33–36.Google Scholar
Mi, J.
(1995).
Bathtub failure rate and upside-down bathtub mean residual life.
IEEE Transactions on Reliability
44(3):
388–391.Google Scholar
Rajarshi, S. &
Rajarshi, M.B.
(1988).
Bathtub distributions: A review.
Communications in Statistical Theory and Methods
17:
2597–2621.Google Scholar
Rojo, J.
(1996).
Relationships between pure tail orderings of lifetime distributions
and some concepts of residual life.
Annals of the Institute of Statistical Mathematics
48:
247–255.Google Scholar
Ruiz, J.M. &
Navarro, J.
(1994).
Characterization of distributions by relationships between failure
rate and mean residual life.
IEEE Transactions on Reliability
43(4):
640–644.Google Scholar
Shaked, M. &
Shanthikumar, J.G.
(1994).
Stochastic orders and their applications.
San Diego, CA:
Academic Press.
Shaked, M. &
Spizzichino, F.
(2001).
Mixtures and monotonicity of failure rate functions.
Advances in Reliability
185–198.CrossRef
Vaupel, J.W. &
Yashin, A.I.
(1985).
Some surprising effects of selection on population dynamics.
American Statistics
39:
176–184.Google Scholar
Wondmagegnehu, E.T.
(2002).
Mixtures of distributions with increasing failure rates.
Ph.D. thesis.
University of Pittsburgh,
Pittsburgh, PA.
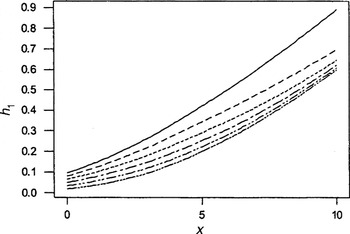
Failure rates for the mixture of N+(3,3) and N+(6,3) with p = 0, 0.2, 0.4, 0.6, 0.8, and 1.
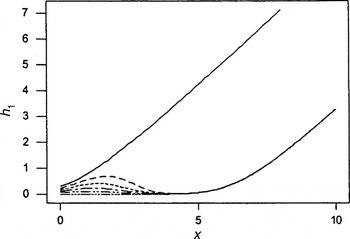
Failure rates for the mixture of N+(1,1) and N+(7,1) with p = 0, 0.2, 0.4, 0.6, 0.8, and 1.
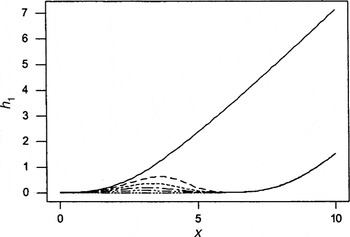
Failure rates for the mixture of N+(3,1) and N+(9,1) with p = 0, 0.2, 0.4, 0.6, 0.8, and 1.
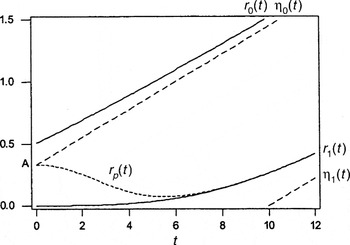
Failure rate for the mixture of N+(−3,3) and N+(10,3) with p = 0.34432.
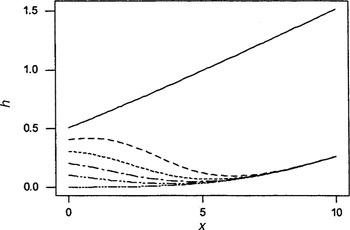
Failure rates for the mixture of N+(−3,3) and N+(10,3) with p = 0, 0.2, 0.4, 0.6, 0.8, and 1.
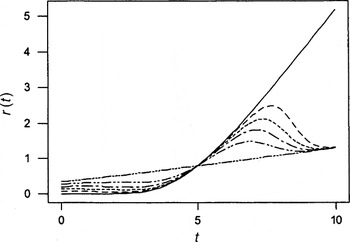
Failure rates for the mixture of N+(5,1) and N+(−1,3) with p = 0, 0.2, 0.4, 0.6, 0.8, and 1.
 You have
Access
- 68
- Cited by