I. INTRODUCTION
Recent research has been motivated to understand and exploit the large negative magnetoresistance (MR) effects which appear near and below the Curie temperature. The manganites are one of those kinds of materials that fulfil the above need. The rich electronic phase diagrams of manganites reflect the balance of interactions which determine the electronic ground state. In keeping with the literature data, the highest magnetoresistivity values are observed in the temperature regions for ferromagnetic ordering in manganite. Reference Salamon and Jaime1
The research efforts during the past have pointed out the role played by different oxidation states of manganese ions in La-based doped manganites for larger MR near room temperature at low field. Aliovalent-doped manganites are one of the preferred doping ions because the concentration of Mn4+ ions induced by this substitution is twice of that obtained in systems with the divalent substitutions. Accordingly, it covers the region of ferromagnetism and metallic conductivity for 20–40% of Mn4+. It is worth to mention that in a definite narrow range, these doped manganites exhibit unusual magnetotransport properties such as ferromagnetic to paramagnetic transition, magnetocaloric effect, and colossal magnetoresistance (CMR).
In particular, it was reported that La1–x A x MnO3 (A = Na, K) compounds crystallized in a rhombohedrally distorted perovskite structure exhibit sharp ferromagnetic transition as well as a negative MR about room temperature. Reference Rao, Sun, Barner and Hamad2,Reference Ye, Song, Dai, Wang, Wang, Du, Sun, Fang, Chen and Gao3 Hence, the study of alkali-metal (Na+, K+, Rb+) doped perovskite manganites would offer significant complementary understanding of the CMR effects in these compounds. CMR property has effective correlation with temperature and magnetic field, thus its applications are limited. In view of the above relevance of temperature and field, it will be quite useful to decreasing the magnetic field and widening the operating temperature range. Several methods have been adopted to obtain huge MR in preferred low field and high temperature. It is worth to point out that the straightforward experimental effort is to mix cation of different charges at the A-site for systematically tuning transport properties.
In view of the above, substitution of two rare earth with varying alkaline earth ion in (Pr1/3Sm1/3)2/3 A 1/3MnO3 (A = Ca, Sr, Ba) accounted 99% of MR in 8 T field. Reference Asthana, Bahadur, Nigam and Malik4 In addition, occurrence of CMR in La0.7–x L x Ca0.3MnO3 (L = Y, Dy, Yb, Gd) showed the interplay between the itinerant charge carriers and localized moments. The variation of CMR and Curie temperature with <r A > has also been examined and it is also stating that these properties can be conveniently tailored by engineering appropriate structure. Reference Fontcuberta, Martınez, Seffar, Pinol, Garcia-Munoz and Obradors5 Similarly, a series of La0.7Ca0.3–x Na x MnO3 investigated for examining MR behavior and found that MR changes regularly with increasing x, and that MR peak shifts toward higher temperatures and decreases with enhanced x. Reference Tovstolytkin, Pogorily, Podyalovskii, Kalita, Lozenko, Trotsenko, Ryabchenko, Belous, Vunov and Yanchevskii6
However, alkali-earth and alkali-metal ion has no magnetic moment, therefore, it is worth discussing whether magnetic moment of ion at site A affects Curie temperature and CMR property. When La-site of LaMnO3 is substituted by trivalent magnetic ions (Sm, Gd, and Dy) there is no appreciable change in hole concentration, instead observed an enhancement of MR. Reference Qixiang, Guiying, Guoqing, Qiang, Wenqi and Zhensheng7,Reference Wang, Ni, Sanga and Du8 Hence, one expects that the study of the effect of magnetic ion doping in manganite system will enable a better understanding of the CMR effect in these compounds to be achieved.
We thus aimed at studying the effect produced by magnetic ion doping for monovalent-doped LaMnO3 by means of structural, electric, and magnetic measurements. We carried out La0.85Na0.15MnO3 compound as the mother body. As La1–x Na x MnO3 display some interesting features and lead to different consequences than a divalent cation: first, in theory, the same number of Mn4+ ion can be created by the monovalent cation with a half concentration of dopant, because of the +1 valence state of the alkali ion. Furthermore, the cation radius of the Na ion (1.39 Å) is very close to the La ion (1.36 Å) Reference Shannon9 ; hence, the disorder induced by doping is expected to be small. Near values of La and Na ionic radii imply a small cation mismatch and consequently, structural changes and improve transport properties. Furthermore, Sm3+ is a magnetic ion that chooses to substitute La-site in varying ratio and Na in a fixed ratio. The ionic radius of Sm3+ (1.241 Å) is smaller than La3+ (1.36 Å). The effective magnetic moment of Sm3+ is 1.5 μB (μB is Bohr magnetron).
We thus make effort for a detailed structural, electric, and magnetic study following x-ray diffraction (XRD), dc electrical resistivity of La0.85–x Sm x Na0.15MnO3 (x = 0.05, 0.1, 0.15) manganites prepared by solid-state ceramic technique to seek the impact of substitution effects (monovalent cation Na+ and magnetic ion Sm3+ for trivalent La3+). The experimental details are given in the next section. Later on, we supply technical details to estimate the electron–phonon, electron–electron, and electron–magnon scattering contribution to resistivity for metallic region (T < T P), polaron conduction for semiconducting resistivity (T > T P) and motivate them by simple physical arguments before summarizing our results. We use the Bloch–Gruneisen method to estimate the independent contributions of acoustic and optical phonons. For the semiconducting region, we compute resistivity behavior with small polaron conduction (SPC). The small polaron model takes care of coherent motion of charge carriers and involves a relaxation due to a low-lying optical phonon mode.
II. EXPERIMENTAL DETAILS
A. Synthesis of samples
We synthesized a series of sodium-substituted lanthanum manganites having the general formula, La0.85–x Sm x Na0.15MnO3 (x = 0.05, 0.1, 0.15) by conventional solid-state reaction method. The advantage of solid-state reaction method for synthesizing oxide materials over other synthesis methods is manyfold. Foremost is the ready availability of starting materials, suitability for the preparation of high purity, degree of homogenization achieved on mixing, intimacy of contact between the grains and accurately stoichiometric compounds by optimizing the processing and synthesis parameters that have a large influence on the properties of final products. Mixture of stoichiometric amount of La2O3, Sm2O3, Na2CO3, and MnO2 was calcined at 900 °C in air for 24 h with two intermediate grindings and then sintered at 950 °C for 48 h after being pelletized. The pellets were finally annealed at 1000 °C in oxygen atmosphere for 12 h. Low reaction temperature and long firing times have been chosen to get a single-phase compound without losing much Na during the synthesis procedure.
B. Characterization
1. X-ray diffraction
The powder x-ray patterns were recorded using a Rigaku diffractometer with Cu Kα radiation. A scanning rate of 0.01° s−1 was adopted and the data were taken at room temperature in the 2θ range of 10°–90°. Monochromatic x-rays of λ = 1.5406 Å Kα1 line generating by 40 kV and 100 mA power settings from a Cu target were made to fall on the prepared samples. The diffraction pattern was obtained by varying the scattering angle 2θ from 10° to 90° in step size of 0.01°. XRD data were refined by means of the Rietveld method using the FullProf refinement program. Reference Rodriguez-Carvajal10
2. DC electrical resistivity
Electrical resistivity measurements were carried out by standard four-probe method in the temperature range 5–300 K in magnetic field of 0, 2, 4, and 8 T, respectively. Electrical contacts were made using indium on a rectangular rod of the sample. We have used a Stanford Research Systems lock-in amplifier (model SR 850) and commercial Lakeshore controllers (model DCR93CA).
III. RESULTS AND DISCUSSION
A. Structure analysis
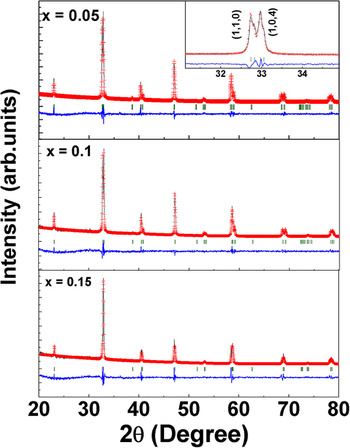
The room temperature powder XRD pattern of all the samples along with Rietveld refinement is shown in Fig. 1. The crosses show the actual data and the calculated curve is superimposed on them. The bottom line shows the difference between the experimental and the calculated XRD patterns. Bragg peaks appear as vertical lines. Very good agreement between the calculated and the observed data is obtained which confirms that the samples are prepared without any other secondary or impurity phase.
XRD diffraction patterns of the La0.85–x Sm x Na0.15MnO3 (x = 0.05, 0.1, 0.15) with Rietveld refinement. The inset shows splitting of the main peak, which indicates the rhombohedral distortion of lattice.

It is well known that by increasing the amount of the Mn4+ (which is not a Jahn–Teller (J–T) ion) the crystal structure of lanthanum manganites exhibits a progressive transition from a highly distorted orthorhombic structure, in which the Jahn–Teller effect is cooperative, toward less distorted structures like the rhombohedral ones. Our La0.85–x
Sm
x
Na0.15MnO3 manganite is rhombohedral and belongs to the
 $R\bar 3C$
space group. The differences between the diffraction patterns of the orthorhombic and rhombohedral structures are very small and usually the most clear difference is the rhombohedral splitting of the (110) and (104) diffraction peaks around 32°. This splitting is of the order of 0.4°. The inset shows the result of Rietveld refinement between 30° and 35° in 2θ. This splitting of the peak indicates the rhombohedral distortion of lattice.
The starting structural model used was that of La0.85Na0.15MnO3. Reference Varshney, Dodiya and Shaikh11 The fits were performed using a pseudo-Voigt peak-shape function for profile fitting. This Voigt parameter allows the peak profile to vary through a convolution of Gaussian (instrumental contribution) and Lorentzian (mainly particle-size contribution) profiles. Use of this function has been found to improve the curve fitting significantly by allowing instrumental contributions and particle-size contributions to vary independently of each other.
The scale factor, zero-point, cell dimensions, Gaussian peak-profile variables (u, v, w), the Voigt parameter, asymmetry factor, and preferred orientation factor were refined before the final refinement. In the final runs, profile parameters like scale factors, background coefficients, zero point, half-width, pseudo-Voigt and asymmetry parameters for the peak shape, atomic positions and thermal parameters were refined. The final refinement varied the 18 variables. Refinement of all 18 variables together produced a significant change in fitting. The structural parameters are listed in Table I along with the values of the goodness-of-fit factor s, the residual factor R p, and the weighted residual factor R wp. These values are in close agreement with the available experimental results for Sm-doped manganites published results. Reference Qixiang, Guiying, Guoqing, Qiang, Wenqi and Zhensheng7
Structure data from x-ray powder diffraction studies of La0.85–x
Sm
x
Na0.15MnO3 (x = 0.05, 0.1, 0.15). The atoms are located at the following Wyckoff positions for
 $R\bar 3C$
space group (hexagonal setting), La, Sm, Na, 6(a): (0, 0, 1/4); Mn 6(b): (0, 0, 0); O 18(e): (X, 0, 1/4). The bond lengths correspond to each unit cell. R
p, R
wp, and S are the residual factor, the weighted residual factor, and the goodness-of-fit factor, respectively.

It can be seen that the lattice parameters decrease from a = 5.4777 to 5.4659 Å and c = 13.2856 to 13.2312 Å with increasing Sm concentration. A similar feature is observed for the unit cell volume as shown in Table I, indicating that the lattice shrinks and the unit cell becomes smaller with increasing Sm concentration. This can be explained under two circumstances: First, the reduction in unit cell volume was caused by the substitution of smaller Sm3+ (1.241 Å) in place of larger La3+ (1.36 Å) and this can also be correlated with the presence of Mn4+ ions (induced by Na doping), which is smaller (ionic radius, 0.53 Å) than the Mn3+ ion (ionic radius, 0.645 Å). Reference Shannon9 The presence of smaller cations in the B sublattice of the ABO3 perovskite is responsible for the reduction in unit cell volume. It is well known that one of the possible origins of the lattice distortion of perovskite-based structures is the deformation of the Mn+3O6 octahedra originating from the JT effect that is inherent to the high-spin (S = 2) Mn+3 ions with double degeneracy of the e g orbital. Obviously, this kind of distortion is directly related to the concentration of Mn+3 ions.
The structure of La0.85–x Sm x Na0.15MnO3 is derived from the distortion of cubic perovskite structure by rotation of MnO6 octahedra that liberate internal stress due to size mismatch of the ions which results in the tolerance factor t is larger than 0.96 as illustrated in Table I. In addition, experimental analyses have shown that the Mn–O–Mn bond angle increases and Mn–O bond length shows a decreasing trend with x.
Another possible origin of the lattice distortion is the average ionic radius of the A-site element, which is governed by the tolerance factor t = (r A + r O)/√2 (r Mn + r O) (where r A , r Mn, and r O, are the ionic radii for A-site, Mn-site, and oxygen ion, respectively). As t is close to 1, the cubic perovskite structure is realized. Furthermore, if r A decreases, t also does, the lattice structure transforms to the rhombohedral (0.96 < t <1) and then to the orthorhombic structure (t < 0.96), in which the bending of Mn–O–Mn bond and the deviation of the bond angle from 180° increase. Reference Mahendiran, Tiwary, Raychaudhuri and Ramakrishnan12 A-site cation radius <r A > and, correlatively, tolerance factor decrease with increase in samarium doping. All the structural parameters are listed in Table I.
Based on the structural results of La0.85–x Sm x Na0.15MnO3 systems, it is inferred that the structure symmetry of doped perovskite manganese oxides is affected by the size of doped ions. In this way, for deeper insight of the dynamical processes involves interpreting various physical properties of manganites substitution of an aliovalent A-site cation with a magnetic ion is a better approach. It provides a realization of mixed valence with minimum perturbation of periodic potential in the system. This perturbation can be measured by the size variance. The A-site disorder increases with Sm-concentration that leads to microscopic inhomogeneities in the materials.
B. Electrical resistivity
Figure 2 shows the temperature dependence of the resistivity at zero magnetic field for La0.85–x Sm x Na0.15MnO3 with 0.05 ≤ x ≤ 0.15 from 5–300 K. All the samples exhibit metallic behavior (∂ρ/∂T < 0) at low temperatures (T < T P) and semiconductor-like features above T P. The value of T P decreases as the Sm content increases from x = 0.05 to 0.15. For samples with composition x =0.05 and 0.1, the values of T P obtained are ∼221 and ∼218 K, respectively. The presence of two distinct transition temperatures for x = 0.15, with the first sharp one located at ∼253 K is defined as T P1 and the second wider one T P2 ∼ 203 K. Similar double metal–insulator peaks are also reported for Na-doped LaMnO3 samples. Reference Roy, Guo, Venkatesh and Ali13
Temperature dependence of resistivity for La0.85–x Sm x Na0.15MnO3 (x = 0.05, 0.1, 0.15) between 5 and 300 K.

Presence of this hump in resistivity is believed to be related to the phase separation induced by inhomogeneity in the background potential experienced by the e g electrons as they move through the crystal. The maximum resistivity ρm of the compounds increases rapidly and shifts to higher temperature with the samarium content. The origin of this increase in resistivity should be attributed to the systematic decrease of charge carriers with Sm substitution. This effect can also be correlated to the reduction of average radius of A-site <r A > that lead to Mn–O–Mn angle deviates from 180°, which will hinder the e g electrons transferring between the neighboring Mn3+ and Mn4+ ions, weaken double exchange function. This factor reduced the probability of e g electrons localization. Hence, T P decreases and the resistivity increases with the Sm doping. The competition between localization and delocalization of e g electrons is a key factor in determining the magnetic and transport properties of doped manganites. It is suggested that extra magnetism due to substitution of magnetic ions affected the increase in resistivity, which is consistent with the earlier report. Reference Qixiang, Guiying, Guoqing, Qiang, Wenqi and Zhensheng7
The application of a magnetic field results in several changes including a large reduction in resistivity values over the studied temperature range and a resistivity maximum shift to a higher temperature leading to an MR effect. As shown in Fig. 3, the ρ–T curves of all the samples resistivity reduce significantly by the application of magnetic field. The insulator–metal transition temperature T P shifts to higher temperature, and thus leading to the CMR effect. This important observation by applying magnetic field deals with two facts in CMR materials: first, the spins favorably orient themselves and consequently the charge carriers experience less scattering and can also restrain thermal fluctuation that causes paramagnetic insulating (PMI) to ferromagnetic metallic (FMM) transition to occur at high temperature, hence T P shifts to higher temperature; second, it also makes FMM state to be more ordered with weaken scattering function and showing a decrease in resistivity.
Temperature dependence of resistivity for La0.85–x Sm x Na0.15MnO3 (x = 0.05, 0.1, 0.15) in different magnetic fields. (a) x = 0.05, (b) x = 0.1, (c) x = 0.15.

It is clear from Fig. 2 that resistivity behavior of sample with x = 0.15 is different from other samples as the double metal–insulator transition peaks T P1 and T P2 occurred in this sample. It is interesting to note that both transition temperatures shift toward higher temperature in the presence of magnetic field. Additionally, it shows that T P2 moves toward to T P1 and T P1 steadily disappear with the increase of field. Further, the peak value of T P2 is found to change from ∼203 to ∼236 K when the field changes from 0 to 8 T. At field H = 8 T, T P2 shifts to high temperature for about 30 K. These two peaks may be attributed to the difference in the magnetic ordering between the surface and core of sample, i.e., there exist regions with different transport features. Reference Kalyana Lakshmia, Venkataiaha, Vithalb and Venugopal Reddy14 Thus, the observed two-peak behavior in these samples favors electronic and magnetic inhomogeneity and clearly indicates phase or domain separation.
Moreover, T P1 peak associating with the PMI to FMM transition is obviously affected by the applied fields. The role played by the magnetic field in this phenomenon is interpreted by interplay between the FMM, FMI, and AFI phases. For La0.7Sm0.15Na0.15 MnO3 sample, FMM phase probably trapped in the AFM matrix and the application of magnetic fields suggesting the increase of the FMM phase accordingly results in disappearance of peak. On the other hand, the T P2 peak barely has response to the applied magnetic field, which indicates that the origin of this peak is different from that of T P1 peak.
C. Magnetoresistance
The percentage of MR is defined as
 $$\% {\rm{MR}} = \left\{ {{{{\rm{\rho }}_H - {\rm{\rho }}_0 } \over {{\rm{\rho }}_0 }}} \right\} \times 100\quad.$$
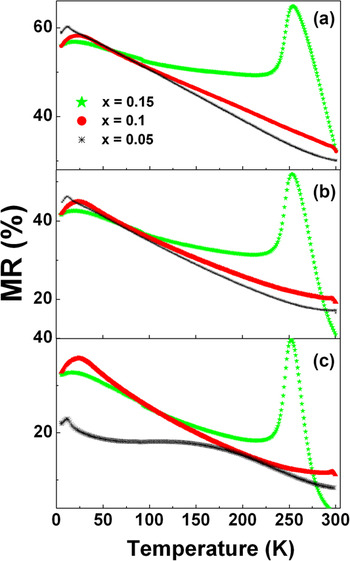
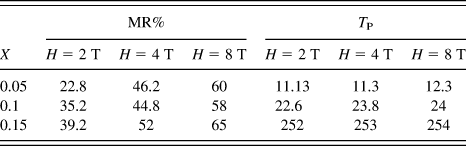
Here, ρ(0) is the resistivity without magnetic field and ρ(H) is the resistivity in a field. The variation of MR with temperature for x = 0.05, 0.1, 0.15 samples at different fields is shown in Fig. 4. Maximum MR of approximately 65%, 52%, and 40% is obtained for applied fields of 8, 4, and 2 T, respectively, at ∼253 K for La0.7Sm0.15Na0.15MnO3. Our results show that Sm substitution by La in La0.85–x Na0.15MnO3 for x = 0.15 induced an increase in the MR ratio, which is higher than A-site doped La1–x Na x MnO3 system reported before. A maximum MR of about 37% (at 1 T) and 45% (at 5 T) is observed at about 125 K for bulk sample of La1–x Na x MnO3 (x = 0.03, 0.1). Reference Mahendiran, Tiwary, Raychaudhuri and Ramakrishnan12,Reference Vergara, Ortega-Hertogs, Madurga, Sapina, El-Fadli, Martinez, Beltran and Rao15
The temperature dependence of MR% for La0.85–x Sm x Na0.15MnO3 (x = 0.05, 0.1, 0.15) samples at applied fields of (a) 8 T, (b) 4 T, and (c) 2 T are shown.

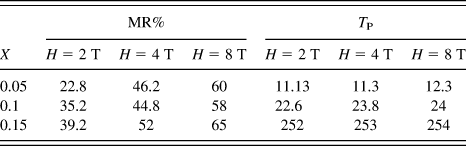
Surprisingly, a large stable MR of ∼49–51% has been observed only at 8 T over a wide temperature range (100–235 K) and the reason for this behavior might be attributed to the melting of charge ordering phenomenon. Although significant MR has been observed for x = 0.05 and 0.1 at 2, 4, and 8 T fields (MR listed in Table II), in the case of x = 0.05 and x = 0.1 the maximum MR values are found to be below 25 K, while in the case of x = 0.15 sample it is found to be in the neighboring of T P (∼253 K). It is clear from the figures that the samples of the present investigation are found to exhibit large MR in the low temperature regime and decreases with increasing temperature. In contrast for x = 0.15, MR again increases in the vicinity of T P.
MR% of La0.85–x Sm x Na0.15MnO3 (x = 0.05, 0.1, 0.15) samples by using SPC model.
The phenomena of MR have two distinct contributions. Reference Mazaheri and Akhavan16 The first one, which occurs due to the suppression of spin fluctuations, is termed as intrinsic MR. This MR has stimulated on the application of magnetic field by the spins alignment. This MR has the highest value near T P and decreases with decreasing temperature and is usually observed among single-crystal bulk materials and in thin films. In the polycrystalline samples, there is an additional MR, which is extrinsic in nature, arising due to intergrain spin polarized tunneling (ISPT), across the grain boundaries present in the sample. This MR contribution increases as the temperature decreases and is usually found in polycrystalline bulk materials.
In the present analysis, extrinsic MR is found to dominate for the samples with composition x = 0.05 and 0.1. It is also clear from Fig. 4 that both the samples are found to exhibit extrinsic MR in the magnetic fields of 2, 4, and 8 T, in the temperature range 4.2–300 K. It is possible that existence of intergrain phases and grain boundary that might have exhibited maximum MR in the vicinity of T P. Sample with x = 0.15 shows signs of both intrinsic as well as extrinsic MR. Thus far, it was alleged that intrinsic MR owing to spin fluctuations found at high fields and ISPT across grains, i.e., the extrinsic MR at low fields. It is also apparent from Fig. 4 that La0.7Sm0.15Na0.15MnO3 shows a large MR well below T P along with maximum MR at T P. In anticipation of recent research, it has shown that high-field response is also due to the existence of the grain boundaries and the nature of grain boundary is a key ingredient in the mechanism of electrical transport, as it constitutes the barrier through which carriers cross. Reference Venkataiah, Kalyana Lakshmi and Venugopal Reddy17 Other authors have obtained similar results in the LCMO:Ag composites as in our studies. From the study of the magnetotransport properties of these composites system, it is concluded that the better grain connectivity improving significantly electrical transport sharpens metal–insulator transition and achieved LFMR. Reference Awana, Tripathi, Kumar, Kishan, Bhalla, Zeng, Sharth Chandra, Ganesan and Habermeier18,Reference Awana, Tripathi, Balamurugan, Kishan and Takayama-Muromachi19
This might be due to the simultaneous presence of both intrinsic as well as extrinsic MR. However, La0.7Sm0.15Na0.15MnO3 has more structural variation and lattice disorder than other sample which is probably caused by the orthorhombic distortion found in this higher Sm-doped rhombohedral manganites. Our suggestion is consistent with our result of Rietveld refinement where goodness-of-fit value supports more structural variation than other samples. Bearing in mind this; one may conclude that the samples of the present investigation might exhibit to a large extent an extrinsic nature of MR arising due to ISPT.
With a view to understand the conduction mechanism of La1–x Sm x Na0.15MnO3 with x = 0.05, 0.1, and 0.15 manganites at zero field and in magnetic field (2, 4, and 8 T), in metallic region (T < T P), we use the Bloch–Gruneisen (BG) method to estimate the independent contributions of acoustic and optical phonons. We start with the general expression for the temperature dependent part of the resistivity, following the Debye model,
 $${\rm{\rho }}\left( T \right) \approx \left( {{3 \over {\hbar e^2 v_{\rm{F}}^2 }}} \right){{k_{\rm{B}} T} \over {Mv_{\rm{s}}^2 }}\int_0^{2k_{\rm{F}} } {\left| {F\left( q \right)} \right|^2 \left[ {{{xq^3 {\mathop{\rm d}\nolimits} q} \over {\left[ {e^x - 1} \right]\left[ {1 - e^{ - x} } \right]}}} \right]} \quad{\rm{,}}$$
with x = ħω/k B T. In the above, F(q) is the Fourier transform of the potential associated with one lattice site, v F being the Fermi velocity, and v s being the sound velocity. Equation (2) in terms of acoustic phonon contribution yields the Bloch–Gruneisen function of temperature dependence resistivity:
 $${\rm{\rho }}_{{\rm{ac}}} \left( {T,{\rm{\theta }}_{\rm{D}} } \right) = 4A_{ac} T\left( {{T \mathord{\left/ {\vphantom {T {{\rm{\theta }}_{\rm{D}} }}} \right. \kern-\nulldelimiterspace} {{\rm{\theta }}_{\rm{D}} }}} \right)^4 \int\limits_0^{{{{\rm{\theta }}_{\rm{D}} } \mathord{\left/ {\vphantom {{{\rm{\theta }}_{\rm{D}} } T}} \right. \kern-\nulldelimiterspace} T}} {x^5 \left( {e^x - 1} \right)^{ - 1} \left( {1 - e^{ - x} } \right)^{ - 1} {\mathop{\rm d}\nolimits} x} {\rm{\quad,}}$$
where A ac is a constant of proportionality defined as
 $$A_{{\rm{ac}}} \cong {{3{\rm{\pi }}^2 e^2 k_{\rm{B}} } \over {k_{\rm{F}}^2 v_{\rm{s}}^2 L\hbar v_{\rm{F}}^2 M}}\quad{\rm{.}}$$
On the other hand, in case of the Einstein type of phonon spectrum (an optical mode), ρop(T) may be described as follows:
 $${\rm{\rho }}_{{\rm{op}}} \left( {T,{\rm{\theta }}_{\rm{E}} } \right) = A_{{\rm{op}}} {\rm{\theta }}_{\rm{E}}^2 T^{ - 1} \left[ {e^{{{{\rm{\theta }}_{\rm{E}} } \mathord{\left/ {\vphantom {{{\rm{\theta }}_{\rm{E}} } T}} \right. \kern-\nulldelimiterspace} T}} - 1} \right]^{ - 1} \left[ {1 - e^{{{ - {\rm{\theta }}_{\rm{E}} } \mathord{\left/ {\vphantom {{ - {\rm{\theta }}_{\rm{E}} } T}} \right. \kern-\nulldelimiterspace} T}} } \right]^{ - 1} \quad{\rm{.}}$$
A op is defined analogously to Eq. (4). Thus, the phonon resistivity can be conveniently modeled by combining both terms arising from acoustic and optical phonons
 $${\rm{\rho }}_{{\rm{e - ph}}} \left( T \right) = \rho _{{\rm{ac}}} \left( {T,{\rm{\theta }}_{\rm{D}} } \right) + {\rm{\rho }}_{{\rm{op}}} \left( {T,{\rm{\theta }}_{\rm{E}} } \right){\rm{\quad.}}$$
If the Matthiessen rule is obeyed, the resistivity may be represented as a sum ρ(T) = ρ0 + ρe-ph(T), where ρ0 is the residual resistivity that does not depend on temperature as electrons also scatter off impurities, defects, and disordered regions. Finally, the total resistivity is now rewritten as
 $$\eqalign{ & {\rm{\rho }}\left( {T,{\rm{\theta }}_{\rm{D}} ,{\rm{\theta }}_{\rm{E}} } \right) = {\rm{\rho }}_0 + {\rm{\rho }}_{{\rm{ac}}} \left( {T,{\rm{\theta }}_{\rm{D}} } \right) + {\rm{\rho }}_{{\rm{op}}} \left( {T,{\rm{\theta }}_{\rm{E}} } \right) \cr & \quad\quad\quad\quad \quad\! = {\rm{\rho }}_0 + 4A_{{\rm{ac}}} \left( {{T \mathord{\left/ {\vphantom {T {{\rm{\theta }}_{\rm{D}} }}} \right. \kern-\nulldelimiterspace} {{\rm{\theta }}_{\rm{D}} }}} \right)^4 T \times \int\limits_0^{{{{\rm{\theta }}_D } \mathord{\left/ {\vphantom {{{\rm{\theta }}_D } T}} \right. \kern-\nulldelimiterspace} T}} {x^5 \left( {e^x - 1} \right)^{ - 1} \left( {1 - e^{ - x} } \right)^{ - 1} {\mathop{\rm d}\nolimits} x} \cr & \quad \quad \quad \quad \quad \quad \quad \,+ A_{{\rm{op}}} {\rm{\theta }}_{\rm{E}}^2 T^{ - 1} \left[ {\exp \left( {{{{\rm{\theta }}_{\rm{E}} } \mathord{\left/ {\vphantom {{{\rm{\theta }}_{\rm{E}} } T}} \right. \kern-\nulldelimiterspace} T}} \right) - 1} \right]^{ - 1} \left[ {1 - \exp \left( {{{ - {\rm{\theta }}_{\rm{E}} } \mathord{\left/ {\vphantom {{ - {\rm{\theta }}_{\rm{E}} } T}} \right. \kern-\nulldelimiterspace} T}} \right)} \right]^{ - 1} \quad. \cr}$$
For the temperature-dependent resistivity analysis, one needs the value of Debye (Einstein) temperature and has been estimated using an effective interionic interaction potential (EIoIP) with the long-range Coulomb, van der Waals (vdW) interaction, and the short-range repulsive interaction up to second-neighbor ions within the Hafemeister and Flygare approach. Details of this calculation, including the assumptions made for estimation of Debye (Einstein) temperature of the system, are given in the Appendix.
Initially, we have calculated the values of the model parameters (range b and hardness ρ) for a pair such as Mn–O and La/Sm/Na–O and have the total of the La0.85–x Sm x Na0.15MnO3 (Table III). Using these model parameters, we have evaluated the values of the second-order elastic constants (SOECs) which are illustrated in Table III. Finally, we evaluate the values of acoustic and optical phonon frequency (ωD, ωLO, and ωTO) corresponding to Debye and Einstein temperature. The computed values of ωD, ωLO, and ωTO are presented in Table IV. We must mention that these computed values of ωLO and ωTO for La0.85–x Sm x Na0.15MnO3 with x = 0.05, 0.1, and 0.15, respectively, are consistent with the Raman spectroscopy results. Reference Dodiya and Varshney20 Optical phonon modes shift toward a lower wave number with increasing Sm content. The La/Sm/Na–O and Mn–O bonds govern these modes. The mode frequency governed by local factors, such as the force constant and ionic mass of the substitutive elements as well, will be proportional to (k/M)1/2, where k is the force constant and M is the reduced mass. Reference Wu, Deng, Mak, Wong, Li, Zhang and Min21 This can be attributed to the higher atomic weight of Sm3+ compared with La3+, since the frequencies of the Raman modes are dependent on force constant and ionic mass. The average mass of the A-site and ionic radii affect the normal modes related to the La/Sm/Na–O and Mn–O bonds; phonon modes shift gradually to lower mode frequencies with doping concentration.
The model parameters (b, ρ) and the SOECs for La0.85–x Sm x Na0.15MnO3 (x = 0.05, 0.1, 0.15) samples.

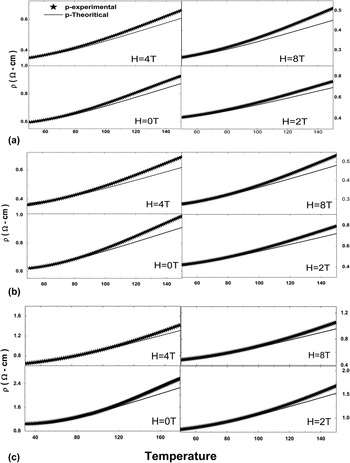
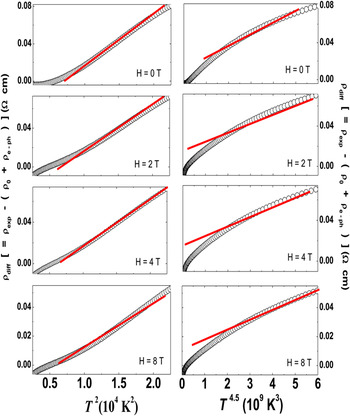
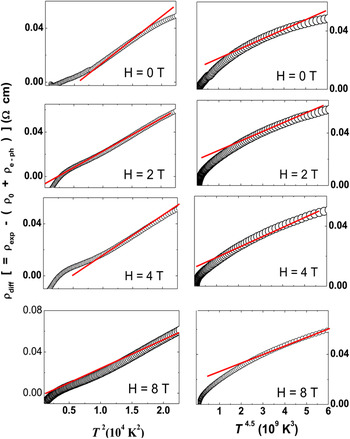
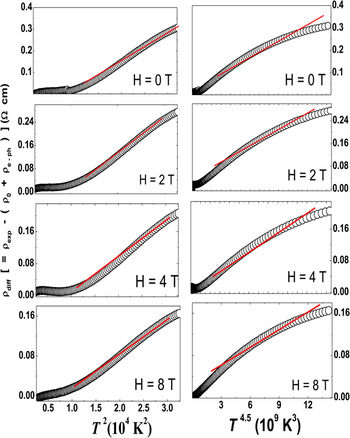
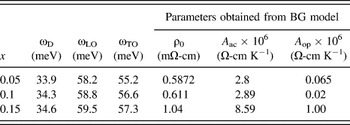
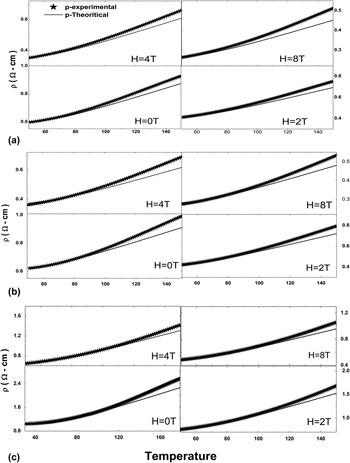
Figure 5 illustrates the results of temperature dependence of resistivity in the metallic region via the electron–phonon interaction from Eq. (7). The residual resistivity ρ0 and the coefficients A ac, A op as functions of doping concentration are shown in Table IV. It is noticed from the plot that the estimated ρ is lower than the reported data from T ≅ 110 K to near the metal–insulator transition temperature (T P). The difference between the measured ρ and calculated ρdiff [= ρexp − {ρ0 + ρe-ph(= ρac + ρop)}] is plotted in Figs. 6–8 for x = 0.05, 0.1, and 0.15, respectively. A quadratic temperature dependence of ρdiff is depicted at low temperature. The quadratic temperature contribution for resistivity is an indication of conventional inelastic electron–electron scattering.
Temperature dependence of the resistivity for La0.85–x Sm x Na0.15MnO3 samples in the metallic region.
The solid lines are the best fits to Eq. (6) along with variation of ρdiff [= ρexp − {ρ0 + ρe-ph(= ρac + ρop)}] with T 2 and T 4.5 for x = 0.05.

The solid lines are the best fits to Eq. (6) along with variation of ρdiff [= ρexp − {ρ0 + ρe-ph(= ρac + ρop)}] with T 2 and T 4.5 for x = 0.1.

The solid lines are the best fits to Eq. (6) along with variation of ρdiff [= ρexp − {ρ0 + ρe-ph(= ρac + ρop)}] with T 2 and T 4.5 for x = 0.15.

Parameters obtained corresponding to the best fit to the experimental data of La0.85–x Sm x Na0.15MnO3 (x = 0.05, 0.1, 0.15) samples by using BG model.

The quadratic temperature dependence of ρdiff is consistent with the earlier argument made by Urushibara and coworkers. Reference Urushibara, Moritomo, Arima, Asamitsu, Kido and Tokura22 The additional term due to electron–electron contribution was required in understanding the resistivity behavior, as extensive attempts to fit the data with residual resistivity and phonon resistivity were unsuccessful. The existence of quadratic temperature dependence of resistivity over a wide temperature interval permits one to believe that the electron–electron scattering is also significant in determining the resistivity in manganites.
We again refer to Figs. 6–8, where a substantial deviation from the T 2-like behavior and a rapid rise in ρdiff is observed in the intermediate temperature region (125 < T < T P). We perform a similar set of exercises with the difference between the measured ρ and calculated ρdiff [= ρexp − {ρ0 + ρe-ph(= ρac + ρop)}] beyond 125 K (plotted in Figs. 6–8). A T 4.5 temperature dependence of ρdiff is depicted at higher temperature. The T 4.5 temperature contribution for resistivity is an indication of electron–magnon scattering. In the intermediate temperature region (125 < T < T P), the manganites appear to be normal metallic ferromagnet with the resistivity dominated by spin wave scattering. It is worth referring to an earlier work of Fulde and Jensen, Reference Fulde and Jensen23 who have argued that carrier density also changes by interaction with spin wave in manganites. The feature of T 4.5 temperature dependence of ρdiff is consistent with the quantum theory of two-magnon scattering Reference Kubo and Ohata24 and is valid for half-metallic ferromagnets.
Consequently, besides electron–phonon and electron–electron interaction, another explanation for the variation in carrier density is the presence of spin wave in the metallic system, and is caused by spin wave scattering. We finish by stating that the proposed model calculations reproduce the reported electrical behavior with a combination of T 2and T 4.5 apart from electron–phonon contribution, consistent with earlier predictions. Reference Schiffer, Ramirez, Bao and Cheong25
We now address the metallic behavior of doped manganites. If the high-frequency phonon modes are indeed strongly coupling with charge carriers, the effective mass of the carriers should be substantially enhanced. The Fermi energy and the corresponding density of states are conveniently obtained from the thermoelectric power results Reference Kalyana Lakshmi, Venkataiah and Venugopal Reddy26 using εF = −π2 k B 2 T/[3|e| S c diff(T)] and N(εF) = 3n 3D V/2εF (where n 3D is the three-dimensional charge carrier density which is obtained following n 3D d 3 = 1 and V is the unit cell volume).
The density of states at Fermi level is found to decrease with Sm-doping. The observed behavior can be explained on the basis of Mn valence present in these samples. The Sm-doping in La0.85Na0.15MnO3 showed extra magnetic coupling between Mn3+/Mn4+ sublattices that weaken double exchange between Mn ions. As a consequence, decreasing N(εF) suggested that a significant decrease in the number of charge carriers and accompanied by the increase in resistivity of the Sm doping, which is further supported by resistivity data. The density of states in turn yields the electronic specific heat coefficient using γ = (πk B)2 N(εF)/3 (see Table V). It is noticed that the above values are consistent with the γ values in other hole-doped divalent manganites Reference Ghivelder, Castillo, McN Alford, Tomka, Riedi, MacManus-Driscoll, Akther Hossain and Cohen27 and could not be compared due to the lack of experimental data on hole-doped monovalent manganites. The effective mass of the carrier along the conducting Mn–O plane is deduced from the electronic specific heat coefficient γ, using m* = 3ħ 2πγd/k B 2.
The estimated electron parameters for La0.85–x Sm x Na0.15MnO3 (x = 0.05, 0.1, 0.15) manganites.

The estimated electron parameters for La0.85–x Sm x Na0.15MnO3 with x = 0.05, 0.1, 0.15 are the Fermi wave vector k F, the Fermi velocity v F, and the plasma frequency ωp are given in Table V. We stress that the effects induced by electron correlations and mass renormalizations by electron–electron interactions are crucial in magnetic systems such as doped manganites. Reference Varshney and Dodiya28
It is known that in conventional metals, electron–phonon scattering is mathematically identical to conventional impurity scattering, and leads to a resistivity proportional to (v F 2ℓ)−1 where ℓ is the mean free path. The mean free path in this approximation is usually related to the Fermi velocity and is estimated following ℓ = v Fτ. We follow the Drude relation, τ−1 = ρ0ωp 2/4π, to obtain the scattering rate R s = τ−1. The estimated values of R s and ℓ are given in Table V. We must mention that the residual resistance obtained for nominally the same compositions may vary significantly for different groups of compounds. It remains unclear whether ρ0 only characterizes the sample's quality or if there is an intrinsic component in the residual resistivity. Reference Quijada, Cerne, Simpson, Drew, Ahn, Millis, Shreekala, Ramesh, Rajeswari and Venkatesan29 For the Sr-doped manganites, the resistivity data in the crystalline films yield ρ0 as low as 10−5 Ω cm and is in the range of typical metallic conductors. Reference Urushibara, Moritomo, Arima, Asamitsu, Kido and Tokura22 The deduced values of Fermi energy (εF) for La0.85–x Sm x Na0.15MnO3 with x = 0.05, 0.1, 0.15 correspond to narrow energy band. We notice that the Sm-doped LaNaMnO3 manganites are good metals as the product εFτ ∼ 1.
The electron correlations in view of the mass enhancement effect in narrow band materials are important in doped manganites. The phenomenon that mass enhanced with substituting ion can be interpreted as follows: substitution of Sm3+ ion stimulates manganese content and these Mn3+ions induced an increase in bending of Mn–O–Mn bond angle, in this manner narrowing bandwidth and enhancing the effective mass. Reference Malavasi, Ritter, Mozzati, Tealdi, Saiful Islam, Bruno Azzoni and Flor30 We notice that enhanced electron mass m*/m e > 1 in La0.85–x Sm x Na0.15MnO3 (see Table V) leads to reduced plasma frequency, and hence the reduced zero temperature elastic scattering rate in comparison with conventional metals. It is perhaps worth noticing that, in hole-doped manganites, the scattering rate at low temperatures is of the order of 1015 s−1. Reference Kubo and Ohata24 Furthermore, the Mott–Ioffe–Regel criterion for metallic conductivity is valid, as the deduced mean free path is greater than the Mn–O bond length. The use of the Bloch–Gruneisen expression in estimating the electron–phonon contributions is thus validated as the product k Fℓ ∼ 1.
The Sm-doped manganites thus illustrate a metallic behavior below metal–insulator transition temperature T P. The T P and resistivity increase with the Sm-doping concentration are related to the reduction of mean free path thus reducing the conductivity of samples. We must refer to the work of Egilmez and researchers who incorporate the effects of the grain-boundary-induced lattice disorder on the resistivity in Sm0.55Sr0.45MnO3 at temperatures near the metal–insulator transition. Reference Egilmez, Chow, Jung, Fan, Mansour and Salman31 The low temperature resistivity data (T ≤ 75 K) of the SmSrMnO was successfully fitted using the relation ρ = ρ0 + ρ2 T 2 + ρ5 T 5 with ρ0 as the residual resistivity and ρ2 and ρ5 are the electron–electron and the electron–phonon scattering coefficients, respectively. It is further noticed that in this temperature range, the disorder does not affect the temperature dependence of ρ; however, it causes an increase in the coefficients ρ0, ρ2, and ρ5 by two orders of magnitude.
In contrast to electron–phonon scattering as the source of resistivity in FMM state, the angle-resolved photoemission spectroscopy data for the bilayer manganite La1.2Sr1.8Mn2O7 identify a coherent polaronic metallic ground state below metal–insulator transition. Reference Mannella, Yang, Tanaka, Zhou, Zheng, Mitchell, Zaanen, Devereaux, Nagaosa, Hussain and Shen32 The FMM state is a polaronic metal with a strong anisotropic character of the electronic excitations, strikingly similar to the pseudogap phases in heavily underdoped cuprate high temperature superconductors as Bi 2212. A strong mass enhancement and a small renormalization factor are found to account for the metallic properties. Reference Mannella, Yang, Zhou, Zheng, Mitchell, Zaanen, Devereaux, Nagaosa, Hussain and Shen33 The temperature dependence of resistivity in the metallic state is intimately related to polaronic metallic ground state and the insulator-to-metallic state can be attributed to polaron coherence condensation process acting in concert with the double exchange mechanism. We may comment that the present theory finds an enhanced mass of holes as carriers (m*/m e > 1 for La0.85–x Sm x Na0.15MnO3 with x = 0.1, 0.125, 0.15) from the electronic specific heat coefficient to validate the Mott–Ioffe–Regel criterion. However, a detailed analysis is further required to understand the polaronic metallic state in the ferromagnetic phase and the condensation process analogous to underdoped cuprate high temperature superconductors. We shall address this issue in near future.
We have further analyzed the resistivity data of high temperature region, T > T P, using adiabatic SPC model. Above the metal–insulator transition temperature (T P), the Jahn–Teller-type distortion present in the unit cell traps the charge carriers and gives rise to polarons. We must mention that the most rapid motion of a small polaron occurs when the carrier hops each time the configuration of vibrating atoms in an adjacent site coincides with that in the occupied site. Henceforth, the charge carrier motion within the adiabatic regime is faster than the lattice vibrations and the resistivity for SPC follows ρ = ρos Texp(E P/k B T) with the polaron formation energy E p and Boltzmann constant k B. Reference Alexandrov and Mott34,Reference Snyder, Hiskes, DiCarolis, Beasley and Geballe35 In the above expression, ρos = k B/n(1 − x)e 2 D, where n is the charge carrier density, x is the doping fraction, e is the electronic charge, and D is the polaron diffusion constant (D = a 2 ν/6 for a typical cubic coordination, where a is being the lattice constant and ν, the characteristic frequency of the longitudinal optical phonon that carries the polaron through the lattice).
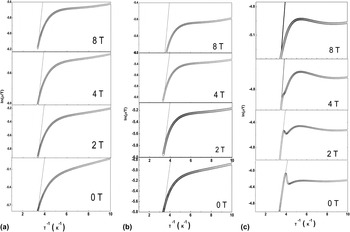
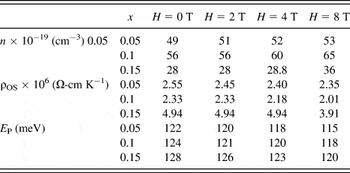
The fitted curves are shown by thick solid lines in Fig. 9 and the fitting parameters are given in Table VI. As expected, the charge carrier density (n) decreases with increasing Sm concentration in La1–x Sm x Na0.15MnO3, which confirms that the observed increase in resistivity is due to the orderly decrease of charge carriers with samarium substitution. Moreover, with the application of magnetic field, all sample documents increase in charge carrier density (n), which further results in reduced resistivity. The activation energies E p are estimated and are found to increase with increasing Sm-doping concentration and decrease with the application of magnetic field. Actually, due to doping, there is an increase in Mn–O–Mn bond angle which substantially decreases the density of states at Fermi level, and reducing the effective mass of charge carrier due to this effective band gap increase. Therefore, activation energy values increase with x. In contrast, due to magnetic field in e g band, the delocalization of charge carriers occurs and hence the energy required to liberate a free carrier is reduced. Application of magnetic field enhances this delocalization thereby reducing the activation energy further.
Variation of ln(ρ/T) with 1000/T for La0.85–x Sm x Na0.15MnO3 (x = 0.05, 0.1, 0.15) samples in high temperature region, T > T P. The solid line shows fitting to the equation ρ = ρos Texp(E P/k B T).

Parameters obtained corresponding to the best fit to the experimental data of La0.85–x Sm x Na0.15MnO3 (x = 0.05, 0.1, 0.15) samples by using SPC model.

IV. CONCLUSIONS
In summary, the structural properties, electrical resistivity, and magnetotransport properties of the polycrystalline samples La0.85–x
Sm
x
Na0.15MnO3 with x = 0.1, 0.125, 0.15 were studied and supported by theoretical models in different temperature domains. The result indicates that the structure of these compounds is all rhombohedral with space group
 $R\bar 3C$
. The unit cell volume decreases with increase in samarium content due to the substitution of smaller Sm3+ in place of larger La3+ and presence of Mn4+ ions in B sublattice. Also with the doping, tolerance factor t decreases and probably caused by the large orthorhombic distortion found in doped rhombohedral manganites with higher samarium content. Thus, the structure is affected by the ionic sizes or A-site disorder.
This reduces the hopping interaction and so an increase in the resistivity is observed. Also, an increased amount of Sm leads to an effective band gap increase, so there is an effective decrease in the charge carriers. The electrical resistivity of all the samples shows metal–insulator transition at transition temperature T P. For x = 0.15 samples, double transition with a single ferromagnetic transition is observed and correlated with existence of regions with different transport features and also favors electronic and magnetic inhomogeneity.
The maximum MR ratio of 65% obtained for applied fields of 8 T at about 253 K and large stable MR of ∼49–51% accounted for melting of charge ordering phenomenon. It indicates that the MR of La1–x Na x MnO3 can be modulated by Sm doping. Thus, La0.7Sm0.15Na0.15MnO3 materials constitute very promising candidates as potential giant MR materials.
The metallic behavior of resistivity of La0.85–x Sm x Na0.15MnO3 with x = 0.1, 0.125, and 0.15 manganites in the temperature range (50 ≤ T ≤ T P) is retraced by using electron–phonon interaction with the model phonon spectrum consisting of two parts: an acoustic branch of Debye type and optical mode with characteristic Einstein temperature. The values of Debye and Einstein temperatures are deduced from the EIoIP within the Hafemeister and Flygare approach. For the sake of simplicity, a single (longitudinal and transverse) optical phonon mode has been considered, with a flat dispersion relation.
It is noticed that the contribution from acoustic and optical phonons together with the residual resistivity is smaller than the experimental data. A clear straight line is depicted from ∼140 to ∼175 K temperature range while plotting the difference as a function of T 2. The observation of power temperature dependence of resistivity points toward electron–electron scattering. The extra contribution arising from the electron–electron contribution is required.
The power temperature contribution points to the importance of electron–electron scattering. The mean free path is greater than the Mn–O bond length and the product k Fℓ ∼ 1 favors metallic conduction. Hence, it is appropriate to use the Bloch–Gruneisen expression in estimating the electron phonon contributions at T < T P, and is associated with the dynamic Jahn–Teller distortion, arising from the local lattice distortion due to the strong electron–phonon coupling. The electron scattering rate at low temperature is inversely proportional to Fermi energy and the value of εF ∼ 1.833 eV in doped manganites as compared to conventional metals, which implies that the low value of εF enhances the electron–electron scattering rate at low temperatures. Deduced scattering rate at low temperatures is of the order of 1014–1015 s−1 in Sm-doped manganites. Hence, the identity εFτ > 1 holds for manganites and again argues in favor of metallic conductivity.
In addition, we succeeded in exploring the role of electron–magnon scattering in the electrical transport mechanism. It is noticeable that the role of two-magnon scattering in the resistivity behavior is prominent above 125 K. We propose that the incorporation of T 4.5 dependence is essential and may consistently reproduce the experimental results for the resistivity at higher temperatures. It is inferred from the above analysis that the electrical transport below T P is not only dominated by electron–electron scattering, but also by electron–magnon, presumably involving spin fluctuations of charge carriers.
The resistivity data of semiconducting state at high temperature region, T > T P, are analyzed by using adiabatic SPC model. The SPC model with realistic physical parameters consistently retraces the semiconducting behavior. The nearest-neighbor hopping of a small polaron leads to a mobility with a thermally activated form and successfully retraced the reported experimental curve in the paramagnetic phase. The value of charge carrier density (n) gradually decreases and E P increases with increasing doping and in the presence of field observed behavior is vice versa. This is owing to increase in Mn–O–Mn bond angle substantial increase effective band gap and in applied field delocalization of charge carriers occurs to reduce E P and n. Above the T P, the Jahn–Teller-type distortion present in the unit cell traps the charge carriers and gives rise to polarons. Hence, above the T P, the resistivity shows a polaronic-type behavior.
We have provided a simple explanation of these effects, there is a clear need for good theoretical understanding of the resistivity behavior in view of the formation of small polarons may be of magnetic origin in manganites. To achieve an overall understanding of the CMR effects in the alkali-metal doped distorted perovskite manganites with magnetic ions; further investigations with magnetic studies are necessary.
ACKNOWLEDGMENTS
Financial assistance from UGC, New Delhi, India is gratefully acknowledged. Authors are thankful to UGC-DAE CSR, Indore for providing characterization facilities. Useful discussions with Dr. R. Rawat are gratefully acknowledged.
APPENDIX
The understanding of the dynamical properties of materials requires the formulation of an effective interionic potential and is of substantial importance, as there is much disagreement as to whether long- or short-range interactions are at the origin of the properties of doped manganites. While developing a specific model, we assume that the change in force constants is small; the short-range interactions are effective up to the second-neighbor ions; and the atoms are on hold by elastic forces in the harmonic approximation without any internal strains within the crystal. The crystal energy for a particular lattice separation (r) as:
 $$U\left( r \right) = U_{\rm{C}} \left( r \right) + U_{\rm{R}} \left( r \right) + U_{\rm{V}} \left( r \right)\quad{\rm{.}}$$
The first term is the Coulomb energy, and follows:
 $$U_{\rm{C}} \left( r \right) = - \mathop\sum\limits_{ij} {{{Z_i Z_j e^2 } \over {r_{ij} }}} = - {{{\rm{\alpha }}_{\rm{m}} Z^2 e^2 } \over r}{\rm{\quad.}}$$
Here, αm as the Madelung constant Reference Tosi36 and r ij being the separation distance between i and j ions.
The short-range overlap repulsive energy is the second term in Eq. (A1) as:
 $$U_{\rm{R}} \left( r \right) = nb{\rm{\beta }}_{ij} \exp \left( {{{r_i + r_j - r_{ij} } \over {\rm{\rho }}}} \right) + n'b{\rm{\beta }}_{ii} \exp \left( {{{2r_i - kr_{ij} } \over {\rm{\rho }}}} \right) + n'b{\rm{\beta }}_{jj} \exp \left( {{{2r_j - kr_{ij} } \over {\rm{\rho }}}} \right){\rm{\quad,}}$$
following Hafemeister and Flygare. Reference Hafemeister and Flygare37 The notations r i (r j ) refer to the ionic radii, k is the structure factor, n (n′) is the number of nearest (next nearest) ions, respectively. Further, the notations b and ρ denote the hardness and range parameters, respectively.
The Pauling coefficients, β ij are defined in terms of valence [Z i (Z j )] and number of the outermost electrons [n i (n j )] in the anions (cations), respectively, as:
 $${\rm{\beta }}_{ij} = 1 + \left( {{{z_i } \mathord{\left/ {\vphantom {{z_i } {n_i }}} \right. \kern-\nulldelimiterspace} {n_i }}} \right) + \left( {{{z_j } \mathord{\left/ {\vphantom {{z_j } {n_j }}} \right. \kern-\nulldelimiterspace} {n_j }}} \right)\quad.$$
The last term in Eq. (A1) is the vdW energy, denoted as:
 $$U_{\rm{V}} \left( r \right) = - \left( {\mathop\sum\limits_{ij} {{{c_{ij} } \over {r_{ij}^6 }}} + \mathop\sum\limits_{ij} {{{d_{ij} } \over {r_{ij}^8 }}} } \right){\rm{\quad,}}$$
 $$= - \left( {{C \over {r^6 }} + {D \over {r^8 }}} \right)\quad{\rm{,}}$$
due to dipole–dipole (d–d) and dipole–quadruple (d–q) interactions. The abbreviations C and D represent the overall vdW coefficients, defined as Reference Tosi36 :
 $$C = c_{ij} S_6 \left( r \right) + {1 \over 2}\left( {c_{ii} + c_{jj} } \right)S_6 \left( 0 \right)\quad{\rm{.}}$$
and
 $$D = d_{ij} S_8 \left( r \right) + {1 \over 2}\left( {d_{ii} + d_{jj} } \right)S_8 \left( 0 \right)\quad,$$
c ij and d ij are the vdW coefficients due to d–d and d–q interactions. We follow the variational method Reference Slater and Kirkwood38 to derive c ij and d ij as:
 $$c_{ij} = {3 \over 2}{{e\hbar } \over {\sqrt {m_{\rm{e}} } }}{\rm{\alpha }}_i {\rm{\alpha }}_j \left[ {\left( {{{{\rm{\alpha }}_i } \mathord{\left/ {\vphantom {{{\rm{\alpha }}_i } {N_i }}} \right. \kern-\nulldelimiterspace} {N_i }}} \right)^{{1 \mathord{\left/ {\vphantom {1 2}} \right. \kern-\nulldelimiterspace} 2}} + \left( {{{{\rm{\alpha }}_j } \mathord{\left/ {\vphantom {{{\rm{\alpha }}_j } {N_j }}} \right. \kern-\nulldelimiterspace} {N_j }}} \right)^{{1 \mathord{\left/ {\vphantom {1 2}} \right. \kern-\nulldelimiterspace} 2}} } \right]^{ - 1} {\rm{\quad.}}$$
and
 $${ d_{ij} = {{27} \over 8}{{\hbar ^2 } \over m}{\rm{\alpha }}_i {\rm{\alpha }}_j \left[ {\left( {{{{\rm{\alpha }}_i } \mathord{\left/ {\vphantom {{{\rm{\alpha }}_i } {N_i }}} \right. \kern-\nulldelimiterspace} {N_i }}} \right)^{{1 \mathord{\left/ {\vphantom {1 2}} \right. \kern-\nulldelimiterspace} 2}} + \left( {{{{\rm{\alpha }}_j } \mathord{\left/ {\vphantom {{{\rm{\alpha }}_j } {N_j }}} \right. \kern-\nulldelimiterspace} {N_j }}} \right)^{{1 \mathord{\left/ {\vphantom {1 2}} \right. \kern-\nulldelimiterspace} 2}} } \right]^2 \left[ {\left( {{{{\rm{\alpha }}_i } \mathord{\left/ {\vphantom {{{\rm{\alpha }}_i } {N_i }}} \right. \kern-\nulldelimiterspace} {N_i }}} \right) + {{20} \over 3}\left( {{{{\rm{\alpha }}_i {\rm{\alpha }}_j } \mathord{\left/ {\vphantom {{{\rm{\alpha }}_i {\rm{\alpha }}_j } {N_i N_j }}} \right. \kern-\nulldelimiterspace} {N_i N_j }}} \right)^{{1 \mathord{\left/ {\vphantom {1 2}} \right. \kern-\nulldelimiterspace} 2}} + \left( {{{{\rm{\alpha }}_j } \mathord{\left/ {\vphantom {{{\rm{\alpha }}_j } {N_j }}} \right. \kern-\nulldelimiterspace} {N_j }}} \right)} \right]^{ - 1} \quad{\rm{.}} }$$
Here, m e is the electron mass, α i is the electronic polarizability, and N i denotes the effective number of electrons of the ith ion. The values of the overall vdW coefficients are obtained using Eqs. (A5) and (A6), and weighted in terms of appropriate lattice sums [S 6(0), S 6(r), S 8(0), and S 8(r)]. Reference Tosi36 We believe that there is no uncertainty involved in the evaluation of c ij and d ij , due to the fact that the excitation energies are ignored in Eqs. (A6a) and (A6b). While applying for manganites herein, the above description, we shall seek the interionic interaction in between a pair such as Mn–O and La/A–O.
It is clear from the above descriptions that the present effective interionic potential contains only two free parameters (b and ρ), which are determined from the equilibrium conditions:
 $$\left( {{{{\mathop{\rm d}\nolimits} U} \over {{\mathop{\rm d}\nolimits} r}}} \right)_{r = r_0 } = 0\quad,$$
and Bulk modulus
 $$B_{\rm{T}} = {1 \over {9kr_0 }}\left( {{{{\mathop{\rm d}\nolimits} ^2 U} \over {{\mathop{\rm d}\nolimits} r^2 }}} \right)_{r = r_0 }\quad .$$
While estimating these values, we use the Bulk modulus Reference Markovich, Fita, Puzniak, Rozenberg, Martin, Wisniewski, Maignan, Raveau, Yuzhelevskii and Gorodetsky39 from experiment and r 0 (obtained from Rietveld refinement of XRD data). The model parameters obtained from Eqs. (A7a) and (A7b) have been used to compute the SOECs (C 11, C 12, and C 44) as Reference Varshney and Dodiya40,Reference Varshney and Dodiya41
 $$C_{11} = {{e^2 } \over {4r_0^4 }}\left[ { - 5.112Z_{\rm{m}}^2 + A_1 + {{\left( {A_2 + B_2 } \right)} \over 2}} \right]{\rm{\quad,}}$$
 $$C_{12} = {{e^2 } \over {4r_0^4 }}\left[ {0.226Z_{\rm{m}}^2 - B_1 + {{\left( {A_2 - 5B_2 } \right)} \over 2}} \right]{\rm{\quad,}}$$
 $$C_{44} = {{e^2 } \over {4r_0^4 }}\left[ {2.556Z_{\rm{m}}^2 + B_1 + {{\left( {A_2 + 3B_2 } \right)} \over 4}} \right]{\rm{\quad,}}$$
where (A 1, B 1) and (A 2, B 2) are the short-range parameters for the nearest and the next nearest neighbors, respectively. These parameters are further defined as
 $$A_1 = {{4r_0^3 } \over {e^2 }}\left[ {{{{\mathop{\rm d}\nolimits} ^2 } \over {{\mathop{\rm d}\nolimits} r^2 }}V_{ij} \left( r \right)} \right]_{r = r_0 } \quad,$$
 $$\!\!A_2 = {{4\left( {r_0 \sqrt 2 } \right)^3 } \over {e^2 }}\left[ {{{{\mathop{\rm d}\nolimits} ^2 } \over {{\mathop{\rm d}\nolimits} r^2 }}V_{ii} \left( r \right) + {{{\mathop{\rm d}\nolimits} ^2 } \over {{\mathop{\rm d}\nolimits} r^2 }}V_{jj} \left( r \right)} \right]_{r = r_0 \sqrt 2 } \quad{\rm{,}}$$
 $$B_1 = {{4r_0^3 } \over {e^2 }}\left[ {{{\mathop{\rm d}\nolimits} \over {{\mathop{\rm d}\nolimits} r}}V_{ij} \left( r \right)} \right]_{r = r_0 }\quad {\rm{,}}$$
 $$\!B_2 = {{4\left( {r_0 \sqrt 2 } \right)^2 } \over {e^2 }}\left[ {{{\mathop{\rm d}\nolimits} \over {{\mathop{\rm d}\nolimits} r}}V_{ii} \left( r \right) + {{\mathop{\rm d}\nolimits} \over {{\mathop{\rm d}\nolimits} r}}V_{jj} \left( r \right)} \right]_{r = r_0 \sqrt 2 }\quad {\rm{,}}$$
where V ij (r) is the short-range potentials between the ions, which follow
 $$V_{ij} \left( r \right) = b{\rm{\beta }}_{ij} \exp \left( {{{r_i + r_j - r_{ij} } \over {\rm{\rho }}}} \right) + c_{ij} r_{ij}^{ - 6} + {\mathop{\rm d}\nolimits} _{ij} r_{ij}^{ - 8} \quad.$$
The elastic force constant κ is derived at the equilibrium interionic distance r 0 following
 $${\rm{\kappa }} = {{r_0 } \over 2}\left[ {\pi ^2 \left( {C_{11} - C_{12} } \right)\left( {C_{11} + C_{12} + 2C_{44} } \right)\left( {C_{44} } \right)} \right]^{{1 \over 3}} \quad{\rm{.}}$$
We have thus estimated the elastic force constants for a pair such as Mn–O and La/A–O and have the total force constants of the A-doped LaMnO3. This continuum model thus takes care of the clear physical binding in doped manganites incorporating vdW interactions. However, the true potential must recognize the correct charge distribution and the relative orientations of the interacting atoms in manganites which is a complicated task.
We shall now estimate the acoustic Debye branch characterized by the Debye temperature θD and an optical peak defined by the Einstein temperature θE. The Debye frequency is characterized as a cut off frequency at the Brillouin zone boundary. It can be expressed in terms of effective value of ionic mass and elastic force constant for crystal lattices with two different kinds of atoms such as Mn–O and La/A–O, which we deal with. The acoustic-mode and optical-mode frequencies are estimated in an ionic model using a value of effective ion charge Ze = −2e.
We choose an acoustic mass M = (2M + + M −) [Mn (O) which is symbolized by M +(M −)], κ* = 2κ for each directional oscillation mode to get the acoustic phonon frequency as
 $${\rm{\omega }}_{\rm{D}} = \sqrt {{{2{\rm{\kappa }}^* } \over M}}\quad .$$
Furthermore, when the phonons belong to optic modes, their frequency is determined by the reduced mass as μ−1 = M(A)−1 + M(B)−1 where A is the anion (La/A, Mn) and B is the cation (O)
 $${\rm{\omega }}_{{\rm{LO}}}^2 = {{{\rm{\kappa }} + {\rm{\eta }}} \over {\rm{\mu }}}{\rm{\quad,}}$$
 $${\rm{\omega }}_{{\rm{TO}}}^2 = {{{\rm{\kappa }} - {\rm{\eta }}} \over {\rm{\mu }}}{\rm{\quad,}}$$
where η is the force constant as
 $${\rm{\eta }} = {{8{\rm{\pi }}} \over 3}{{\left( {Ze} \right)^2 } \over \Omega }\quad{\rm{.}}$$
ωLO (ωTO) symbolized for the longitudinal (transverse) optical phonon frequency and Ω for the volume of the unit cell. We must mention that these computed values for La1–x A x MnO3 with 0.25 ≥ x ≥ 0.35 could not be compared due to the lack of the experimental data. However, the computed values of Debye and Einstein temperature for doped La0.7Ba0.3 MnO3 manganites are consistent with previous specific heat and Raman spectroscopic measurements.
It is true that the two-orbital model based on Wannier functions predicts the electronic states such as charge ordering in manganites. As mentioned, the Wannier function approach of the electronic problem is useful for the description of electron dynamics following a semiclassical theory as well as the magnetic interactions in solids. Reference Marzari and Vanderbilti42 In the present investigations, we do not intend to discuss the electron dynamics as well the magnetic interactions, but focused on determining the acoustic (optical) phonon frequency to estimate the electron–phonon contribution of resistivity in the FMM phase.
Earlier, Millis Reference Millis43 determines the elastic parameters using a mean field approximation with emphasis on Mn–O bond lengths to evaluate the Mn–Mn and Mn–O force constants for the lattice distortions. However, we have considered both Mn–O and La/A–O bond lengths to obtain the Mn–O, La/A–O force constant, and total force constants for strong electron–phonon interaction. The formulated EIoIP includes the long-range Coulomb, vdW interaction, and the short-range repulsive interaction up to second-neighbor ions within the Hafemeister and Flygare approach. The interionic interaction in between a pair such as Mn–O and La/A–O enables us to find the total force constant with consistent Debye and Einstein temperatures.
The developed EIoIP thus takes care of the interactions in between a pair such as Mn–O and La/A–O. The interactions thus are attractive Coulomb, and vdW as well as short-range overlap repulsive interaction following Hafemeister and Flygare type potential. The advantage of using this potential is that it takes care of number of nearest (next nearest) ions, the valence, and number of the outermost electrons in the anions (cations), respectively. Thus, it takes care of the structural parameters that yield an approximately correct description of the interactions between a pair such as Mn–O and La/A–O. Henceforth, we are able to estimate the acoustic and optical phonon frequency consistent with the specific heat and Raman measurements to estimate the electron–phonon contribution of resistivity.