Implications
Clinical mastitis is a disease with large economically consequences for dairy cattle breeders. In the past, this trait was selected indirectly, taking advantage of its high genetic correlation with somatic cell scores. To be more efficient, a direct genetic evaluation of mastitis occurrence was implemented for the Normande, Montbéliarde and Holstein breeds in France in June 2010. The trait definition was the presence or absence of clinical mastitis during the first 150 days of lactation. A two-step multiple trait evaluation was used to combine mastitis occurrence with correlated traits, leading to reliable official breeding values.
Introduction
Udder health (UH) is one of the most economically important trait groups in dairy cattle production. Resistance to clinical mastitis (CM) is the trait of main interest regarding UH. Mastitis is a frequent and complex disease defined as an inflammation of the mammary gland due to pathogens in the udder. The main consequences of CM are higher veterinary costs, but also a decrease of milk production and a higher rate of involuntary culling. Furthermore, CM and milk yield present an unfavorable genetic correlation (Carlén et al., Reference Carlén, Emanuelson and Strandberg2004; Hinrichs et al., Reference Hinrichs, Stamer, Junge and Kalm2005). So on the long term, consequences of CM for breeders are increasingly detrimental. Although management and hygiene practices on farms have a large impact on CM (Pérez-Cabal et al., Reference Pérez-Cabal, de los Campos, Vazquez, Gianola, Rosa, Weigel and Alenda2009; Vazquez et al., Reference Vazquez, Perez-Cabal, Heringstad, Rodrigues-Motta, Rosa, Gianola and Weigel2012), genetic selection for mastitis resistance is also a solution to be considered for improvement of UH. For example, Nordic countries have included mastitis in their genetic evaluation since 1978 and have shown that improvement of resistance to mastitis as a result of genetic selection is effective (Heringstad et al., Reference Heringstad, Chang, Gianola and Klemetsdal2003). However, without a systematic disease recording system, routine evaluation of mastitis is not common. Genetic evaluation of somatic cell score (SCS) can be viewed as a selection tool against sub-clinical mastitis (Miglior et al., Reference Miglior, Muir and Van Doormaal2005). Indeed, clinical and sub-clinical mastitis (SCS) are genetically correlated, thus SCS is used in many countries as a proxy for CM. SCS records are available on a large scale and at a moderate cost, whereas recordings of CM events are not compulsory. In France, genetic evaluation of SCS has been carried out since 1997 using a linear animal model. Several studies estimated the genetic correlation between SCS and CM. For example, Lund et al. (Reference Lund, Jensen and Petersen1999) estimated a genetic correlation between mastitis and somatic cell production deviance on 0.80 (defined as the lactation mean of test-day deviance of SCS from a normal curve). Koeck et al. (Reference Koeck, Heringstad, Egger-Danner, Fuerst, Winter and Fuerst-Waltl2010) found values ranging from 0.64 to 0.77 depending on the stage of lactation. De Haas et al. (Reference De Haas, Ouweltjes, ten Napel, Windig and de Jong2008) estimated this genetic correlation between 0.55 and 0.93 according to different definitions of SCS. Carlén et al. (Reference Carlén, Emanuelson and Strandberg2004) obtained a value of 0.70 using a linear mixed model, whereas Heringstad et al. (Reference Heringstad, Rekaya, Gianola, Klemetsdal and Weigel2006) found a correlation of 0.62 with a threshold model. These values indicate that although the genetic correlation between SCS and CM is high, the two traits cannot be considered as being identical: it was shown that a genetic evaluation based on SCS was not able to identify the best sires for liability to CM (Heringstad et al., Reference Heringstad, Rekaya, Gianola, Klemetsdal and Weigel2006). Furthermore, the same authors (Heringstad et al., Reference Heringstad, Gianola, Chang, Odegård and Klemetsdal2004) indicated that genetic correlations between CM varied with stage of lactation, implying that mastitis occurrence is a changing trait throughout the lactation. Koeck et al. (Reference Koeck, Heringstad, Egger-Danner, Fuerst, Winter and Fuerst-Waltl2010) considered that CM and SCS described different aspects of UH, so breeding programs should take both traits into account.
Implementation of direct genetic evaluation for mastitis resistance is undertaken in some countries other than Nordic countries, for example, in Austria (Koeck et al., Reference Koeck, Heringstad, Egger-Danner, Fuerst, Winter and Fuerst-Waltl2010) or Canada (Jamrozik et al., Reference Jamrozik, Koeck, Miglior, Kistemaker, Shenkel, Kelton and Van Doormaal2013). In France, data regarding mastitis occurrence have been collected since 1995 through milk recording organizations for eight dairy breeds. The efficiency of selection depends on accuracy and completeness of data collection, which are difficult to assess. This study describes the different steps that led to the implementation of a routine genetic evaluation on occurrence of CM in France with a particular focus on the three main dairy breeds (Montbéliarde (MO), Normande (NO) and Holstein (HO)).
Material and methods
Special attention was first given to data quality, which at least partly depends on the ability to distinguish between absence of CM and poor recording. Then a single trait evaluation model was defined from which genetic parameters were obtained from a subset of the data. The next step aimed at finding other traits, in particular type traits, correlated with CM, which could contribute to an increase of the reliability of CM estimated breeding values (EBV) in a multiple trait evaluation. Finally, such an evaluation was implemented and its results and consequences are presented and discussed.
Phenotype and trait definition
Collection of data on occurrences of CM started in France in 1995 on a small scale and was generalized to the whole country in 2004. Farmers are asked to voluntarily report any event of CM to the milk recording technician during his/her monthly visit. Records are centralized in the French National database and concern the eight breeds evaluated in the French genetic evaluation system. The analyzed trait for genetic parameter estimation (Dassonneville et al., Reference Dassonneville, Barbat-Leterrier, Gion, Larroque and Ducrocq2009) and genetic evaluation was defined as a binary (0/1) variable equal to 1 if at least one CM event was reported within the first 150 days of lactation and 0 otherwise. This restricted period was introduced to give all cows the same opportunity to express a CM and to reduce a potential bias because of culling occurring in the later part of lactation, as in Carlén et al. (Reference Carlén, Strandberg and Roth2006). For consistency with other genetic evaluations in France (e.g. on production traits, SCS), only the first three lactations were considered.
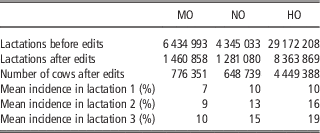
A difficulty with such type of data is that a value of 0 (no CM occurrence) may correspond to an unreported event. Therefore, to increase the probability that it really corresponds to a healthy cow, records were selected only from farms and regions, which seemed to correctly declare mastitis events, based on a minimum percentage of lactations with a reported CM case per herd and per year (all lactations were included for this step). This minimum was set to 10% for genetic parameters estimation and 5% for genetic evaluation. In other words, it was assumed that herds with a proportion of CM cases lower than these threshold values on a given year were actually underreporting CM and the corresponding data were discarded. However, to account for the fact that small herds (with <20 lactations/year) could indeed have no cases of CM on a particular year, this rule was not applied if these herds had a least one case on the previous and following year. Observations from the last year of data were deleted if the lactation length was less than 150 days. Table 1 shows the number of lactations and cows included in the June 2014 univariate genetic evaluation for MO, NO and HO, after edits of data according to these criteria.
Number of lactations, cows included in the June 2014 genetic evaluation and mastitis incidence during the first 150 days of lactation, according to lactation number for the Montbéliarde (MO), Normande (NO) and Holstein (HO) breeds

For the estimation of genetic parameters, analyses were restricted to a few administrative regions (‘départements’) characterized by a large number of animals and also a relatively high proportion of lactations with mastitis. These were located in eastern and central France for MO, in western France for NO and from the department of Ille et Vilaine, in western France for HO. As a result, 206 661 MO, 187 668 NO and 296 758 HO lactations were used for genetic parameters estimation.
Models
Estimation of variances and heritability of mastitis
Variance components of CM were estimated based on an animal model and using restricted maximum likelihood as implemented in the WOMBAT software (Meyer, Reference Meyer2007). Given the binary nature of CM, a threshold model is supposed to be more appropriate (Gianola and Foulley, Reference Ducrocq, Boichard, Barbat and Larroque1983); however, a preliminary study could not confirm this (similar heritability on the observed scale, similar ranking, most likely because the incidence of CM was not very low).
Therefore, the following linear mixed model was used:
 $${\bf y}{\rm =}{\bf X}{\bbeta}{\plus}{\bf Za}{\plus}{\bf Zp}{\plus}{\bf e}$$
where y is the CM (0/1) indicator, ß the vector of fixed effects consisting of a herd×year effect, a month of calving×region×year effect, and an age of calving×parity×year effect, a the vector of normally distributed additive genetic effects N(0, A
 $$\sigma _{g}^{2} $$
) where A is the relationship matrix, p the vector of random permanent environment effects N(0, I
 $$\sigma _{p}^{2} $$
) and e a vector of random residual N(0, I
 $$\sigma _{e}^{2} $$
). X and Z are incidence matrices and
 $$\sigma _{g}^{2} $$
,
 $$\sigma _{p}^{2} $$
,
 $$\sigma _{e}^{2} $$
the genetic, permanent environment and residual variances. First, a generalized linear model procedure (SAS) confirmed that these fixed effects were all significant. The year classes were defined from 1 September to 31 August the next year. Age at calving was defined as 3-month classes for first parity, and 4-month classes for second and third parity. Records from cows calving below 21 months of age were removed from the analysis. Records from lactations 2 and 3 were included only if the records from previous lactation(s) were known. Ancestors were traced back in the pedigree file for at most five generations.
Univariate genetic evaluation of CM
A univariate evaluation of CM was performed, based on the same database, the same trait definition and the same statistical model (1) as for the genetic parameters estimation. The only differences were that (a) region was ignored in the month of calving×region×year effect interaction and (b) heterogeneous residual variances per region×year and per parity×year combination were included, to account for the effect of the fluctuating mean incidence of mastitis on the variability of the binary trait. These residual variances were estimated simultaneously with the fixed and random effects of the model as in Robert-Granié et al. (Reference Robert-Granié, Bonaïti, Boichard and Barbat1999).
At the end of this evaluation and in order to specifically estimate the genetic correlation between CM and other important traits, pre-adjusted records and their associated weight were computed for each recorded cow. Using pre-adjusted records for different traits as pseudo-phenotypes, individual performances can be described using a simplified unique model whatever the complexity of the original univariate model of analysis, according to an approach developed by Ducrocq (Reference Ducrocq2001) and validated by Lassen et al. (Reference Lassen, Sorensen, Madsen and Ducrocq2007) to efficiently compute a total merit index. In the case of CM, two types of pre-adjusted records were computed for reasons indicated later: original records were corrected by subtracting solutions for fixed effects, permanent environment effect and, in addition, for one of the two types, for half the dam’s genetic effect of the univariate evaluation. These corrected records were averaged over lactations 1 to 3 of each cow and a weight was associated to each of them. These weights w
k
are related to the number of observations for animal k as well as the environment permanent and residual variances
 $$\sigma _{p}^{2} $$
and
 $$\sigma _{e}^{2} $$
:
 $$w_{k} {\rm =}\,s_{k} \left( \!{{\rm 1{\minus}}s_{k} \left( {s_{k} {\rm {\plus}}{{{\rm \sigma }_e^{\rm 2} } \over {{\rm \sigma }_P^{\rm 2} }}} \right)^{{\!\!\!\!\!\!{\rm {\minus}1}}} } \right)\,{\rm with}\,\,s_{k} {\rm =}\!\mathop{\sum}\limits_{\rm l} {s{}_{{lk}}{\times}\!\left( {{\rm 1{\minus}}{{\rm 1} \mathord{\left/ {\vphantom {{\rm 1} N}} \right. \kern-\nulldelimiterspace} N}_{{{\rm [}lk{\rm ]}}} } \right)} $$
where s
IK
represents the weight of record l of animal k, and
 $$N_{{[lk]}} $$
the size of the herd×year contemporary group in which this record was obtained. This formula represents the value of the diagonal element of the mixed model equations for cow k after absorption of the equations for her permanent environment effect and her contemporary group, before addition of the genetic variance contribution.
Genetic correlation between mastitis and other traits
To select the most relevant predictors for mastitis occurrence, that is, the ones with the largest correlations with CM, and to estimate the genetic correlations required for a multiple trait evaluation, a subset of the complete CM data file of pre-adjusted records for each breed was prepared and complemented for each cow with her pre-adjusted records on traits of interest (Ducrocq et al., Reference Ducrocq2001). Traits included in this model were milk yield, SCS, functional longevity (FL), five fertility traits, CM and seven or eight conformation traits according to the breed (definition of these traits, details on their genetic evaluation as well as their weight in the total merit index (ISU) can be found on the Interbull website at http://www.interbull.org/ib/geforms). Not all the traits analyzed together were necessarily related to CM, as a secondary objective here was to estimate the correlations between all traits to be included in ISU and any other trait bringing correlated information. Considering them altogether guaranteed a positive definite genetic correlation matrix.
Genetic correlations were estimated by REML (restricted maximum likelihood) assuming known (fixed) genetic and residual variances for each trait. The data set consisted of pre-adjusted records (corrected for the dam’s EBV) of daughters born between 1994 and 2008 from sires with a minimum of 10 daughters for MO and NO, and 30 for HO. In total, 1 113 331 (MO), 995 759 (NO) and 1 737 308 (HO) records of daughters of, respectively, 2666, 2101 and 2429 sires were included in the analysis.
Genetic and residual correlations between CM and the other functional and type traits (one at a time) were estimated and type traits with no correlation estimate larger than 0.10 with any functional trait were discarded. Then, genetic correlations between 16 (for MO and NO) and 17 (for HO) traits were estimated altogether with the following sire model:y*=Ub+Zs+e* (2)
 $${\bf y}^{\asterisk}{\rm =}{\bf Ub}{\plus}{\bf Zs}{\plus}{\bf e}^{\asterisk}$$
where y* is the vector of pre-adjusted performances (here including the correction for the dam’s EBV), b the vector of effects of the sire’s year of birth (to account for a possibly biased genetic trend in the initial univariate analysis (Ducrocq et al., Reference Ducrocq, Delaunay, Boichard and Mattalia2003), s the vector of sire effects and e* a vector of random residuals with a specific variance for each pre-adjusted records accounting for the amount of information (weight) and U and Z are incidence matrices.
Multiple trait genetic evaluation
The pre-adjusted records (no longer corrected for the dam’s EBV) for CM, for other traits included in the breed specific ISU (production, type, functional traits, etc.) and for other traits correlated with these were merged and analyzed with a multiple trait BLUP animal model approach. This multiple trait evaluation resulted in new breeding values for all animals and for all traits, which combine direct performances and indirect information from correlated (indicator) traits. This approach is an approximation of a ‘exact’ multiple trait evaluation with the initial (possibly repeated) phenotypes for each traits are described with their specific, sometimes very sophisticated, evaluation model. The resulting breeding values combining different sources of information are the ones which are officially published for CM and other functional traits. They are also the ones included in the French total merit index ISU. The EBV combining different sources of information were standardized to a mean of 0 and a genetic standard deviation corresponding to the square root of the estimated breed genetic variance. For each animal, the reliability of the combined EBV was computed using the Harris and Johnson (Reference Harris and Johnson1998) approach. This reliability was compared with the one obtained when only CM information is included or when correlated traits are added one at a time.
In order to assess the impact of past selection on traits correlated with CM, the observed genetic trend for CM was computed for the three breeds and compared in particular with the genetic trend for SCS.
As previously mentioned, few countries directly record and evaluate CM but many use SCS as a proxy trait for CM, in particular for the Interbull international evaluation of CM. Only the Nordic countries (DFS) and more recently (since December 2014) Canada are supplying CM evaluations based on an efficient and strict mastitis recording system. The French HO bulls’ EBV for CM obtained with the first step of the national CM evaluation (i.e. the univariate evaluation based on CM events only) were first sent to Interbull for the September 2011 test run to replace its SCS proxy and the impact of this change was inspected.
Results and discussion
Heritability estimates
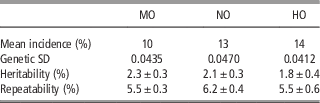
Heritability estimates for occurrence of CM within the first 150 days of lactation are reported in Table 2 for the three breeds when a linear animal model was used.
Mean incidence, genetic standard deviation, genetic parameter estimates and standard deviation for clinical mastitis with an animal model and French records, for the Montbéliarde (MO), Normande (NO) and Holstein (HO) breeds

These values are low, but relatively similar and consistent with a previous study of Rupp and Boichard (Reference Rupp and Boichard1999) who obtained an estimate of 2.5%. Bonaiti et al. (Reference Bonaïti, Moureaux and Mattalia2005) reported heritability estimates using a threshold sire model equal to 6% (NO and MO) or 7% (HO), which again correspond to similar heritabilities on the observed scale. In a study with first lactation Fleckvieh cows, Koeck et al. (Reference Koeck, Heringstad, Egger-Danner, Fuerst, Winter and Fuerst-Waltl2010) found a heritability estimate of 5% on the underlying scale, with a sire model. Heringstad et al. (Reference Heringstad, Rekaya, Gianola, Klemetsdal and Weigel2006) with a univariate threshold model and mastitis between −15 and +30 days after calving, found a heritability estimate of 7.6%. In another study, Heringstad et al. (Reference Heringstad, Gianola, Chang, Odegård and Klemetsdal2004) found heritability estimates between 5% and 9% according to the stage of lactation, again with a threshold model. They found that heritability estimates were fairly similar for the first three lactations. When comparing different CM measures, Vazquez et al. (Reference Vazquez, Perez-Cabal, Heringstad, Rodrigues-Motta, Rosa, Gianola and Weigel2012) found heritability estimates ranging from 3.2% to 8% for binary CM and number of CM cases. In our case, differences in heritability observed between breeds may be at least partly related to different mean incidences of the trait and to the quality of the data.
Genetic correlations
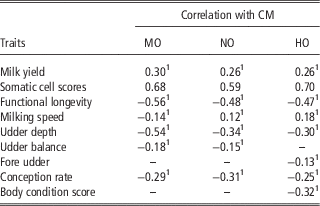
Genetic correlations between mastitis occurrence and other traits included in the multiple trait evaluation are reported in Table 3 (only traits for which the correlation was > 0.1 are reported). Standard errors were small (e.g. between 0.028 and 0.040 for the NO breed).
Genetic correlations between functional traits and clinical mastitis (CM) estimated with an animal model for the Montbéliarde (MO), Normande (NO) and Holstein (HO) breeds

‘–’ means less than 0.10 in absolute value.
1 Negative values are favorable (e.g. lower milk yield or good (shallow) udder depth or good body condition score are genetically associated with fewer mastitis occurrences).
As expected, an unfavorable positive correlation (0.26 to 0.30) between CM and milk yield was observed for all breeds. Such a result was also found by Heringstad et al. (Reference Heringstad, Chang, Gianola and Klemetsdal2003) and leads to a genetic deterioration of resistance to mastitis with increasing milk production. Hinrichs et al. (Reference Hinrichs, Stamer, Junge and Kalm2005) found a correlation between milk yield and mastitis of 0.29 with a test-day animal model and German HO cows. Carlén et al. (Reference Carlén, Emanuelson and Strandberg2004) presented values between 0.26 and 0.45 according to the stage of lactation.
The large genetic correlations between SCS and mastitis (0.59 to 0.70) were consistent with the vast majority of published studies (e.g. Carlén et al., Reference Carlén, Emanuelson and Strandberg2004; Heringstad et al., Reference Heringstad, Rekaya, Gianola, Klemetsdal and Weigel2006), illustrating that the two traits are linked, whatever the stage of lactation. Rupp and Boichard (Reference Rupp and Boichard1999) reported a genetic correlation of 0.72 between CM and SCS within 180 days after calving in HO and Heringstad et al. (Reference Heringstad, Rekaya, Gianola, Klemetsdal and Weigel2006) found a correlation of 0.62 between SCS and CM for days in milk between −15 and +30. Ødegård et al. (Reference Ødegård, Heringstad and Klemetsdal2004) explained that genetic and residual correlations between CM and SCS depend on the prevalence of mastitis, and on the size of the SCC (somatic cell count) response to infection. Carlén et al. (Reference Carlén, Emanuelson and Strandberg2004) also found high genetic correlations, with the highest estimate (0.77) for the third lactation.
The correlations with FL were similar across breeds (−0.47 to −0.56) and of the same magnitude as the correlations between SCS and FL: for a cow, clinical and sub-clinical mastitis strongly increase the risk of being culled.
Interestingly, the relationship between milking speed and mastitis occurrence varied from slightly favorable in MO (−0.14) to slightly unfavorable in HO (0.18) and NO (0.12). Some authors (Rupp and Boichard, Reference Rupp and Boichard1999; Sørensen et al., Reference Sørensen, Mark, Madsen and Lund2009) concluded that an easier milk flow out of the udder is not necessarily associated with easier entry of germs. Koeck et al. (Reference Koeck, Heringstad, Egger-Danner, Fuerst, Winter and Fuerst-Waltl2010) also found no association or favorable associations between CM and milking speed. In HO and NO, where we found an unfavorable relationship, results may be the consequence of the strong selection to improve milking speed, resulting in leakage for some cows, which is often recognized as leading to mastitis.
Udder depth was systematically the best morphological predictor of resistance to mastitis, especially in MO (−0.54). Koeck et al. (Reference Koeck, Heringstad, Egger-Danner, Fuerst, Winter and Fuerst-Waltl2010) showed that udder depth was positively correlated with mastitis occurrence, indicating that cows with higher udders have fewer mastitis treatments. Good conception rate and body condition score (available only in HO) were also favorably correlated with better resistance to mastitis.
These correlations were used in the multiple trait evaluation of which CM was only one trait among many.
Genetic evaluation – data and model
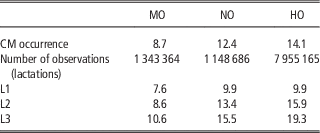
Heringstad et al. (Reference Heringstad, Chang, Gianola and Klemetsdal2003) explained that, when records over a long period are used, changes in prevalence of binary traits over time may favor a threshold model over a standard linear model. However, the same author showed that the rank correlation between sire evaluations with a threshold or a linear model was >0.99. Vasquez et al. (Reference Vazquez, Perez-Cabal, Heringstad, Rodrigues-Motta, Rosa, Gianola and Weigel2012) concluded that for practical purposes, linear models are very competitive compared with non-linear models. Heringstad et al. (Reference Heringstad, Gianola, Chang, Odegård and Klemetsdal2004) reported that 20% to 50% of lactations of Norwegian cattle were affected by CM. The overall mastitis incidences in their total data set were 20.6%, 25.9% and 30.6% in first, second and third lactation, respectively, increasing from 1978 to 1995, and decreasing thereafter. As shown in Table 4, we found lower mastitis occurrence (mastitis during the first 150 days of lactation) in our population (possibly due to some underreporting), between 8.7% and 14.1% of lactation affected by CM, in the same range as Koeck et al. (Reference Koeck, Heringstad, Egger-Danner, Fuerst, Winter and Fuerst-Waltl2010) in Fleckvieh (9.6%).
Clinical mastitis (CM) occurrence during the first 150 days of lactation (%) for the Montbéliarde (MO), Normande (NO) and Holstein (HO) breeds for the three first lactation (national genetic evaluation June 2014)

L1=lactation 1; L2=lactation 2; L3=lactation 3.
Carlén et al. (Reference Carlén, Emanuelson and Strandberg2004) confirmed that mastitis incidence increases with lactation number in Swedish HO. Therefore, it is desirable to include information from later lactations in genetic evaluations. For the HO breed, we observed that CM incidence was globally stable over time (results not shown) but was different according to the regions in France, ranging between 7% and 25%. Again, this strongly suggests that all mastitis events were not always reported by the farmers and occurrence of mastitis was underestimated. This underlines the need for a step of data edits, to ensure a satisfactory quality of genetic evaluation.
Genetic evaluation – reliability and genetic trend
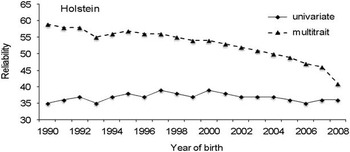
The benefit of using indirect predictors together with direct observations is illustrated by the increase in reliability when moving from a univariate evaluation to a multivariate one. Figure 1 shows the average reliability by birth year of the HO bulls. All bulls born after 1990 with both combined EBV and direct EBV for mastitis were included representing a total of 37 705 bulls for HO.
Average reliability (%) of clinical mastitis estimated breeding value for bulls evaluated with different uni/multivariate models for the Holstein breeds (national genetic evaluation June 2014).

On average, CM reliability was below 0.50 for progeny-tested bulls whatever their birth year, that is, below the reliability threshold for official EBV publication in France. For old proven bulls, this is related to the fact that most of their progeny had their first lactation before mastitis recording became a common practice in all French regions. For younger bulls, the low reliability simply reflects the low heritability of the trait. With the addition of information from other functional traits (SCS and FL essentially), reliability increased by about 0.20 whatever the age of the bulls. The use of the multivariate model permitted that nearly all bulls with recorded daughters, including the youngest ones, passed the 0.50 reliability threshold for official publication of their combined CM evaluation. Similar trends were observed in the MO and NO breeds.
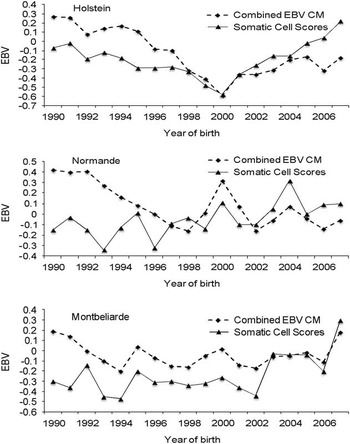
Figure 2 displays the SCS and CM genetic trends for bulls with combined CM reliability above 0.50, representing 17 436, 2707 and 4042 bulls for HO, NO and MO, respectively.
Genetic trend for somatic cell score and combined clinical mastitis (CM) estimated breeding value (EBV) for the Montbéliarde, Normande and Holstein breeds (national genetic evaluation June 2014).

Genetic trends for HO show that in the 1990, mastitis resistance declined more rapidly than its predictor trait (SCS), as a result of the strong selection on production. The implementation of an official somatic cell count evaluation in 1997 and its inclusion in the total merit index (ISU) in 2001 reversed this trend for SCS for the past decade. This had a favorable effect on mastitis but the genetic correlation between the two traits being far from unity, the genetic trend for CM was still lagging. For the MO breed, the trend was much flatter and more erratic, perhaps due to the influence of few particular sires of sons. The evolution of NO breed was intermediate between the two other breeds.
Heringstad et al. (Reference Heringstad, Gianola, Chang, Odegård and Klemetsdal2004) found a genetic improvement for mastitis resistance in first lactation for Norwegian dairy cattle. Trend was steeper in first than in second and third lactations, and for all three lactations, the trend was steeper for intervals in early lactation than for later intervals. These authors concluded that effective selection against CM in early first lactation gave a favorable indirect selection response in other intervals; this was consistent with the positive genetic correlations between intervals.
National and international evaluations
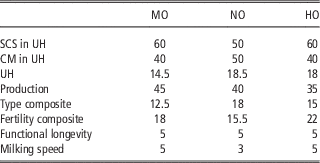
The French genetic evaluation for CM became official in June 2010 for the main three dairy cattle breeds and was extended to the five minor breeds (Brown Swiss, French Simmental, Tarentaise, Abondance and Red) in June 2011. For bulls, the reliability threshold for the official publication of EBV is 0.50, with a minimum of 10 recorded daughters. CM EBV are not published for cows but are now part of an overall udder health index and are included in the new total merit index introduced in 2012 (ISU – see Table 5). Genomic evaluations on CM are also routinely published for the three main breeds as well as for the Brown Swiss breed.
Relative weight (%) of somatic cell score (SCS) and clinical mastitis (CM) in the udder health (UH) composite and of the various composite indices in the total merit index (ISU) for the Montbéliarde (MO), Normande (NO) and Holstein (HO) breeds

International evaluations for UH traits
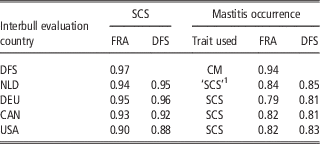
Genetic correlations with other countries were computed by Interbull for the UH traits SCS and CM. For France, replacing SCS EBV by CM EBV led to a very high genetic correlation with DFS (0.94) as shown on Table 6, quite similar to the genetic correlations (0.90 to 0.97) between countries supplying the same trait (SCS) to the SCS international evaluation. When Canada started to use CM EBV in December 2014, genetic correlation between France and Canada increased from 0.82 to 0.95, and decreased with countries sending SCS as a proxy.
Genetic correlations between France and other countries used in Interbull MACE (multiple across country evaluation) for somatic cell score (SCS) and clinical mastitis (CM) for the Holstein breed

FRA=France; DFS=Denmark, Finland and Sweden; NLD=The Netherlands; DEU=Germany and Austria; CAN=Canada; USA=United States of America.
Source: Interbull (2014).
1 CM using somatic cells count patterns and magnitude as proxy (De Haas et al., Reference De Haas, Ouweltjes, ten Napel, Windig and de Jong2008).
In contrast, the genetic correlations between France or DFS and the countries supplying SCS EBV as proxy for the CM international evaluation were lower (around 0.80). This illustrates the added value of actually collecting direct information on CM occurrence. It also shows that the less accurate recording system used in France based on voluntary reporting of health events, nevertheless leads to genetic evaluation of the same trait as other countries using stricter recording protocols.
Conclusion
In the genomic era, a large overall genetic trend can be achieved. With an existing trend on production traits already high, this offers the possibility to more intensively select for health traits, such as resistance to mastitis.
Combined EBV as well as genomically enhanced EBV on CM have been published in France three times a year since June 2010. Despite a not particularly strict data collection system and a low heritability, these EBV are a valuable tool together with the EBV for SCS to at least counterbalance the negative correlated response on mastitis resistance due to selection on production traits. The inclusion of CM in the approximate multivariate BLUP animal model evaluation leads to EBV combining all sources of information regarding UH and to higher reliabilities. The combined CM EBV are now used in the UH composite, which has been included in the French total merit index (ISU) introduced in February 2012. This total merit index confers a larger part to UH than previously for all breeds. More sustainable genetic trends should follow.
Acknowledgments
The authors acknowledge the numerous comments of the anonymous reviewers, which helped to improve the manuscript.