Implications
In high-production cattle, ruminants fed high-energy diets can develop ruminal acidosis caused by an accumulation of organic acids and insufficient rumen buffering inducing a low ruminal pH for several hours per day. Severe consequences are reported, such as intake depression, low fibre digestion, diarrhoea, liver abscesses, general inflammation and laminitis, with negative impacts on production and animal welfare. The aim of this study was to describe sheep behaviour response to acidosis and determine whether this response changed with repeated acidosis episodes and with yeast supplementation. Our results show that when sheep experience acidosis, they are more agitated, more aggressive towards other sheep and less sensitive to pain. Nevertheless, these behavioural changes, indicating discomfort, are visibly clearer when sheep undergo acidosis for the first time. The main signs of discomfort, such as decrease in intake and increase in reactivity, disappear as acidosis episodes are repeated, and particularly in the yeast-supplemented group, whereas ruminal pH remains low. This suggests that sheep can adapt to repeated acidosis episodes, and that the main changes in feed intake during acidosis are not due solely to ruminal pH.
Introduction
Subacute ruminal acidosis (SARA) can appear when ruminants eat high-energy diets with a low fibre content. This disorder is frequent in cattle running at high production levels and has wide-reaching economic impacts. The cost of SARA due to milk production losses is estimated at 1.12 US$/day per cow (Stone, Reference Stone1999). Several studies have described the physiopathology of SARA (Nocek, Reference Nocek1997; Oetzel, Reference Oetzel2000; Krause and Oetzel, Reference Krause and Oetzel2006). SARA is defined as an intermittent and moderately depressed ruminal pH from about 5.5 to 5.0 following the intake of a concentrate-based diet (Krause and Oetzel, Reference Krause and Oetzel2006) when ruminal flora and ruminal mucosa are unadapted (Kleen et al., Reference Kleen, Hooijer, Rehage and Noordhuizen2003). These authors also pinpoint the consequences of SARA on animals: food intake declines and fibre is digested more slowly, with knock-on effects on production in terms of growth in beef cattle and milk yield in dairy cows. In addition, SARA can promote health disorders such as diarrhoea, laminitis, liver abscesses, increased bacterial endotoxin levels and inflammation characterized by increases in acute-phase proteins (Plaizier et al., Reference Plaizier, Krause, Gozho and Mcbride2008). These effects would suggest that SARA impacts animal welfare. However, welfare revolves around how animals perceive their environment or their condition (Duncan, Reference Duncan2002; Veissier and Boissy, Reference Veissier and Boissy2007), and it is unclear whether they perceive SARA. This can be investigated by looking at animal behaviour.
Recent studies show that cattle modify their behaviour during illness, as suggested by their reduced activity after an injection of lipopolysaccharides (Borderas et al., Reference Borderas, de Passille and Rushen2008), thus confirming field observations that sick animals are less active and apathetic. Furthermore, several studies have reported behavioural adjustments in animals during acidosis: Le Coustumier (Reference Le Coustumier1997) reported longer times spent standing awake in herds with SARA, whereas Redbo and Nordblad (Reference Redbo and Nordblad1997) found that cows deprived of roughage were more active (standing, social interactions, oral non-nutritive activities such as tongue rolling) than cows eating roughage. However, it is not clear whether these behavioural changes were prompted by SARA. In order to understand the links between behaviour and SARA, it is first necessary to concomitantly record behaviour and ruminal pH.
Although several acidosis challenge models have been tested (Nagaraja and Titgemeyer, Reference Nagaraja and Titgemeyer2007), there are very few indications of how animals react to repeated acidosis. Devries et al. (Reference DeVries, Dohme and Beauchemin2008) found that cows exposed to two 1-day acidosis challenges at a 14-day inter-challenge interval sort their food in favour of longer particles, especially during the second challenge, but no other behavioural measurements were performed. Behavioural adaptations may reduce the effects of diets carrying high acidosis risk. More observations on how animals react to repeated acidosis challenges are needed to test this assumption.
Other factors can also mitigate the negative effects of high-concentrate diets on ruminal pH (Jouany, Reference Jouany2006). Different strategies are used in practice, principally diet management but also chemical additives such as buffers. Another solution is to use probiotics as a preventive-SARA measure, even if the mechanisms of action are not totally understood. Experiments are needed to study the effects of yeast supplementation on repeated acidosis challenges.
The first objective of this study was to describe potential modifications of sheep behaviour (feed intake, time budget, reactivity) in response to SARA. The second objective was to determine whether sheep can adapt to repeated acidosis episodes, that is, whether behavioural modifications – if any – disappear when acidosis challenges are repeated, and whether this adaptation is different when sheep are supplemented with yeast.
This study was realized in collaboration with other research teams, particularly to study the effects of yeast supplementation and acidosis challenges on the ruminal microbial ecosystem (Silberberg et al., Reference Silberberg, Chaucheyras-Durand, Commun, Morgavi and Martin2008). The present paper only deals with effects on behaviour (feed intake, time budget, reactivity).
Materials and methods
The experiment was conducted at the INRA Herbivores Research Unit experimental facilities (Saint-Genes-Champanelle, France). L. Commun, the scientist in charge of this part of the experiment, is licensed to perform experiments on animals, and the protocol was approved by the regional ethics committee (approval number: CE 10-07).
Animals and experimental design
Twelve adult Texel wethers weighing 48.0 ± 4.3 kg were fitted with a 62-mm-bore polyamide-polyvinylchloride ruminal cannula (Synthesia, Nogent-sur-Marne, France) by an authorized surgeon under general anaesthesia (Halothane, ICIU Pharmavétérinaire, Paris, France) in a sterile environment. Surgery was performed 1 year before the study started, and sheep were fed with hay only so as to avoid acidosis during this time. During the trial, the sheep were housed in individual 1.0 × 1.5 m stalls.
As the same sheep were also involved to test the preventive effects of yeast on acidosis, six of the sheep received a daily supplementation of active dry yeast product Levucell®SC (Saccharomyces cerevisiae CNCM I-1077, Lallemand Animal Nutrition; 4 × 10⁹ CFU/day per animal in 9 ml of sterile water) from 28 days before and through to the end of the present experiment. The six other sheep (controls) received a placebo (9 ml of sterile water). Yeast and placebo were introduced into the rumen every morning, through the cannula. Spontaneous dry matter intake (DMI) of hay was measured for all the animals during 3 days just before the beginning of the experiment.
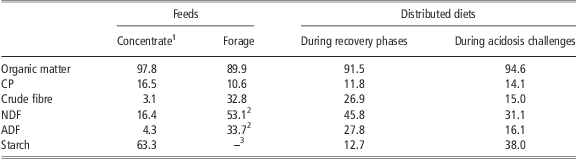
The mangers were separated into two compartments, one offering pelleted ground wheat (3-mm screen) and the other offering chopped orchard grass hay (Dactylis glomerata, second cutting). Chemical composition of the feeds and diets is given in Table 1. Organic matter content of hay was determined by ashing samples at 550°C for 6 h (Association of Official Analytical Chemists (AOAC), 1990). Crude fibre was determined using the Wende method (AOAC, 1990). Both NDF and ADF contents were determined by sequential procedures (Van Soest et al., Reference Van Soest, Robertson and Lewis1991) after pre-treatment with amylase. CP was determined using the Kjeldahl method (AOAC, 1990), and starch was determined using a polarimetric method (AFNOR, 1985). The chemical composition of the ground wheat was not assessed but was estimated from INRA tables using the ingredient CC040 (INRA, 2007b).
Chemical composition of the feeds and diets
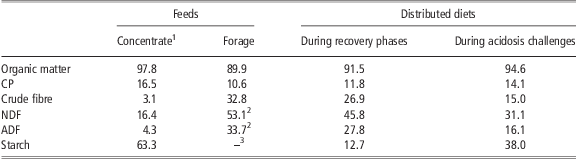
Recovery: 23-day recovery phase (concentrate : forage, 20 : 80).
Acidosis: 5-day acidosis challenge (concentrate : forage, 60 : 40).
1The values given are for wheat concentrate number cc040 adapted from INRA tables (INRA, 2007b), with concentrate comprising 94% cc040 wheat + 2% treacle (a sugar syrup) + 2% CaCO3 + 2% of a mineral–vitamin mix (ref. BO4505, AGRO 01, Bourg-en-Bresse, France).
2Calculated from crude fibre according to INRA equations (2007a).
3Not determined.
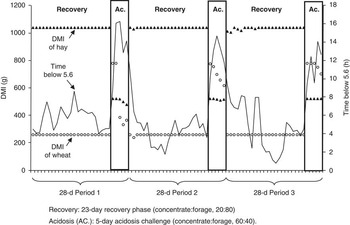
The sheep were exposed to three successive 28-day experimental periods comprising a 23-day recovery phase based on a low-energy diet (20 : 80 of concentrate : forage) followed by a 5-day acidosis challenge with a high-energy diet (60 : 40 of concentrate : forage; Figure 1). In order to limit refusals, the two diets provided dry matter (DM) equal to 90% of the spontaneous DMI of hay measured before the experiment started. Thus, we distributed 1300 g of food per sheep and per day. During recovery, feeds were offered in two distributions with 65% of DM at 0800 h and 35% at 1600 h. During acidosis challenges, hay was offered in three distributions: 20%, 30% and 50% at 0800, 1000 and 1600 h, respectively, whereas 100% concentrate was distributed in one go at 1000 h. This protocol was used to induce SARA during acidosis challenges (concentrate distributed in one go) without inducing clinical acidosis (20% of hay distributed first). Concentrate refusals were removed at 1600 h to prevent critical acidosis and allow the sheep to recover overnight.
Experimental design. Twelve sheep were studied: six received a daily supplementation of live yeast, whereas the other six received a placebo. DM = dry matter.

Sheep were given free access to water (in a 10-l bucket, water changed daily) and salt licks (Na, 39.3%; Cl, 60.7%).
Ruminal pH kinetics
To check that acidosis challenges effectively induced SARA, we fitted each sheep with an in-rumen pH probe (Fisher Bioblock Scientific, Illkirch, France) as described in Brossard et al. (Reference Brossard, Martin and Michalet-Doreau2003). The probe was connected to a datalogger (EL-2, Lascar Electronics Ltd, Salisbury, UK), which recorded pH at 5-min intervals for all sheep throughout the experiment. Data were collected weekly by connecting each logger to a PC running El-Win software (Lascar Electronics Ltd). For the purposes of the present paper, we only consider the average daily pH and time spent with a pH below 5.6, that is, the threshold generally used to diagnose SARA (Keunen et al., Reference Keunen, Plaizier, Kyriazakis, Duffield, Widowski, Lindinger and and McBride2002).
Feed intake
During recovery phases, daily refusals of forage and concentrate were weighed every day at 0800 h (i.e. before feeding) for both feeds. During acidosis challenges, refusals were weighed at 0800, 1000, 1200, 1400 and 1600 h for both forage and concentrate, concentrate refusals – if any – were removed at 1600 h (see earlier), hay refusals were removed and weighed the following morning at 0800 h.
The buckets of water were weighed daily at 0800 h to measure 24-h water consumption.
Salt licks were weighed once a week (i.e. every 7 days).
Time budget and reactivity
The time budget was taken from a 24-h video recording once during each recovery phase (day 20) and each acidosis challenge (day 27), as illustrated in Figure 1. The sheep were also subjected to four behavioural tests: one involving social mixing, one involving nociception (laser test), and two involving suddenness (horn test and umbrella test). These four tests were performed once during each recovery phase (day 18 or 19) and once during each acidosis challenge (day 25 or 26). Animals react differently to novel v. familiar situations (Desire et al., Reference Desire, Veissier, Despres and Boissy2004). To avoid confusion between time effects (where a novel situation becomes familiar when it is repeated) and diet effects and their repetitions, the sheep were subjected to all behavioural tests three times during the 2 weeks preceding the experimental recovery and acidosis challenge treatments. Therefore, all tests were familiar to the sheep at the time they underwent the experimental treatments.
Recordings for time budget and the behavioural tests were never performed on the same days.
Time budget
Six cameras were dispatched in the experimental shed in order to film all the sheep at the same time (i.e. two stalls filmed by each camera). A 30-s sequence at the beginning of each 5-min interval was analysed using The Observer XT and The Observer Video Analysis software (Noldus, Wageningen, The Netherlands). The following states were registered: standing inactive, standing awake, walking, lying, drinking, eating and licking salt. Sheep were considered as standing awake when they were in an immobile position with head and ears pointed upwards, as in Greiveldinger et al. (Reference Greiveldinger, Veissier and Boissy2009), whereas standing inactive corresponded to an immobile position with head and ears pointed downwards.
Social mixing test
The social mixing test was performed on days 18 and 25 of each 28-day period. This test consisted in mixing two experimental sheep for 5 min in a 2.0 × 1.5 m stall. The sheep were unknown to each other. Six pairs of sheep were penned together during each test day. To avoid human presence, the test was video-recorded and later analysed using The Observer XT and The Observer Video Analysis software (Noldus). The following behaviour patterns were recorded as events: threat (without physical contact), knock (reciprocal or unilateral), wrestling (and its length), approach and sniff (smelling with muzzle in contact with the other sheep). The proportion of threats over all activities was then calculated.
Horn test
On days 18 and 25 of each 28-day period, the video system-recording sheep in their home pens was started 10 min before the distribution of concentrate (i.e. at 0750 h during recovery phases and 0950 h during acidosis challenges). Just after the concentrate distribution, when all animals were eating, a brief and intense sound was delivered by a hidden experimenter using a horn (1 s burst at 115 decibels). Video system recording made it possible to describe sheep reactions without direct observation so as to avoid human bias. Two minutes after the noise, the video recording was switched off. Behavioural reaction of each sheep was analysed as ‘no reaction’ or ‘sheep stopped eating’, in which case time to resume eating was recorded within a 90 s limit.
Umbrella test
On days 19 and 26 of each 28-day period, the umbrella test was performed during the concentrate distribution (i.e. at 0800 h during recovery phases and 1000 h during acidosis challenges). With access to the troughs blocked by wooden panels, hay and wheat were then delivered. A closed red umbrella was put in front of a trough and then the corresponding wooden panel was removed. The test measured the time taken by the sheep to put its nose over the trough. When the sheep had eaten for 10 s, the umbrella was opened and the behavioural reaction was recorded as for the horn test. Time to resume eating was also recorded within the 90 s limit.
Laser test
A CO2 laser was used to investigate nociceptive thresholds as described by Veissier et al. (Reference Veissier, Rushen, Colwell and de Passille2000), except that the beam was aimed at the flank of the animal. The CO2 laser test was performed outside feeding times, at around 1130 h on days 19 and 26 of each 28-day period. The day before the test, the flanks of the sheep were shaved. During the test, the laser apparatus was placed at 1.5 m from a sheep and its power was set at 2 W. The laser was applied on the flank, above the ilium, until a muscular twitch was observed. The test was repeated four times successively on each sheep at 10 s intervals, always on the same side. The side where the stimulus was performed depended on the orientation of the sheep during the test. The average between the four response latencies was then taken for statistical analyses.
Data analysis
The experimental design included three successive 28-day periods each composed of a 23-day recovery phase and a 5-day acidosis challenge. However, to compare recovery and acidosis challenges, we only used data from the last 5 days of the recovery phases and all 5 days of the acidosis challenges.
The following summary variables were calculated per sheep and per day during the last 5 days of recovery phases and the 5-day acidosis challenges of all three periods: DMI of wheat and DMI of hay, average ruminal pH (using values obtained every 5 min), time spent with a pH below 5.6, water intake. For salt intake, the available data comprised a cumulated intake per sheep and per week throughout the experiment. Using the video recordings, total time spent in a given activity and the number and the bout duration of each activity were estimated once during each recovery phase and each acidosis challenge.
Statistical analyses were performed using the PROC MIXED procedure of SAS for repeated measures (Littell et al., Reference Littell, Henry and Ammerman1998). Effects were considered significant at P < 0.05. Animal was considered as a random effect for all the statistical analyses.
A first model was built for testing the differences between recovery and challenge phases during the three periods, with or without yeast supplementation, for the following variables: salt and water consumption, average daily pH and time spent with a pH below 5.6, results of behavioural tests and time budget data. The following fixed effects were included in the model: diet (recovery v. acidosis), period (1, 2 or 3), yeast (yeast v. control), all 2-way interactions and the 3-way interaction. The interaction between diet and period was considered as a repeated measure, and the subject was the sheep. A component symmetry covariance structure was chosen as it yielded the lowest Akaike information criterion (Akaike, Reference Akaike1974).
To test whether differences between successive days within challenges were equivalent among the three challenges, a second model was applied to wheat, hay and water intake and to time spent with a pH below 5.6. The following fixed effects were included in the model: period (1, 2 or 3), yeast (yeast v. control), day (1, 2, 3, 4 or 5), all 2-way interactions and the 3-way interaction. The interaction between day and period was considered as a repeated measure, and the subject was the sheep. A first-order autoregressive covariance structure was chosen as it yielded the lowest Akaike information criterion (Akaike, Reference Akaike1974). Differences were analysed using the least squares means method with a Bonferroni adjustment.
Results
None of the sheep showed any visually apparent signs of illness during the experiment. Figure 2 shows evolution of feed intake and of time spent below pH 5.6 for the two groups (a group with yeast-supplemented sheep and a placebo group) throughout the experiment. During recovery phases, sheep ate all the distributed feeds, whereas during acidosis challenges, there were within-day variations in intake. Consequently, statistical analysis on intake was only performed on data from acidosis challenges. Conversely, as variations in ruminal pH were observed regardless of the diet and the period, statistical analysis was performed on ruminal pH data for the three periods to compare recovery phases and acidosis challenges.
Daily intake (o o, dry matter intake (DMI) concentrate; ▴ ▴, DMI forage) and ruminal pH (—, time spent below pH 5.6) in sheep receiving concentrate and forage over three periods (n = 12).

Ruminal pH
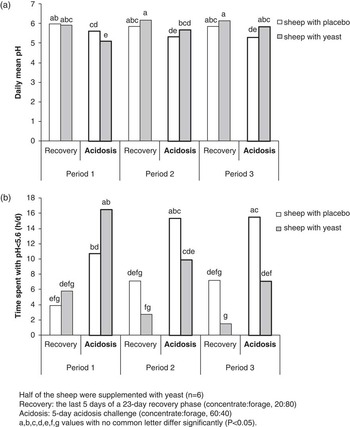
The effects of diet, period and yeast supplementation on ruminal pH are summarized in Table 2. Significant 3-way interactions are illustrated in Figure 3. The daily time spent with a ruminal pH under 5.6 was significantly higher during acidosis challenges than during the last 5 days of recovery phases (12.5 v. 4.7 ± 0.7 h/day, P < 0.001), regardless of the period (Figure 3b). With regard to the effect of yeast supplementation, no difference was found during the first two periods between placebo and yeast group regardless of the diet, but during the third acidosis challenge the yeast group spent less time (below 5.6) than the placebo group (P < 0.001).
Ruminal pH, water consumption and salt consumption of sheep receiving concentrate and forage over three periods combining recovery and acidosis phases (n = 12)

Half of the sheep were supplemented with yeast (n = 6).
Recovery: the last 5 days of a 23-day recovery phase (concentrate : forage, 20 : 80).
Acidosis: 5-day acidosis challenge (concentrate : forage, 60 : 40).
Within rows, values with no common letter differ significantly (P < 0.05).
1P-value <0.05 are in bold and significant 3-way interactions are illustrated in Figures 3a and b.
(a and b) Ruminal pH (daily mean pH and time spent below pH 5.6, respectively) in sheep receiving concentrate and forage over three periods (n = 12).

Consumption of water and salt (Table 2)
Sheep drank more during acidosis challenges than during recovery (3.87 v. 3.27 ± 0.14 l/day, for challenges and recovery phases, respectively, P < 0.001). Water consumption increased as periods were repeated (3.17, 3.55, 3.99 ± 0.15 l/day for periods 1, 2 and 3 respectively, P < 0.001) without diet-related differences between the supplemented and control sheep (P > 0.05), regardless of the period.
Sheep consumed more salt during acidosis challenges than during recovery phases (16 v. 11 ± 4 g/day, P < 0.001), and difference between diets was more marked for the placebo group than the yeast group (period × yeast, P < 0.01; Table 3).
DMI of wheat and hay of sheep during the three acidosis challenges: the table presents the effects of day of the challenge, period and yeast supplementation (n = 12)

DMI = dry matter intake.
Half of the sheep were supplemented with yeast (n = 6).
Acidosis: 5-day acidosis challenge (concentrate : forage, 60 : 40).
1P-value <0.05 are in bold and significant 2-way interactions are illustrated in Figures 4a and b.
Feed intake
During recovery phases, sheep ate all the distributed feeds (Figure 2), that is, 260 g wheat and 1040 g hay. During acidosis challenges, a certain amount of refusals were recorded, and the sheep ate 662 g of wheat and 514 g of hay, that is, a wheat : hay ratio of 56 : 44. Because the variance of feed intake was null under recovery phases, no statistical analyses were performed on these data under recovery phases.
Concerning hay consumption during acidosis challenges, no difference was found among days, among periods or between animals supplemented or not with yeast (P > 0.05).
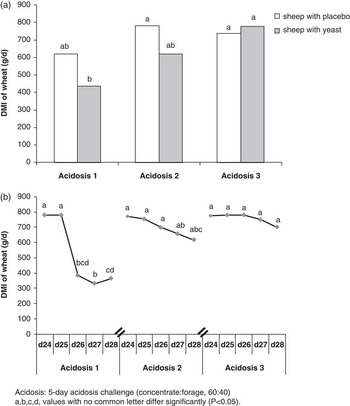
Concerning total quantity of wheat consumed during the challenges, no difference was found between the three periods for the placebo group, whereas the yeast-supplemented group consumed less wheat during the first challenge than the third challenge (Figure 4a). Day-on-day wheat consumption during the first challenge (Figure 4b) fell between days 25 and 26 and remained low during the last 3 days of the challenge, regardless of the group (placebo or yeast-supplemented). However, we found no similar decrease in wheat consumption for the last two challenges.
Dry matter intake of wheat intake by sheep during the three acidosis challenges (a) data with or without yeast supplementation presented separately; n = 6 in each group, and within each acidosis challenge (b) data with or without yeast supplementation pooled together; n = 12.

Time budget and reactivity
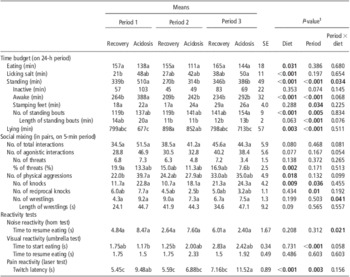
Yeast supplementation had no effect on behaviours apart from feed intake. Table 4 summarizes the effects of diet and period on time budget and sheep reactivity.
Daily activity and reactivity of sheep receiving concentrate and forage over three periods combining recovery and acidosis phases (n = 12)

Half of the sheep were supplemented with yeast (n = 6), but as yeast effect was not significant, it is not presented.
Recovery: 23-day recovery phase (concentrate : forage, 20 : 80).
Acidosis: 5-day acidosis challenge (concentrate : forage, 60 : 40).
Within rows, values with no common letter differ significantly (P < 0.05).
1P-value <0.05 are in bold.
Time budget
Sheep spent less time eating during acidosis challenges than during recovery phases (131 v. 159 ± 12 min/day, P < 0.05). Sheep also spent more time licking salt during acidosis challenges than during recovery phases (47.8 v. 28.2 ± 8.7 min/day, respectively, P < 0.001).
During acidosis challenges, sheep spent significantly more time standing than during recovery phases, particularly in period 1 (period × diet, P < 0.05). During challenges, sheep spent more time standing awake (307 v. 235 ± 27 min/day, P < 0.001). They also stood up more often (28.7 v. 25.3 ± 1.5 standing bouts/day, P < 0.001). Sheep spent less time lying under acidosis challenges than during recovery phases (747 v. 831 ± 50 min/day, P < 0.01).
Social mixing test
During the social mixing test, number of interactions tended to be higher under acidosis challenges than during recovery phases (45.7 v. 39.6 ± 4.8 interactions/5-min test, P = 0.08), and physical aggressions were more frequent (34.2 v. 26.4 ± 3.7 physical aggressions/5-min test, P < 0.05), especially knocks (21.8 v. 14.6 ± 3.3 knocks/5-min test, P < 0.01), whereas the proportion of threats out of all aggressions decreased (10.7 v. 17.3 ± 1.5% of threats/5-min test, P < 0.01).
Horn test
Over the full observations dataset, as only one sheep gave no reaction during this test 1 day, we elected not to analyse the reaction of sheep when the noise appeared but to analyse the time to return eating after the horn sound. This time was longer during acidosis challenges than during recovery phases in periods 1 and 2 but shorter in period 3 (diet × period, P < 0.05).
Umbrella test
The umbrella test showed no between-diet differences. Time to resume eating increased with period (P < 0.001).
Laser test
During the laser test, the sheep reacted more slowly under acidosis challenges than during recovery phases (9.30 v. 6.07 ± 0.55 s, P < 0.001).
Discussion
This study analysed the reactions of sheep to short episodes (5 days) of a high-concentrate diet called acidosis challenge (60 : 40 of concentrate : forage ratio) separated by a 23-day low-concentrate diet interval called recovery phase (20 : 80). The DM offered in both diets was equal to 90% of the spontaneous DMI of hay recorded in the pre-experimental period, in order to limit orts. During acidosis challenges, ruminal pH was lower than under recovery phases, and the sheep did not eat all the concentrate offered, drunk more water, ingested more salt, spent more time standing (especially standing awake), were more aggressive towards each other and reacted less to a hot stimulus (CO2 laser beam). In general, these differences between recovery phases and acidosis challenges were more marked during the first acidosis challenge than during the second and third challenges. The only effect of yeast supplementation was on ruminal pH. We recorded a lower ruminal pH in the supplemented group than in the placebo group during the first challenge, but the pattern reversed during the last challenge, with a higher ruminal pH in the supplemented group.
To define acidosis, several authors base their interpretation on ruminal pH kinetics and large daily fluctuations (Dijkstra et al., Reference Dijkstra, Boer, Van Bruchem, Bruining and Tamminga1993; Sauvant et al., Reference Sauvant, Meschy and Mertens1999; Dragomir et al., Reference Dragomir, Sauvant, Peyraud, Giger-Reverdin and Michalet-Doreau2008). A pH threshold can be defined to calculate the time spent under pH 5.6 or the area under this threshold (on a time/pH graph), but the threshold chosen to interpret acidosis level varies between authors. We opted for a ruminal pH of 5.6 as the cut-off point for SARA, as in Keunen et al. (Reference Keunen, Plaizier, Kyriazakis, Duffield, Widowski, Lindinger and and McBride2002).
Our experimental design aimed to induce repeated acidosis challenges separated by recovery phases in sheep. During recovery phases, the sheep ate all the feeds provided, inducing a true 20 : 80 of concentrate : forage ratio intake, whereas during acidosis challenges, concentrate : forage ratio intake was 56 : 44, that is, close to the 60 : 40 ratio distributed. In these conditions, sheep spent on average threefold longer time below pH 5.6 during challenges than during recovery phases. Thus, the high-concentrate diet induced acidosis, confirming the pertinence of the proportion of concentrate offered to sheep and the fractionation of daily feed allotment in inducing this nutritional disorder. The 5-day periods with this 60 : 40 diet can thus be confirmed as acidosis challenges and the 23-day periods with the 20 : 80 diet as recovery phases.
Sheep spent less time eating during challenges than during recovery phases. This difference results first from a lower food intake under acidosis and second from a higher concentrate : forage intake ratio. Indeed, during the acidosis challenges, the sheep ate wheat and hay in a proportion of 56 : 44 v. 20 : 80 during recovery, and it is known that as percentage of concentrate eaten increases, intake rate also increases (Jarrige et al., Reference Jarrige, Dulphy, Faverdin, Baumont and Demarquilly1995). Dividing DMI by the time spent eating makes it clear that the sheep studied ate more quickly under the acidosis challenges (8.97 v. 8.16 g/min). Thus, rather than the acidosis status of the animals, it is diet composition that affects the time sheep spend eating, with diets carrying a high risk of acidosis (because of a high wheat content) leading to quicker intake.
The sheep spent more time drinking and drank more water during acidosis challenges than during recovery phases. This confirms earlier findings by Cottee et al. (Reference Cottee, Kyriazakis, Widowski, Lindinger, Cant, Duffield, Osborne and McBride2004) who reported that water intake increases (P < 0.01) during acidosis. A higher water consumption is likely to limit the decrease in ruminal pH by a dilution effect (Forbes, Reference Forbes1968). In our experiment, the increase in water consumption became more marked as acidosis challenges were repeated. However, the drop in pH during acidosis challenges did not change with repetitions, making it is unlikely that ruminal pH triggered the increased water consumption. Further, wheat intake increases ruminal osmolality (Carter and Grovum, Reference Carter and Grovum1990; Desnoyers et al., Reference Desnoyers, Duvaux-Ponter, Rigalma, Roussel, Martin and Giger-Reverdin2008), as well as rumen fluid viscosity (Martin et al., Reference Martin, Fernandez, Rochette and Michalet-Doreau2000), and water intake can reverse this phenomenon (Langhans et al., Reference Langhans, Rossi and Scharrer1995). Hence, the provision of high amounts of wheat during acidosis challenges may have stimulated drinking, with a more marked effect when acidosis challenges were repeated, probably as the sheep increased their wheat intake (nearly no refusals during the third challenge).
Sheep may also have drunk more water because they consumed more salt rather than because they ate more wheat. Under acidosis challenges, the sheep spent more time licking salt and consumed more of it. This may be related to a need for NaCl or licking (regardless of the format). Phy and Provenza (Reference Phy and Provenza1998) placed salt (NaCl) in water and observed that sheep drank 1.4 times more salty water when they were fed a high-wheat diet (1300 g of wheat) compared with a low-wheat diet (300 g of wheat). This suggests that sheep look for NaCl itself, independently of licking activity. However, licking can also appease acidosis via a higher production of salivary bicarbonate (Church, Reference Church and Pond1988).
Despite less time spent eating, the sheep spent less time lying and more time standing in the acidosis challenges. Higher activity levels have been reported in goats subjected to high-wheat diets (Desnoyers et al., Reference Desnoyers, Duvaux-Ponter, Rigalma, Roussel, Martin and Giger-Reverdin2008), with some of the high-wheat-diet goats showing highly nervous behaviour, searching for straw, salt or something else to eat. This overactivity might be a sign of discomfort or pain (Sawyer, Reference Sawyer1998). Our sheep spent more time standing awake, that is, with head up and ears pricked up, under the acidosis challenges. This posture pattern has been reported in circumstances where sheep were exposed to aversive events (Greiveldinger et al., Reference Greiveldinger, Veissier and Boissy2009). In addition, sheep stood up more often under acidosis challenges, suggesting some agitation (Veissier and Le Neindre, Reference Veissier and Le Neindre1989). These behavioural modifications suggest that the sheep experienced discomfort under the acidosis challenges.
During acidosis challenges, sheep were less reactive to the heat produced by the CO2 laser beam. A lower sensitivity to pain based on CO2 laser measurements has been reported under acute stress (Rushen and Ladewig, Reference Rushen and Ladewig1991), whereas a higher sensitivity to pain has been observed under chronic stress (Gamaro et al., Reference Gamaro, Xavier, Denardin, Pilger, Ely, Ferreira and Dalmaz1998) or chronic pain (Ley et al., Reference Ley, Livingston and Waterman1989). In addition, rumen inflammation is reported during acidosis (Krause and Oetzel, Reference Krause and Oetzel2006), which could induce an acute phase of inflammatory response. In our study, the laser test was performed 2 days after the onset of acidosis challenge. This day was also marked by a significant decrease in wheat intake, particularly in the first challenge, which might signal digestive discomfort and an acute phase response. These physiological changes during challenges could explain the lesser reactivity observed here with the laser test.
The differences between recovery phases and challenges in ruminal pH, behaviour and intake obviously indicated real acidosis times during challenges, accompanied by numerous modifications in sheep physiology, but all these modifications were particularly marked in the first acidosis challenge compared with the two following challenges. The first abrupt modification in diet (composition and distribution) from a recovery time to the first acidosis challenge without any transition period induced severe acidosis characterized first by low ruminal pH values and second by a severe drop in wheat consumption. Indeed, during this first challenge, the sheep ate all the concentrate offered for the first 2 days of this challenge and then refused half of it during the next 3 days. Kyriazakis et al. (Reference Kyriazakis, Tolkamp and Emmans1999) suggested that animals adjust their dietary selection in response to a significant physiological change, which in our case could be an altered rumen state. Nevertheless, the decrease in wheat consumption over the following days did not allow a significant increase in ruminal pH at the end of challenge 1. This persistence in acidosis status appears to result from drastic modifications in the rumen microbial ecosystem. As reported by Silberberg et al. (Reference Silberberg, Chaucheyras-Durand, Commun, Morgavi and Martin2008) on the same sheep, acidosis involved a decrease in concentrations of protozoa and cellulolytic bacteria and a selection of lactate-producing bacteria; thus, the beginning of this challenge was associated with an accumulation of lactate in the rumen, inducing a large drop in ruminal pH owing to the low pKa of lactate (3.9; Martin et al., Reference Martin, Brossard and Doreau2006). At the same time, during this first challenge, sheep expressed an abnormal level of aggressiveness, with more physical aggression towards a partner and more time spent standing awake than during the first recovery period. Thus, from the pH and feeding perspective, both microbiologically and behaviourally, the first challenge was highly traumatic for the animals.
However, as the sheep were subjected to further challenges, they subsequently expressed fewer signs of discomfort. This is true for standing and feeding behaviour, as well as the aggressiveness dimension. The difference in time spent standing between each recovery phase and the following acidosis challenge decreased as challenges were repeated (+50% during challenge 1 and only +16% and +12% during challenges 2 and 3), without correlations to the time spent eating. During the second challenge, the decrease in wheat consumption was less marked and more progressive than during the first challenge, but without becoming significant. During the third challenge, sheep ate almost all the wheat; orts were insignificant. At the same time, for periods 2 and 3, aggressiveness level, gauged by the number of physical aggressions when two unfamiliar sheep were mixed (social test), was not different between recovery times and challenges (contrary to period 1), which further suggests specific effects of the first challenge and above all that the sheep were able to adapt to challenges as they were repeated.
Even if feeding and general sheep behaviour indicated an increasing adaptation to acidosis challenges, ruminal pH values during these challenges always remained low, including during the third challenge. During this third challenge, the low pH values recorded still corresponded to an acidosis situation, but no manifestations of discomfort were recorded and we even observed a high motivation to eat wheat. Given our results and experimental design, it is concluded that the sheep were able to adapt to the high-concentrate diet. It therefore follows that ruminal pH is probably not the only signal inducing regulation of feed intake during acidosis (Plaizier et al., Reference Plaizier, Krause, Gozho and Mcbride2008).
A recent experiment studied the effects of three repeated acidosis challenges on eight dairy cows fed with total mixed ration (TMR; DeVries et al., Reference DeVries, Dohme and Beauchemin2008; Dohme et al., Reference Dohme, DeVries and and Beauchemin2008). The cows had a high or low risk for experiencing acidosis because of their diet and stage of lactation. Before each challenge, the previous day consisted in restricted feeding (to 50% of the ad libitum intake). Acidosis challenges consisted in a 1 h meal of 4 kg of ground barley–wheat before allocating the TMR. Challenges were separated by 14 days. Evolution of ruminal pH (Dohme et al., Reference Dohme, DeVries and and Beauchemin2008) and feed sorting (DeVries et al., Reference DeVries, Dohme and Beauchemin2008) were recorded. Over the course of the experiment, ruminal pH and grain intake decreased more and more with each acidosis challenge. Thus, in contrast to our experiment, the severity of SARA increased with each challenge in this study. We found opposite results, with sheep adapting as challenges were repeated. This divergence can be explained by broad differences between the two experimental designs. In the study on cows, there was a restricted feed day just before the acidosis challenges, and then 4 kg of grain was distributed alone for 1 h. Thus, as the cows were relatively food-deprived, they pounced on grain and experienced severe acidosis without stopping to regulate fibre intake. In our study on sheep, during the acidosis challenges, we distributed concentrate after a small meal of forage to avoid clinical acidosis, and without prior feed deprivation. This availability of forage around challenges was important, as ruminants readjust their intake to minimize the effects of acidosis. Moreover, even in this reported study where intake readjustments were limited by the fact that TMR was distributed, DeVries et al. (Reference DeVries, Dohme and Beauchemin2008) reported that sorting behaviour was greater when ruminal pH was lower, that is, cows increased sorting for the longer particles during severe acidosis. A second difference between this study and ours was that our challenges lasted 5 days and not 1 h. Maybe acidosis-tolerant microbes could be selected for 5 days, especially given the repetition of this situation, but not for 1 h, even if the challenges are repeated. Finally, the recovery time lasted 23 days in our design, compared with just 14 days between challenges in the study on cows. Two weeks is maybe too short to expect an adjustment of the ruminal ecosystem before a new acidosis challenge. Thus, ruminants experiencing repeated acidosis challenges appear to demonstrate two opposing patterns: either a worsening, as in this reported study, or an adaptation as was found in our experiment. The modalities of the challenges, in particular possible starvation before the challenge, duration of the challenge or interval between two following challenges, seem to be decisive in determining whether adaptation is or is not possible.
Our experimental plan also included six sheep that were yeast-supplemented throughout the experiment. This paper is focused solely on behavioural adaptations of sheep to repeated acidosis challenges, and no effect of yeast was observed on behavioural aspects. However, yeast effects could be explored in the context of the relationship between ruminal pH and behavioural modifications, and we did find some effects of supplementation on pH, but without effects on behaviour. In the control group, ruminal pH was not modified by repeated challenges and was always low during challenges (i.e. time spent below pH 5.6 stayed high). In contrast, yeast-supplemented sheep were more affected by the first challenge than by subsequent challenges, resulting in lower ruminal pH values compared with controls during this first challenge. At the same time, the decrease in wheat consumption seemed to be more marked in yeast-supplemented sheep than controls during this first acidosis challenge, whereas the opposite pattern was observed during the third challenge where higher ruminal pH values were recorded in yeast-supplemented sheep than non-supplemented sheep. During this third challenge, despite the fact that yeast-supplemented sheep consumed all the concentrate offered, they spent the same time below 5.6 as non-supplemented sheep during the previous recovery phase. These differences between the two groups suggest two things: first, considering only ruminal pH values, yeast-supplemented sheep showed a lower tolerance during the first challenge but a better adaptation from the third challenge; second, during the third challenge, the two groups (supplemented and not) ate all the offered concentrate, without orts, without difference in feeding or general behaviour, and more generally without expression of acidosis symptoms, regardless of the group, and yet during this third challenge non-supplemented sheep still spent twofold longer time under pH 5.6 than supplemented sheep. This last observation bears out the idea that sheep appetite is not directly dependent on ruminal pH.
In conclusion, when sheep are submitted to 5-day episodes of a high-concentrate diet (60 : 40 of concentrate : forage ratio), their ruminal pH drops to low values characteristic of SARA. A high dietary proportion of concentrate induces behavioural changes, such as the increased frequency of alarm postures (head and ears pricked up) and the slow response to a hot stimulus on the flank skin, suggesting some discomfort probably related to low ruminal pH. Sheep exposed to acidosis challenge also reduce their food intake, are more active, and more aggressive towards each other. These modifications fade when challenges are repeated, suggesting an adaptation process. The adaptation could be explained partly via a selection process involving acidosis-resistant microbes during acidosis challenges, leading to a better digestion of feeds. The adaptation has to involve not only the microbial population but also animal physiology (hormones, enzymes, etc.) in order to metabolize, eliminate and handle the acid overload. Feeding behaviour in terms of distribution of feed intake throughout the day also has to go through an adaptation. However, even though we concluded on an adaptation, ruminal pH under acidosis remained low. This suggests that the changes in feed intake during SARA are not related solely to ruminal pH. Similarly, comparison between the two groups (yeast-supplemented v. non-supplemented sheep) also confirms doubts over a direct relationship between ruminal pH and discomfort in response to the onset of SARA: even when ruminal pH values were different between the two groups, their same general and feeding behaviour remained the same. We conclude that SARA-induced discomfort is not directly linked to low ruminal pH values.
Acknowledgements
The authors thank Lallemand® for providing the yeasts. They are also grateful to the staff at the INRA URH experimental facilities (particularly Michel Fabre and Sébastien Alcouffe) for taking care of the animals and measuring the feed intake, and to Eric Delval for his logistics support on the reactivity testing and video analysis.