1. Introduction
Secondary atomisation is a phenomenon where a primary droplet formed during bulk liquid atomisation is further fragmented into multiple secondary droplets due to disruptive forces, such as aerodynamic and shear forces. Disruptive forces aim to disintegrate the droplet while surface tension, viscosity and elasticity (if present) resist fragmentation. If the disruptive forces overcome the restoring forces, the droplet deforms and an imbalance between the two forces can lead to secondary atomisation. This process is significant in both natural and industrial operations, including the formation of raindrops (Villermaux & Bossa Reference Villermaux and Bossa2009) and various industrial applications such as fuel atomisation in combustion engines, spray drying and pesticide spraying (Rajamanickam & Basu Reference Rajamanickam and Basu2017; Mondal et al. Reference Mondal, Das, Sen, Satapathy and Basavaraj2019; Odenthal et al. Reference Odenthal, Vogl, Brune, Apell, Roisman and Tropea2021; Sharma, Singh & Basu Reference Sharma, Singh and Basu2021b). As a result, extensive experimental and numerical works are carried out to uncover the complicated mechanisms and identify the different parameters governing the interaction phenomenon.
Here, we study the aerobreakup of a droplet through a shock droplet interaction mechanism. The shock drop interaction process consists of two stages: the initial shock interaction (stage I) and droplet breakup dynamics (stage II, occurring at later times) (Sharma et al. Reference Sharma, Singh, Rao, Kumar and Basu2021c). Many experimental and numerical studies have investigated the droplet breakup dynamics using the shock tube method. However, limited research has been conducted to show the marginal significance of the early wave dynamics in the breakup analysis (Tanno et al. Reference Tanno, Itoh, Saito, Abe and Takayama2003; Sun et al. Reference Sun, Saito, Takayama and Tanno2005; Sharma et al. Reference Sharma, Singh, Rao, Kumar and Basu2021c; Meng & Colonius Reference Meng and Colonius2015; Sembian et al. Reference Sembian, Liverts, Tillmark and Apazidis2016). Post interaction with a shock wave, a shock-induced gas flow interacts with the liquid droplet, which majorly governs the atomisation dynamics (Sharma et al. Reference Sharma, Singh, Rao, Kumar and Basu2021c). According to Hinze (Reference Hinze1955), the breakup mode of a droplet is dependent on the Weber number  $(We= {\rho _gV_i^2D_o}/{\sigma })$ and Ohnesorge number
 $(Oh={\mu _l}/{\sqrt {\rho _l \sigma D_o}})$, which was further extended by Krzeczkowski (Reference Krzeczkowski1980) to identify the transition points on the
 $We-Oh$ regime. Here,
 $\mu _l$ and
 $\rho _l$ are the dynamic viscosity and density of the droplet,
 $\sigma$ is the surface tension of the gas–liquid interface,
 $D_o$ is the initial droplet diameter before shock interaction,
 $\rho _g$ and
 $V_i$ are the density and velocity of gas flow at post-shock conditions. The Weber number accounts for the relative dominance of aerodynamic/inertial force to the surface tension force, while the Ohnesorge number accommodates the effect of liquid viscosity on breakup dynamics. The fragmentation modes and corresponding breakup transition criteria have been consolidated by numerous reviews (Pilch & Erdman Reference Pilch and Erdman1987; Guildenbecher, López-Rivera & Sojka Reference Guildenbecher, López-Rivera and Sojka2009; Theofanous Reference Theofanous2011; Sharma et al. Reference Sharma, Chandra, Basu and Kumar2022). Based on different flow Weber number values, primarily five modes of aerodynamic breakup of a droplet have been obtained for
 $Oh<0.1$, i.e. bag breakup (
 $24>We>11$), bag-stamen/plume breakup (
 $65>We>24$), multi-bag breakup (
 $85>We>65$), sheet thinning/stripping breakup (
 $350>We>85$) and catastrophic breakup (
 $We>350$) (Guildenbecher et al. Reference Guildenbecher, López-Rivera and Sojka2009; Jain et al. Reference Jain, Surya Prakash, Tomar and Ravikrishna2015). Based on hydrodynamics instabilities responsible for such breakups, Theofanous & Li (Reference Theofanous and Li2008) and Theofanous et al. (Reference Theofanous, Mitkin, Ng, Chang, Deng and Sushchikh2012) reclassified these breakup modes. For
 $We<100$, the previously identified bag, bag-stamen and multi-bag breakup modes were consolidated as the Rayleigh–Taylor piercing (RTP) mode (based on the Rayleigh–Taylor instability). Similarly, at higher Weber numbers
 $(We>1000)$, the previously identified sheet thinning/stripping and catastrophic modes were consolidated as the shear-induced entrainment (SIE) mode (based on the Kelvin–Helmholtz (KH) instability). The present work uses the same description for the two modes. Notably, the absence of Rayleigh–Taylor surface instability at high
 $We \sim O(1000)$ is debatable in literature (Joseph, Belanger & Beavers Reference Joseph, Belanger and Beavers1999; Chandra et al. Reference Chandra, Sharma, Basu and Kumar2023; Mansoor & George Reference Mansoor and George2023).
The literature on droplet aerobreakup is primarily based on the aerobreakup of conventional test fluids such as deionised (DI) water, oils, liquid fuels, etc., which differ significantly from liquid metals in various aspects. The aerobreakup of liquid metal has not received much attention in the literature. Still, it has important applications in metal powder production, thermal spray coatings, explosive detonations, metalized propellant combustion and liquid metal cooling systems (Rader & Benson Reference Rader and Benson1988; Kondo et al. Reference Kondo, Konishi, Isozaki, Imahori, Furutani and Brear1995; Markus, Fritsching & Bauckhage Reference Markus, Fritsching and Bauckhage2002; Guildenbecher et al. Reference Guildenbecher, Cooper, Gill, Stauffacher, Oliver and Grasser2014; Apell et al. Reference Apell, Tropea, Roisman and Hussong2023). Several challenges exist in studying the atomisation of liquid metals, including the applicability of conventional fluid results to liquid metals, the marginally explored area of the liquid metal breakup, and the contrasting fluid properties of liquid metals compared with conventional fluids, such as higher density, higher surface tension, lower kinematic viscosity and high oxidation rates. To avoid the influence of temperature-dependent fluid properties variation, liquid metal experiments are generally carried out on pure metals/alloys that are in the liquid state at room temperature, such as Galinstan (gallium 68.5 %, indium 21.5 % and tin 10 %), EGaIn or mercury. Galinstan, a gallium-based eutectic liquid metal alloy, is popular due to its non-toxicity. However, Galinstan is readily oxidized in environmental conditions where the oxygen concentration is >1 ppm (Liu, Sen & Kim Reference Liu, Sen and Kim2011). The exact values of its fluid properties are debatable in the literature. Surface tension values are reported in the range of  $500\unicode{x2013}700\ {\rm mN}\ {\rm m}^{-1}$ (Liu et al. Reference Liu, Sen and Kim2011; Plevachuk et al. Reference Plevachuk, Sklyarchuk, Eckert, Gerbeth and Novakovic2014; Arienti et al. Reference Arienti, Ballard, Sussman, Mazumdar, Wagner, Farias and Guildenbecher2019; Handschuh-Wang, Stadler & Zhou Reference Handschuh-Wang, Stadler and Zhou2021b). This range is primarily due to the presence of oxidizing conditions in which measurements were undertaken. On the other hand, the viscosity and density values of
 $\sim$2 mPa s and
 ${\sim }6440\ {\rm Kg}\ {\rm m}^{-3}$, respectively, are consistent among different studies (Xu et al. Reference Xu, Oudalov, Guo, Jaeger and Brown2012; Plevachuk et al. Reference Plevachuk, Sklyarchuk, Eckert, Gerbeth and Novakovic2014; Handschuh-Wang et al. Reference Handschuh-Wang, Stadler and Zhou2021b). The rapid oxidation of a Galinstan alloy forms a thin elastic layer (size
 ${\sim }O(1)$ nm Jia & Newberg Reference Jia and Newberg2019) of gallium oxide that impacts the fluid's rheological properties (Dickey et al. Reference Dickey, Chiechi, Larsen, Weiss, Weitz and Whitesides2008; Xu et al. Reference Xu, Oudalov, Guo, Jaeger and Brown2012; Elton et al. Reference Elton, Reeve, Thornley, Joshipura, Paul, Pascall and Jeffries2020). Due to the challenges associated with liquid metals, only a few studies have been reported on their secondary atomisation.
Hsiang & Faeth (Reference Hsiang and Faeth1995) conducted preliminary work on the secondary atomisation of mercury droplets, where the bag breakup mode was found for  $We \sim 10$. Similar to the observations that were made for other conventional fluids. Chen et al. (Reference Chen, Wagner, Farias, DeMauro and Guildenbecher2018) investigated the Galinstan liquid column breakup by shock-induced crossflow for Weber number values ranging up to 250 and compared the results with those for water. They found that the breakup behaviour for the two fluids was very similar, with similar values of Weber number for mode transition. However, differences were observed in the shape of fragments, with irregular-shaped daughter droplets formed in the case of the Galinstan column due to the oxide layer formed on the exposed surface of droplets. Similar observations were made through numerical simulation (Arienti et al. Reference Arienti, Ballard, Sussman, Mazumdar, Wagner, Farias and Guildenbecher2019). Hopfes et al. (Reference Hopfes, Petersen, Wang, Giglmaier and Adams2021a,Reference Hopfes, Wang, Giglmaier and Adamsb) studied the atomisation of Galinstan droplets for moderate Weber numbers (
 $We = 10\unicode{x2013}104$) and found similar breakup modes and critical Weber number values for regime transition for Galinstan and conventional fluids with
 $Oh<0.1$. However, the bag formation occurred with lesser inflation, and its rupture appeared to be quicker for Galinstan droplets due to the oxide layer formation on the droplet surface. The role of oxidation was further verified by comparing the atomisation results of a Galinstan droplet with Field's metal. The Field's metal has a lower oxidation rate and, therefore, has higher bag inflation and higher breakup time.
The present work is focused on a high-Weber-number regime ( $We \sim O(1000)$), which itself comes with several associated challenges. The aerodynamic breakup of a liquid droplet is a high-speed phenomenon where the droplet disintegration is completed within the time scales of
 $O(100)\ \mathrm {\mu }{\rm s}$, particularly at higher Weber numbers. Previous studies in this regime focused on breakup and deformation characteristics of the droplet and morphology of the atomizing droplet (Theofanous, Li & Dinh Reference Theofanous, Li and Dinh2004; Theofanous & Li Reference Theofanous and Li2008; Meng & Colonius Reference Meng and Colonius2015; Poplavski et al. Reference Poplavski, Minakov, Shebeleva and Boyko2020; Wang et al. Reference Wang, Hopfes, Giglmaier and Adams2020; Sharma et al. Reference Sharma, Singh, Rao, Kumar and Basu2021c; Chandra et al. Reference Chandra, Sharma, Basu and Kumar2023). Liang et al. (Reference Liang, Jiang, Wen and Liu2020) investigated the influence of the vapour cavity on the droplet's atomisation behaviour and found the dynamics to be dependent on the size and eccentricity of the vapour cavity. Chandra et al. (Reference Chandra, Sharma, Basu and Kumar2023) investigated the role of polymer elasticity in controlling the breakup morphology of secondary droplets. It should be noted that the high-speed interaction dynamics is difficult to perceive through numerical and experimental means due to the short time and length scales of the breakup phenomenon. The disintegration of a millimetre size primary droplet into micron-sized daughter droplets within a time scale of a few microseconds requires high spatial-temporal resolution. The usage of high exposure times (even within microsecond order) results in the motion blur of fast-moving atomised droplets, which can lead to a misinterpretation of the actual phenomenon (as discussed by Theofanous & Li Reference Theofanous and Li2008). Therefore, a highly sophisticated and optimized experimental arrangement is required for effectively capturing the multiscale nature of the droplet's aerodynamic breakup and involved physical phenomenon. Although several recent experimental studies have attempted to investigate some of these aspects (Theofanous et al. Reference Theofanous, Li and Dinh2004; Theofanous & Li Reference Theofanous and Li2008; Biasiori-Poulanges & El-Rabii Reference Biasiori-Poulanges and El-Rabii2019; Liang et al. Reference Liang, Jiang, Wen and Liu2020; Wang et al. Reference Wang, Hopfes, Giglmaier and Adams2020; Jackiw & Ashgriz Reference Jackiw and Ashgriz2021), a comprehensive study providing benchmark measurement data for numerical simulation, which covers a wide parametric range and the complete evolution dynamics of the interaction phenomenon, is still lacking. In our previous works we attempted to fill this gap by investigating the high Weber number atomisation of Newtonian and viscoelastic droplets using high-quality experimentation (Sharma et al. Reference Sharma, Singh, Rao, Kumar and Basu2021c; Chandra et al. Reference Chandra, Sharma, Basu and Kumar2023). In this study we extend our efforts to explore the atomisation dynamics of a liquid metal droplet.
The discourse above indicates that the characteristics of oxide-forming liquid metals during fragmentation differ from those of traditional fluids, and a complete comprehension of their atomisation dynamics is yet to be achieved. Laboratory scale analysis for liquid metal atomisation is generally conducted using conventional fluids as test liquids. Therefore, a thorough understanding of the applicability of conventional fluid results to liquid metals can help to bridge the gap between conventional fluids and hot molten melts and improve industrial processes involving liquid metal atomisation. Existing research on liquid metal droplets has mainly concentrated on low to moderate Weber number  $(We < 100)$ interactions and compared the results of an oxide-forming liquid metal droplet with conventional fluids that lack oxidation characteristics. Here, it must be noted that due to the rapid oxidation rates of liquid metals, their industrial scale atomisation is carried out in inert atmosphere conditions (Mandal, Sadeghianjahromi & Wang Reference Mandal, Sadeghianjahromi and Wang2022). Particularly for the application involving metal powder production for additive manufacturing applications, liquid jets generally interact with high-speed supersonic gas jets. The flow Mach numbers of 4–6 are achievable, which can easily lead to a high local Weber number (
 ${>}O(1000)$) for the primary droplets, which remain unexplored in the literature. The present study addresses these issues, investigates the shock-induced atomisation dynamics of a Galinstan droplet in a high-Weber-number regime
 $(We \sim 1000$ to
 $8000)$, and conducts experiments in an inert atmosphere to prevent Galinstan oxidation. The results can be directly compared with conventional fluids, unlike the approach followed in the literature. The comparison between three test environments, namely conventional fluids (water–air), oxidizing fluids (Galinstan–air) and inert fluids (Galinstan–nitrogen), are made at multiple spatial and temporal scales to provide a qualitative and quantitative comparison of the three test cases. Finally, a phenomenological framework is provided for predicting the morphology of secondary droplets. The experimental shock tube set-up is simplified by using an exploding-wire-based technique to generate the required shock wave. Its inherent decaying flow characteristics provide a more realistic approach to studying the atomisation phenomenon than the conventional shock tube set-up. The advanced and optimized experimental arrangement used in this study addresses the concern of high spatial-temporal imaging of interaction phenomena, providing a suitable benchmark for future numerical validations.
This paper is organized as follows; § 2 provides the details of the experimental set-up and methodology used. Results and discussions are provided in § 3. Details are provided on the global observation of the phenomenon (§ 3.1), governing mechanism (§ 3.2), qualitative (§ 3.3) and quantitative (§ 3.4) comparison of three test cases and the phenomenological framework for predicting the morphology of the secondary droplets (§ 3.5). The conclusions are provided in § 4.
2. Materials and methods
2.1. Exploding-wire-based shock tube
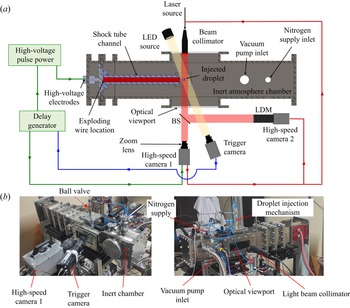
Figure 1 depicts an exploding-wire-based shock tube set-up, which generates a shock wave that interacts with a freely falling droplet. The shock tube operates by passing a high-voltage pulse (in the order of kilovolts and microseconds duration) through a thin metallic wire (35 SWG, bare copper wire) placed between two high-voltage electrodes, resulting in rapid Joule heating, melting and vaporization of the wire into a column of dense vapours. The formed vapour column expands and generates a cylindrical blast wave, which is transformed into a normal shock by the rectangular confinement of the shock tube flow channel ( $320\ {\rm mm} \times 40\ {\rm mm} \times 20\ {\rm mm}$). A 2 kJ pulse power system (Zeonics Systech, India Z/46/12) provides a high-voltage pulse by discharging a
 $5\ \mathrm {\mu }{\rm F}$ capacitor across the exploding wire. The charging voltage is varied from 5 kV to 15 kV, producing shock waves with varying strengths (see figure 2a). The shock Mach number
 $(M_s=U_s/v)$ ranges from 1.2 to 2.0, leading to a broad range of Weber number variation (
 $\sim$400–8000), as shown in figure 2(b). Here,
 $U_s$ represents the shock speed at the instant of shock interaction with the droplet. It is measured using the distance moved by the shock wave in two consecutive camera frames, while
 $v$ refers to the speed of sound in the medium ahead of the shock wave, i.e. gas at 0.35 bar and 298 K in the current experiment. The Weber number in the present work is defined as
 \begin{equation} We = \frac{\text{Disrupting pressure}}{\text{Laplace pressure}} = \frac{2(P_o-P_1)}{\sigma/D_o}. \end{equation}
Here  $P_o$ and
 $P_1$ are the stagnation pressure and static pressure at the droplet equator (i.e. at the windward point) and pole, respectively. The values of
 $P_o$ and
 $P_1$ are estimated using compressible flow theory for shock-induced airflow at the time instant of shock droplet interaction (Anderson Reference Anderson1990). The above definition of
 $We$ is consistent for both incompressible and compressible flows. The importance of representing the Weber number in this form is explained in supplementary figure S1 available at https://doi.org/10.1017/jfm.2023.705. Each experimental run is presented as a separate data point in figure 2. As the focus is on comparing different interaction environments at the same Weber number values, these plots provide better insights into which data points are compared.
Exploding-wire-based shock tube set-up incorporated with inert atmosphere chamber. (a) Schematic diagram showing experimental set-up, electrical wiring diagram and high-speed imaging system. (b) Photograph of the experimental arrangements.

Range of non-dimensional numbers. (a) Variation of shock Mach number ( $M_s$) with the capacitor charging voltage of a pulse power system. (b) Variation of Weber number (
 $We$) with shock Mach number (
 $M_s$). Similar Weber number values are maintained for comparing Galinstan–air, Galinstan–nitrogen and water–air test cases.

Several references provide a detailed overview of the exploding-wire technique and its application in shock-wave generation (Liverts et al. Reference Liverts, Ram, Sadot, Apazidis and Ben-Dor2015; Sembian et al. Reference Sembian, Liverts, Tillmark and Apazidis2016; Sharma et al. Reference Sharma, Singh, Rao, Kumar and Basu2021c; Chandra et al. Reference Chandra, Sharma, Basu and Kumar2023). Compared with conventional diaphragm-based shock tubes, the exploding-wire technique offers advantages such as smaller test facilities, easier operation, a wide range of shock Mach numbers (from 1 to 6 Sembian et al. Reference Sembian, Liverts, Tillmark and Apazidis2016) and high repeatability between tests. However, it is worth noting that conventional shock tube set-ups provide a uniform flow for a longer duration (around  $10^0\unicode{x2013}10^2$ ms) compared with the droplet breakup time scales (around
 $10^1\unicode{x2013}10^3\ \mathrm {\mu }{\rm s}$). On the other hand, the inherent properties of blast-wave-based shock tube set-ups cause fluid properties like gas velocity, density and pressure to decay rapidly with time. Therefore, it is not possible to quantitatively validate droplet aerobreakup achieved by these two different shock generation techniques. In the interest of the reader, we have provided the measure of droplet deformation and the time instances of breakup induction in the present set-up (§ 8), which can be compared with the literature to observe the variation in quantitative values that can be expected from two test set-ups. Blast-wave-based set-ups provide a parallel approach for investigating shock interactions, as shown in several studies (Ram & Sadot Reference Ram and Sadot2012; Igra et al. Reference Igra, Falcovitz, Houas and Jourdan2013; Pontalier et al. Reference Pontalier, Loiseau, Goroshin and Frost2018; Supponen et al. Reference Supponen, Akimura, Minami, Nakajima, Uehara, Ohtani, Kaneko, Farhat and Sato2018; Chandra et al. Reference Chandra, Sharma, Basu and Kumar2023). However, their utilization for studying droplet aerobreakup is a new approach (Sembian et al. Reference Sembian, Liverts, Tillmark and Apazidis2016; Sharma et al. Reference Sharma, Singh, Rao, Kumar and Basu2021c; Chandra et al. Reference Chandra, Sharma, Basu and Kumar2023). Therefore, discussing the transient aspects of shock and shock-induced flow properties associated with the present set-up is important. Such features of the current experimental set-up are summarised in supplementary figures S2 and S3, which were discussed in detail in our previous work on the same set-up (Sharma et al. Reference Sharma, Singh, Rao, Kumar and Basu2021c; Chandra et al. Reference Chandra, Sharma, Basu and Kumar2023). The decaying flow characteristics are more practical scenarios, and atomisation results of liquid metal droplets in such flow conditions can have direct implications in applications like closed coupled atomizers, detonation engines, etc. Many practical scenarios can benefit more from the blast-wave-based shock tube set-ups compared with the ideal conditions from conventional shock tube set-ups (Igra et al. Reference Igra, Falcovitz, Houas and Jourdan2013; Pontalier et al. Reference Pontalier, Loiseau, Goroshin and Frost2018). The current study's primary objective is to compare the atomisation dynamics of a liquid metal droplet with a DI water droplet, which is not affected by the choice of experimental set-up as both liquids are tested under the same conditions.
2.2. Imaging set-up
The droplet aerobreakup process is captured using high-speed shadowgraphy imaging (see figure 1). Specifically, we utilized a Photron SA5 camera synchronized with a Cavitar Cavilux smart UHS laser to freeze the interaction phenomenon in the 10–40 ns time scale, preventing the streaking of high-speed secondary droplets that could lead to observational errors. Side-view images are obtained at different zoom settings to capture different aspects of the droplet breakup. The light from a high-speed laser is transformed into a parallel beam using a beam collimator (Thorlabs, BE20M-A) to uniformly illuminate the camera's field of view. The droplet is detected by an image based trigger camera (PHANTOM Miro 110, coupled with a 100 mm macro-lens Tokina) as it fell into the field of view of the high-speed camera-1 (Photron SA5, coupled with a Sigma DG 105 mm), resulting in the projection of its shadow on the camera-1 sensor. A trigger signal generated by the trigger camera is sent to a digital delay generator (BNC 575), which precisely provides delayed trigger signals to a high-voltage pulse power system and high-speed camera-1, allowing us to capture the atomisation dynamics of the fragmenting droplet in the camera's field of view and at a desired location. Another high-speed camera-2 coupled with a long-distance microscope (LDM, Questar QM100) is used for simultaneous high-zoom imaging. High-speed camera-2 and the laser are operated as slaves to high-speed camera-1.
To obtain a global view of the droplet morphology during the breakup process, a zoomed-out imaging technique is employed. High-speed camera-1 is used for this purpose, capturing the interaction dynamics at 40 000 frames per second with a frame size of  $640 \times 264$ pixels. The resulting pixel resolution is
 $52.6\ \mathrm {\mu }{\rm m}\ {\rm pixel}^{-1}$, providing a field of view of
 $33.6\ {\rm mm} \times 13.91\ {\rm mm}$. Furthermore, for a more detailed view of the evolution of KH waves on the droplet surface, a zoomed-in imaging technique is used. A long-distance microscope coupled with high-speed camera-2, captures the growth of KH waves at an imaging rate of 75 000 fps. A frame size of
 $256 \times 312$ pixels is used, resulting in a spatial resolution of
 $13.16\ \mathrm {\mu }{\rm m}\ {\rm pixel}^{-1}$ and a field of view of
 $3.37\ {\rm mm} \times 4.11\ {\rm mm}$. The gas flow direction is from left to right in all the experimental images presented in this article.
2.3. Sample preparation and characterization
The Galinstan alloy used in this study is procured from Parmanu Dhatu Nigam, India. The liquid metal is utilized directly in the experiments conducted in an air environment. However, in inert atmosphere studies it is crucial to eliminate the pre-existing metal oxide from the bulk liquid due to Galinstan's tendency to oxidize readily. This is achieved by utilizing the chemical reduction method, which involves injecting the liquid metal into a 5M HCl solution (Kim et al. Reference Kim, Thissen, Viner, Lee, Choi, Chabal and Lee2013; Handschuh-Wang et al. Reference Handschuh-Wang, Stadler and Zhou2021b). The solution reduces the oxidized Galinstan through the reaction
 \begin{equation} {\rm Ga}_2{\rm O}_3 (\textrm{s}) + 6{\rm HCl} (\textrm{l}) \to 2{\rm GaCl}_3 (\textrm{s}) + 3{\rm H}_2{\rm O} (\textrm{l}). \end{equation}
While loading onto the droplet injection unit, the reduced Galinstan is poured into the injection tube, which is partially filled with 5M HCl solution to prevent air contact. This ensures that the Galinstan alloy remains completely unoxidized during the injection process. On the other hand, DI water can be directly added to the injection unit without any special precautions. The droplets of the test fluid are injected into the test chamber using pressurized air pulses. To perform this injection, the test fluid is held in a plastic tube connected to a stainless steel leur-lock needle (size 20 G) through a ball valve. To create an inert atmosphere inside the chamber, the ball valve is closed (see figure 1). However, after maintaining the chamber conditions and during the injection of a droplet, it is necessary to open the valve. The top end of the plastic tube is connected to a high-pressure air line through an electronically controlled solenoid valve, which exerts a pressure pulse on the test fluid by controlling the opening of the solenoid valve.
Table 1 displays the properties of the three test fluids. The surface tension values of DI water and Galinstan are determined using the pendant drop method using ImageJ software. On the other hand, the data for viscosity and density are obtained from the previous study Hopfes et al. (Reference Hopfes, Wang, Giglmaier and Adams2021b).
Properties of the test liquids. Surface tension is measured using the pendant drop method with five experimental trials for each test case. Other properties are taken from Hopfes et al. (Reference Hopfes, Wang, Giglmaier and Adams2021b).

2.4. Inert atmosphere test facility
The schematic and actual photograph of the inert atmosphere test facility is presented in figure 1. The facility has a stainless steel chamber (measuring  $15 \times 15 \times 75\ {\rm cm}^3$), with an optical window (measuring
 $8 \times 20\ {\rm cm}^2$). It can reach an ultimate vacuum pressure of
 $10^{-6}$ mbar and is equipped with a droplet injection unit, vacuum pump inlet and nitrogen supply. The vacuum pressure is measured using a digital Pirani gauge (make: Ultrahigh Vacuum Solutions, range: 999 to 0.001 mbar), while the gauge pressure is measured using a digital pressure sensor (Janatics Pneumatic, range: 0 to 10 bar). To achieve the inert conditions, the chamber is first evacuated using a vacuum pump up to the absolute pressure level of 0.018 mbar. The chamber is then purged with ultra-high pure nitrogen gas (Chemix gases, nitrogen grade 6.0, oxygen concentration <1 ppm) until the gauge pressure of 0.35 bar is achieved inside the chamber. This process is repeated for five cycles until the oxygen concentration inside the test chamber is reduced below 1 ppm level (not measured directly, but estimated theoretically using chamber pressure). Note that the nitrogen supply coming from the gas cylinder is further purified using oxygen and moisture traps installed between the cylinder exit and chamber inlet. After completing the purging cycles, the chamber is pressurized to 0.35 bar gauge pressure. This overpressure ensures that any leakage, if present, will occur from the inside to the outside of the chamber. The chamber is also tested to ensure that an absolute pressure of >1 mbar or higher pressure can be sustained for over 24 h without the assistance of the vacuum pump, which indicates minimal leakage is expected during experimental runs (each trial usually takes 20–30 min). These complex procedures are necessary to prevent the oxidation of Galinstan during experimental runs. The atomisation of Galinstan–air and water–air cases are also performed in the chamber with the same gauge pressure levels of 0.35 bar to maintain consistency.
3. Results and discussion
3.1. Global view of atomisation dynamics
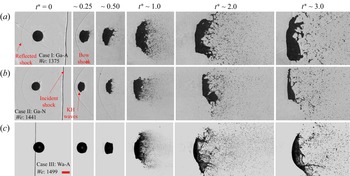
A global view of the shock droplet interaction for three test cases is presented in figure 3. The time sequence images are arranged from left to right, and absolute time is normalized with the inertial time scale  $t_{in}$, where
 $t_{in}= D_o\sqrt {{\rho _l}/{2(P_o-P_1)}}$. The present definition of inertial time scale is more generic and includes the definition of Nicholls & Ranger (Reference Nicholls and Ranger1969) when applied to incompressible fluid flow, where
 $(P_o-P_1 ) = 1/2 \rho _g U_r^2$. Each row of images represents three test cases, namely Galinstan–air, Galinstan–nitrogen and water–air. The test cases are visualized at the same non-dimensional time scale (
 $t^*$) instant. The first column of images at
 $t^*=0$ represents the moment of shock droplet interaction. Figure 3 compares the three test cases at comparatively lower spatial and temporal scales, providing a global view comparison of the atomisation dynamics. See supplementary movie 1 for the video files.
Global view of atomisation dynamics. (a) Case I: Galinstan–air test case (Ga-A) with  $We=1375$, (b) case II: Galinstan–nitrogen test case (Ga-N) with
 $We=1441$, (c) case III: water–air test case (Wa-A) with
 $We=1499$. Scale bar equals 2 mm. See supplementary movie 1 for the video file.

In all three test cases, after the interaction of the incident shock wave, different shock structures, such as a reflected wave, Mach stem, etc., are formed, which instantaneously change the local flow and pressure conditions around the droplet (see figure 3 at  $t^* = 0$). This wave dynamics is short lived and is followed by the induced airflow interaction with the droplet (Sharma et al. Reference Sharma, Singh, Rao, Kumar and Basu2021c). The surface tension of Galinstan is higher than DI water; therefore, to maintain the same Weber number values for Galinstan and water, the shock strength in the case of Galinstan has to be increased significantly (see figure 2b), resulting in the generation of shock-induced flow at supersonic conditions. The deflection of such supersonic gas flow from the droplet surface creates a bow shock (see figure 3(a,b) at
 $t^* \sim 0.25$) in front of the droplet windward surface. Based on the shock standoff distance from the windward droplet surface, induced gas flow Mach numbers are estimated to range between 1.1 to 1.3 (Starr, Bailey & Varner Reference Starr, Bailey and Varner1976). No such bow shock formation is observed for a DI water droplet, as the induced airflow is essentially in the subsonic regime. Compared with subsonic flow at the same Weber number, the literature shows that supersonic flow independently can alter the breakup behaviour in terms of the onset of the breakup, reduced deformation, limited spread of the secondary droplets and morphology of the atomizing primary droplet (Theofanous et al. Reference Theofanous, Li and Dinh2004; Meng & Colonius Reference Meng and Colonius2015; Wang et al. Reference Wang, Hopfes, Giglmaier and Adams2020). Till the flattening stage, Wang et al. (Reference Wang, Hopfes, Giglmaier and Adams2020) have shown a similar deformation characteristic of a droplet in subsonic and supersonic conditions. In the later stages a peripheral sheet is formed and grows faster in the subsonic flow when compared with supersonic flows. In the present work a supersonic flow interaction is also observed during Galinstan atomisation cases, as can be identified from the bow shock shown in figures 3 and 4. However, in contrast to the literature, its influence remains minimal in the current set-up, as shown in figure 3 and supplementary figures S4 and S5 and quantitatively in figures 8 and 9. The decaying nature of gas flow in the present set-up quickly reduces supersonic flow to a subsonic level beyond
 $t^*>1$, leading to its minimal influence.
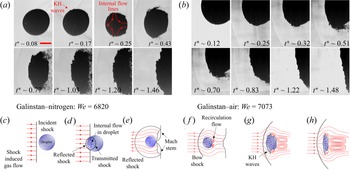
Mechanism of Galinstan droplet breakup in SIE mode. (a) Zoomed-in view of Galinstan droplet breakup in an inert environment at  $We =6820$. (b) Zoomed-in view of Galinstan droplet breakup in an air environment at
 $We =7073$. (c–h) Schematic diagram showing the mechanism of SIE breakup during the SIE mode. Scale bar equals 1 mm. See supplementary movie 2 for the video file.

As time progresses, the droplet deforms along with a simultaneous formation of KH waves on the windward surface, subsequently forming a thin liquid sheet at the droplet's pole from where stripping of secondary droplets begins (figure 3 at  $t^* \sim 0.5$ to
 $3.0$) (Sharma et al. Reference Sharma, Singh, Rao, Kumar and Basu2021c). At each time instant, droplet morphology appears to be similar in all three test cases. The SIE mode of droplet breakup is observed in all test cases studied in this work. The droplet deforms into a cupcake shape until
 $t^* \sim 0.25$ and stripping of droplets starts at
 $t^* \sim 0.6$. Furthermore, a significant extent of sheet atomisation is achieved up to
 $t^* \sim 1$, which is followed by the recurrent breakup.
A closer look at the images corresponding to  $t^* > 1.0$ suggests differences in the fragment shapes of the Galinstan–air case when compared with the other two test cases. Flake-like fragments are formed during Galinstan atomisation in air. Irregular-shaped fragments are visualized more clearly in figure 6. Such flake formation is attributed to the formation of an oxide layer on the fragmented liquid surface (Chen et al. Reference Chen, Wagner, Farias, DeMauro and Guildenbecher2018), which inhibits further breakup and locks the liquid metal into irregular-shaped metal oxide shells. Similar observations for the three test cases are observed for other Weber number values tested in this work (see supplementary figures S4 and S5). It should be noted that the breakup period of a Galinstan droplet in the air environment is of the order of
 ${\sim }100 \ \mathrm {\mu }{\rm s}$ that itself is observed to be sufficient for the creation of a significant metal oxide layer on the surface of the secondary droplets, thereby inhibiting the atomisation process. This suggests at least a microsecond duration estimation for the Galinstan oxidation time in ambient air, much faster than the previously observed oxidation time scales based on the droplet impact experiments (Kim et al. Reference Kim, Thissen, Viner, Lee, Choi, Chabal and Lee2013). In contrast to the Galinstan–air test case, atomisation dynamics of a Galinstan–nitrogen test case is essentially similar to that of DI water at comparable Weber number values, and spherical-shaped secondary droplets are formed in the two cases.
Due to an inert atmosphere enclosure around the shock tube, a reflected wave is generated when the incident wave impinges on the enclosure walls. The reflected wave interaction with the atomizing droplet is observed in the later stages of atomisation (see the water case in supplementary movie 1). The data at this instant cannot be precisely interpreted, which limits the quantitative comparison at this moment in the present experimental set-up. All test fluids are analysed in the same enclosure, and no quantitative and qualitative comparisons are provided during such later time instances.
3.2. Mechanism of liquid metal droplet breakup in SIE mode
The previous subsection 3.1 presented a global overview of atomisation dynamics for three test fluids. This subsection compares the detailed mechanism of three test cases undergoing droplet breakup through the SIE mode. High spatial and temporal resolution were employed to uncover the mechanism details. Figure 4(a,b) provides a zoomed-in view of a Galinstan droplet atomisation in a nitrogen and air environment, respectively. See supplementary movie 2 for the video file. Observation similar to the Galinstan–nitrogen test case is observed for the DI water–air test case (see supplementary figure S6). A schematic diagram illustrating different events during interaction is shown in figure 4(c–h). The wave structures depicted in the schematics, such as incident shock, reflected shock, Mach stem, etc., are based on the present visualizations and our previous publication (Sharma et al. Reference Sharma, Singh, Rao, Kumar and Basu2021c). As flow dynamics could not be visualized through experimental means, evidence from several numerical simulations is utilized to construct flow fields (Sembian et al. Reference Sembian, Liverts, Tillmark and Apazidis2016; Guan et al. Reference Guan, Liu, Wen and Shen2018; Das & Udaykumar Reference Das and Udaykumar2020). A detailed discussion on different wave structure formation, transportation and their influence on local flow dynamics is provided in our previous work Sharma et al. (Reference Sharma, Singh, Rao, Kumar and Basu2021c) and is not repeated here. It must be noted that the initial wave dynamics is short lived ( $O(10)\ \mathrm {\mu }{\rm s}$) when compared with the droplet breakup time (
 $O(100)\ \mathrm {\mu }{\rm s}$); therefore, all these wave features have a minimal effect on the breakup mechanism. In later time instances the breakup dynamics is primarily governed by the induced gas flow interaction with the droplet (see figures 4(a,b) for
 $t^* > 0.1$ and 4f–h).
Induced flow separation occurs at the droplet's leeward surface, creating a jet flow towards the rear stagnation point (see figure 4g–h) (Guan et al. Reference Guan, Liu, Wen and Shen2018; Das & Udaykumar Reference Das and Udaykumar2020). The formation of the stagnation point on the windward, as well as the leeward side of the droplet, increases the local pressure in these regions compared with the droplet pole, inducing an internal flow towards the droplet pole and resulting in the droplet deformation into a cupcake shape (see figure 4(a) at  $t^* \sim 0.43$). On the other hand, the relative velocity between the gas phase and liquid phase results in KH wave-based instabilities on the droplet's windward surface. Surface instabilities get entrained with the external gas flow and are transported along the droplet periphery, resulting in the formation of a liquid sheet at the equator region (see figure 4(a,b) at
 $t^* = 0.4$ to
 $0.8$). The formation of KH waves on the droplet windward side is also observed in the previous works (Theofanous & Li Reference Theofanous and Li2008; Liu et al. Reference Liu, Wang, Sun, Wang and Wang2018; Sharma et al. Reference Sharma, Singh, Rao, Kumar and Basu2021c; Chandra et al. Reference Chandra, Sharma, Basu and Kumar2023).
The above discussion suggests the two mechanisms for the formation of liquid sheets at the droplet pole, i.e. liquid transport through KH waves entrainment and droplet deformation. Fragmentation of this liquid sheet on the droplet pole results in the formation of secondary droplets. The temporal size distribution of the atomized droplets is influenced by these two mechanisms, as discussed in the following subsection.
3.3. Atomisation dynamics of liquid metal droplet at high Weber number
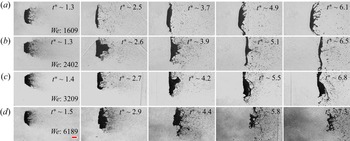
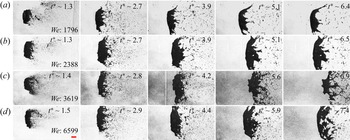
Figures 5 and 6 display time-series images (from left to right) of Galinstan droplet breakup in a nitrogen and air environment, respectively. Each row of images is organized in increasing order of Weber number values. According to the previous subsection, a liquid sheet is formed at the droplet's pole due to two mechanisms: liquid transportation based on KH waves and bulk flow resulting from droplet deformation. The first mechanism involves KH waves accumulating on the pole region, which produces a thinner sheet and smaller secondary droplets. The second mechanism involves liquid transport from the stagnation point to the pole region due to droplet deformation, resulting in bulk liquid transport and, thus, a thicker liquid sheet. As a consequence, larger secondary droplets are produced due to this mechanism.
Atomisation dynamics of a Galinstan droplet in an inert environment for different Weber number ( $We$) values. (a) Galinstan–nitrogen
 $We=1609$, (b) Galinstan–nitrogen
 $We=2402$, (c) Galinstan–nitrogen
 $We=3209$ and (d) Galinstan–nitrogen
 $We=6189$. Scale bar equals 2 mm.

Atomisation dynamics of a Galinstan droplet in the air environment for different Weber number ( $We$) values. (a) Galinstan–air
 $We=1796$, (b) Galinstan–air
 $We=2388$, (c) Galinstan–air
 $We=3619$ and (d) Galinstan–air
 $We=6599$. Scale bar equals 2 mm.

During the initial stages of droplet breakup, sheet formation is predominantly influenced by the KH wave-based mechanism as droplet deformation is minimal (see figures 4(a,b) at  $t^* < 1$ and 9a,b). Therefore, smaller secondary droplets are generated at this stage. However, in later time instances, liquid transport through droplet deformation takes over, resulting in the formation of larger secondary droplets. Additionally, multiple KH waves combine to form a thicker sheet, leading to the creation of bigger secondary droplets (see figure 4(a) at
 $t^* \sim 0.77$). This trend of increasing secondary droplet sizes with time is observed in all the test cases depicted in figures 5 and 6 and has also been quantitatively measured in our earlier study on aerobreakup of DI water droplets (Sharma et al. Reference Sharma, Rao, Chandra, Kumar, Basu and Tropea2023). Due to their lower inertia, smaller droplets can reach the measurement window much earlier than larger droplets, which must also be accounted for. Similar quantitative measurements of Glainstan droplet atomisation could not be provided because of the operation complexity of the experiments, the high setting time for each experimental trial, the requirement of many experimental trials for statistical significance and the high material cost of Galinstan. Considering the qualitative similarity between the present work and our previous work (Sharma et al. Reference Sharma, Rao, Chandra, Kumar, Basu and Tropea2023), a similar trend of droplet size distribution variation with time can be expected in the present case. Furthermore, as the flow Mach number increases, the KH wave's wavelength decreases (explained later in § 3.4), and more KH waves are formed on the windward side. As a result, more droplet liquid is transported through the KH wave-based mechanism, leading to the generation of smaller fragments for higher Weber number values. It is observed that the droplet fragmentation process persists until the aerodynamic force on the droplet, which is related to the relative velocity between the gas phase and liquid phase, dominates the surface tension force. This condition is not sustained during the observation period for the lower Weber number values (see figures 5 and 6a,b). However, at higher Weber numbers, complete fragmentation of the primary droplet occurs due to the higher aerodynamic forces acting on the droplet (see figures 5d and 6d).
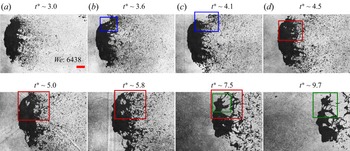
It is important to note that the droplet breakup during the SIE mode is a repetitive process (Dorschner et al. Reference Dorschner, Biasiori-Poulanges, Schmidmayer, El-Rabii and Colonius2020; Sharma et al. Reference Sharma, Singh, Rao, Kumar and Basu2021c), as illustrated in figure 7. During this process, the liquid sheet that forms at the droplet's pole is carried in the direction of the gas flow due to its entrainment with the external gas phase. As a result, the sheet is deflected and elongated in the flow direction, causing a continuous reduction in its thickness. This thin sheet is susceptible to instabilities, leading to the formation of holes (as shown in figure 7 at  $t^* \sim 3.6$). Multiple holes are formed at various locations on the sheet, and they expand in all directions due to the surface tension force. Eventually, several holes collide with one another, resulting in the formation of ligaments. In the Galinstan–nitrogen test case these ligaments undergo further pinch-off into secondary droplets, whereas, in the Galinstan–air test case, the formed ligaments do not pinch-off further due to significant surface oxidation at this time period, leading to the formation of irregular-shaped fragments (discussed in § 3.5). As discussed earlier, SIE breakup follows a repetitive cycle. First, a sheet is formed, followed by hole formation, ligament generation and droplet pinch-off. This process is illustrated by the blue rectangle in figure 7. After one cycle, the same process repeats until the droplet disintegrates completely or until the restoring surface tension forces overpower the aerodynamic forces. This recurrent breakup of the droplet is represented by the red and green rectangles in figure 7.
Recurrent breakup of a Galinstan droplet in air for  $We = 6438$. The blue, red and green rectangle indicates the first, second and third breakup cycles. Scale bar equals 2 mm.

3.4. Quantitative comparison for three test cases
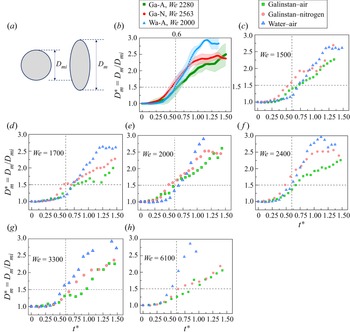
The previous subsections (§§ 3.1, 3.2, 3.3) provided a qualitative comparison of the atomisation dynamics for three test cases. This subsection aims to make a quantitative comparison between them. Figure 8 shows the non-dimensionalized cross-stream diameter ( $D_m ^*$) of the droplet plotted against non-dimensional time (
 $t^*$). Figure 8 compares a single experimental trial of each test case at similar Weber number values. Maintaining the same Weber number values in multiple experimental trials is challenging. Therefore, a similar approach is also followed in the literature (Opfer et al. Reference Opfer, Roisman, Venzmer, Klostermann and Tropea2014; Wang et al. Reference Wang, Hopfes, Giglmaier and Adams2020; Jackiw & Ashgriz Reference Jackiw and Ashgriz2021). The exact value of the Weber number for the considered test cases is shown in supplementary table S1. A variation of up to 12 % exists in the chosen Weber number values and can result in a slight variation of droplet deformation between different test cases. The data set chosen for comparison is random, and any set of similar Weber number test cases gives similar deformation results. To measure the instantaneous cross-stream diameter (
 $D_m$), an ellipse profile is fitted onto the deformed droplet using ImageJ software. To achieve this, the raw image is first threshold at a particular intensity value (same for all measurements), followed by identification of the coherent mass of the droplet in which all connected pixels contributing to a coherent structure are identified, and finally, an ellipse is fitted to the identified structure. An example of such a size measurement for three test cases at
 $We\sim 1700$, and for different time instances, is shown in supplementary figure S7 and movie 3. The methodology is reasonably good for determining droplet deformation before and after atomisation. The results indicate a similar deformation trend for all three test cases when
 $t^* < 0.6$, but some discrepancies exist for
 $t^* > 0.6$. As seen in figure 3, up to
 $t^* < 0.6$, the droplet has undergone deformation, KH wave formation and the first instant of droplet breakup is observed, which is similar in all three test cases. During this duration, the deformation and fragmentation of the droplet is axisymmetric, and a two-dimensional projection is expected to give droplet deformation data with reasonable accuracy. Some variation in flow conditions can always result in variation in the data, but we expect such variation to be minimal. The uncertainty in deformation measurement based on the standard deviation of multiple experimental trials is shown in figure 8(b) for three test environments at a
 $We \sim 2200$. In figures 8(c)–8(h) a random order of trend and variable differences exists in the deformation data of three test environments. Variation can arise due to experimental uncertainties. As observed in the literature (Chen et al. Reference Chen, Wagner, Farias, DeMauro and Guildenbecher2018; Arienti et al. Reference Arienti, Ballard, Sussman, Mazumdar, Wagner, Farias and Guildenbecher2019; Hopfes et al. Reference Hopfes, Wang, Giglmaier and Adams2021b), the uncertainty in droplet deformation increases with an increase in the Weber number values. Here, deformation is measured at much higher Weber number values, and higher uncertainty is expected. Within the experimental uncertainty, a similar behaviour of droplet deformation is observed till the first instance of droplet breakup (
 $t^* \sim 0.6$, in all cases). Previous studies (Chen et al. Reference Chen, Wagner, Farias, DeMauro and Guildenbecher2018; Arienti et al. Reference Arienti, Ballard, Sussman, Mazumdar, Wagner, Farias and Guildenbecher2019; Hopfes et al. Reference Hopfes, Petersen, Wang, Giglmaier and Adams2021a) have also shown a similar behaviour of early stage droplet deformation between Galinstan and DI water test cases. After
 $t^* > 0.6$, droplet atomisation begins, making it difficult to measure the cross-stream diameter accurately. This is because the cross-stream length of the liquid sheet can also be detected as the cross-stream diameter based on the measurement approach followed here. However, it is still essential to present the measurement of cross-stream deformation beyond
 $t^* > 0.6$ because it also indicates the cross-stream spread of the atomizing liquid sheet. This spread becomes more random during later time periods due to variations in the atomisation behaviour of a deformed droplet sheet on a case-to-case basis. It should be noted that the operational mechanism of the present shock tube is different from the conventional shock tube; therefore, direct validation of the quantitative results from the present set-up with the conventional shock tube system should be avoided. However, we compare the quantitative differences between the two set-ups in terms of droplet deformation at similar instances and breakup induction time. Breakup induction in a conventional shock tube-based study is reported at
 $t^* \sim 0.3$ for different ranges of
 $We$ values (Theofanous & Li Reference Theofanous and Li2008; Theofanous et al. Reference Theofanous, Mitkin, Ng, Chang, Deng and Sushchikh2012; Biasiori-Poulanges & El-Rabii Reference Biasiori-Poulanges and El-Rabii2019; Wang et al. Reference Wang, Hopfes, Giglmaier and Adams2020). Due to decaying flow characteristics, we observe it to occur at
 $t^*\sim 0.6$, which is higher than the literature for a similar order of
 $We$ values. However, cross-stream deformation at this instant is observed to be of similar magnitude
 $D_m/D_{mi} \sim 1.5$ (see figure 8 and Wang et al. Reference Wang, Hopfes, Giglmaier and Adams2020). Supplementary table S2 shows the breakup induction time and corresponding droplet deformation at that instant for different
 $We$ values tested in the present work.
Cross-stream droplet deformation  $D_{mi}$ and
 $D_{m}$ represent initial and instantaneous cross-stream diameters. (a) Schematic diagram showing cross-stream deformation. (b) Uncertainty in droplet cross-stream deformation measurement for
 $We \sim 2200$. Error bars represent the standard deviation in multiple experimental trials. (c–h) Cross-stream deformation with non-dimensional time for
 $We \sim 1500$, 1700, 2000, 2400, 3300 and
 $6100$.

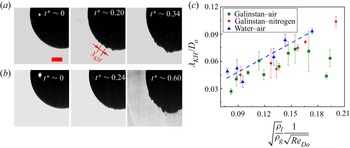
Figure 9 (also supplementary movie 4) presents the comparison of the experimentally measured KH waves wavelength for three test cases using high spatial and temporal resolution measurements. Figure 9(a) at  $t^* \sim 0.20$ displays a sample case of KH wave measurement. Figure 9(a,b) shows a zoomed-in image of KH wave formation for the Galinstan–air test case at
 $We = 1186$ and
 $7073$, respectively. Measurements were done at the first instance of appearance of KH waves. As time progresses, these waves grow in size and the wavelength increases, get entrained with the shock-induced gas flow and get deflected in the flow direction. In later times, some instances of wave merging and droplet stripping are also observed from these surface waves. This mechanism of KH wave formation and evolution is discussed in our previous publications (Sharma et al. Reference Sharma, Singh, Rao, Kumar and Basu2021c; Chandra et al. Reference Chandra, Sharma, Basu and Kumar2023). The translation and merging of the KH waves are much slower than the imaging rate used in the measurements and, therefore, do not impose any uncertainty (see supplementary figure S8). The measured values of non-dimensionalized KH waves wavelength (
 $\lambda _{KH}/D_o$) for three test cases at different Weber number values are shown in figure 9(c). A theoretical framework of KH wave-based linear stability analysis of non-zero vorticity thickness for an incompressible fluid flow was provided in Villermaux (Reference Villermaux1998), Marmottant & Villermaux (Reference Marmottant and Villermaux2004), Padrino & Joseph (Reference Padrino and Joseph2006) and also used in Chandra et al. (Reference Chandra, Sharma, Basu and Kumar2023) and Sharma et al. (Reference Sharma, Singh, Rao, Kumar and Basu2021c). A similar analysis is used here to estimate the KH wavelength for the water–air test case. The dispersion relation can be written as
 \begin{equation} e^{{-}2 \eta} = [1+(\varOmega - \eta)] \left[\frac{ \varPhi+(\varOmega+\eta) \{ 2\tilde{\rho}-(1+\tilde{\rho})(\varOmega + \eta)-(1+\tilde{\mu})\beta \eta^2 \} }{\varPhi+(\varOmega+\eta) \{ 2\tilde{\rho}-(1-\tilde{\rho})(\varOmega + \eta)-(1-\tilde{\mu})\beta \eta^2 \}} \right], \end{equation}
where  $\varOmega = -2\omega _{KH} \delta / V_i$ is the dimensionless growth rate and
 $\delta$ is the thickness of the vorticity layer;
 $\eta =k_{KH} \delta$ is a dimensionless wavenumber and
 $k_{KH}=2 {\rm \pi}/ \lambda _{KH}$ is the wavenumber;
 $\tilde {\mu } = \mu _g/\mu _l$ and
 $\tilde {\rho } = \rho _g/\rho _l$ are non-dimensionalized viscosity and density ratios, where subscript
 $g$ and
 $l$ represents the gas and liquid phase, respectively;
 $\beta$ and
 $\varPhi$ are related to the vorticity-thickness-based Weber number, and their definition can be seen from Chandra et al. (Reference Chandra, Sharma, Basu and Kumar2023). Equation (3.1) is solved to obtain the wavelength of the fastest growing KH wave (
 $\lambda _{KH}$). For
 $We\gg 1$ and
 $V_i\gg V_l$, the fastest growing wavelength is given as (Marmottant & Villermaux Reference Marmottant and Villermaux2004)
 \begin{equation} \frac{\lambda_{KH}}{D_o} = C_1\sqrt{\frac{\rho_l}{\rho_g}} \frac{1}{\sqrt{Re_{D_o}}}. \end{equation}
Here,  $C_1$ is a constant and
 $Re_{D_o}$ is the Reynolds number based on the initial droplet diameter and initial gas flow velocity. The variation of non-dimensional wavelength for different values of the right-hand side function in (3.2) is shown in figure 9(c). As predicted by (3.2), a linear variation of non-dimensional KH wavelength is observed with the right-hand side function (see figure 9c). For unclear reasons, some discrepancy is observed for the Galinstan–air test case at higher right-hand side values. It is not possible to extend the same mathematical approach for Galinstan test cases because the induced gas flow condition in the present studies is in a lower supersonic regime (i.e. flow Mach number <1.2), and reducing governing mass and momentum equations into a linearized form is not possible in this flow regime (Anderson Reference Anderson1990). The high variation in experimental data in figure 9(c) is due to variations of the KH wave wavelength depending on the location of their formation on the windward surface of the droplet (see figure 9(a),
 $t^* \sim 0.20$). Liu et al. (Reference Liu, Wang, Sun, Wang and Wang2018) have shown that smaller wavelengths are formed near the front stagnation point while larger wavelengths are formed near the poles. Based on the experimental observations of our present and previous works (Sharma et al. Reference Sharma, Singh, Rao, Kumar and Basu2021c; Chandra et al. Reference Chandra, Sharma, Basu and Kumar2023), variable-size KH wavelengths are observed at different peripheral locations and distributed randomly on windward surfaces. For capturing the trend of wavelength variation along the droplet periphery, future work will focus on employing a much higher spatial-temporal resolution.
Kelvin–Helmholtz instability waves formation on the windward surface of the droplet. (a,b) Zoomed-in images showing the formation and evolution of KH waves on the surface of a Galinstan droplet in an air environment at  $We =1186$ and
 $7073$, respectively. Scale bar equals
 $500\ \mathrm {\mu }{\rm m}$. (c) Variation of the KH waves wavelength with density ratio and flow Reynolds number (3.2). A blue dashed line shows the predicted wavelength values from (3.1) for the water–air test case at different
 $We$ values. See supplementary movie 4 for the video file.

In previous works the SIE mode of droplet breakup was observed to occur for  $D_o/\lambda _{KH} \gg 1$ (Theofanous et al. Reference Theofanous, Mitkin, Ng, Chang, Deng and Sushchikh2012; Sharma et al. Reference Sharma, Singh, Rao, Kumar and Basu2021c), which in the present work is also validated for liquid metal droplets (see figure 9c). The discussion from §§ 3.1, 3.2 and 3.3 suggests that the mode and mechanism of droplet breakup are qualitatively and quantitatively similar for all three test cases, even at the time and length scales of breakup induction and KH wave formation, respectively. The above discussion provides important insights that the governing physics of liquid metal atomisation can be explored through conventional fluids, and results can be translated to the atomisation of liquid metals provided similar Weber number values and environmental conditions are maintained. However, the results of an oxidizing test case can only be compared regarding the modes and mechanisms of the secondary droplet formation. Their morphology differs significantly from the inert cases, as discussed in the following subsection. The influence of Galinstan oxidation in the early stages of droplet deformation or atomisation mode selection (i.e. KH wave formation) is not observed and neither expected because, during early stages, inertia forces of gas flow are more dominant over the elastic force provided by a thin layer of metal oxide. A scaling estimation for inertia and elastic forces can be obtained in the following manner. Dickey et al. (Reference Dickey, Chiechi, Larsen, Weiss, Weitz and Whitesides2008) have shown that the yield strength of a gallium-based alloy is
 $O(0.1)\ {\rm N}\ {\rm m}^{-1}$ and the thickness of the oxide layer was measured to be
 $O(1)$ nm (Jia & Newberg Reference Jia and Newberg2019). Thus, the elastic force required to yield a metal oxide layer is
 $O(10^{-10})$ N. In comparison to that, the inertia force of the induced gas flow is estimated as
 $F_{in}=(P_o-P_1)A=\frac {1}{2} \rho _g V_i^2 A$. Induced flow gas density and velocity are
 $O(1)\ {\rm Kg}\ {\rm m}^{-3}$ and
 $O(100)\ {\rm m}\ {\rm s}^{-1}$, respectively, and droplet diameter is
 $O(1)$ mm. This results in an inertia force of
 $O(10^{-2})$ N. The inertia forces magnitude is much higher than the elastic forces. Thus, during the initial interaction stages we do not expect any influence of the formed oxide layer in governing the interaction dynamics.
3.5. Phenomenological framework for secondary droplet morphology
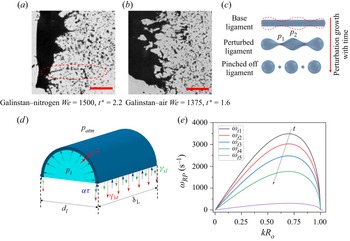
In the previous discussion we compared the qualitative and quantitative aspects of three test cases concerning breakup modes, atomisation mechanism, deformation characteristics and KH wave wavelength magnitude. In this section we focus on the differences in these cases based on the breakup morphologies and provide a theoretical framework to predict each morphology type. As we discussed in § 3.1, the breakup morphology of the DI water case and Galinstan–nitrogen case is similar, where spherical-shaped secondary droplets are formed. In contrast, the Galinstan–air test case results in flake-like fragments due to the rapid oxidization of the fragmenting ligaments. Figure 10(a,b) depicts the ligament breakup for the Galinstan–nitrogen and Galinstan–air test cases, respectively. It should be noted that a liquid ligament under small perturbation is prone to surface instabilities, which can grow over time due to surface tension forces, leading to the pinch of ligaments into numerous secondary droplets. This ligament breakup mechanism is well known as the Plateau–Rayleigh (PR) instabilities (Drazin & Reid Reference Drazin and Reid2004; Sharma et al. Reference Sharma, Pinto, Saha, Chaudhuri and Basu2021a) and is schematically represented in figure 10(c). When a small perturbation occurs on the base ligament, it results in differential pressures  $p_1$ and
 $p_2$ at two locations. The growth rate (
 $\omega$) of the PR instability can be calculated using the expression (Drazin & Reid Reference Drazin and Reid2004)
 \begin{equation} \omega^2 = \frac{\sigma}{\rho_l R_l^3}kR_l \frac{I_1(kR_l)}{I_0(kR_l)}(1-k^2R_l^2), \end{equation}
where  $R_l$ represents the initial radius of the ligament,
 $I_1$ and
 $I_0$ are first- and zero-order modified Bessel functions of the first kind, respectively, and
 $k$ is the wavenumber. The time scale for ligament rupture can be determined using (3.3). Specifically, the time scale is given by
 $t_{c} \sim {1}/{\omega } \sim \sqrt {{\rho _l R_l^3}/{\sigma }}$. For the Galinstan–nitrogen cases, this time scale is around
 $O(100)$
 $\mathrm{\mu}$s for ligaments with a diameter of
 $O(100)\ \mathrm {\mu }{\rm m}$, which aligns with experimental findings.
Phenomenological framework for ligament breakup leading to secondary droplets. (a) Atomisation of Galinstan ligament through Plateau–Rayleigh (PR) instability in a nitrogen environment. (b) Stable ligament formation during Galinstan breakup in the air atmosphere. (c) Schematic diagram showing instability growth through PR instability. (d) Schematic showing different interfacial forces acting on the Galinstan liquid ligament when exposed to the air environment. (e) The growth rate of PR instability at different time instances. Scale bar equals 1 mm.

In the Galinstan–air test case a thin elastic metal oxide layer forms on the ligament surface due to exposure to an oxidizing environment. Based on the present experimental observation, the rate of oxide layer formation is inferred to be much faster than the experimental time scales ( $O(100)\ \mathrm {\mu }{\rm s}$). This suggests an instantaneous growth rate of the oxide layer (compared with experimental time scales). It has been shown in the literature that the surface characteristics of a fully oxidized gallium-based alloy are mainly influenced by the formed oxide layer (Dickey et al. Reference Dickey, Chiechi, Larsen, Weiss, Weitz and Whitesides2008; Handschuh-Wang et al. Reference Handschuh-Wang, Gan, Wang, Stadler and Zhou2021a). The elasticity of the oxide layer counteracts the effective interfacial tension (due to solid–liquid and liquid–air interfaces), resulting in a negligible net normal interfacial force acting on the ligaments. Consequently, as per PR instability analysis, stable ligaments are formed, as in the case of the Galinstan–air test case.
The oxidation rate of liquid metals can be controlled by modifying the oxygen concentration in the environment. In the current study, Galinstan was tested under two extreme conditions: ambient air, where there is a sufficient oxygen supply, and an inert atmosphere with an extremely low oxygen concentration. This results in two different types of breakup morphologies (spherical droplets and flake-like fragments). The stability of the ligaments and the type of breakup morphology observed are dependent on the oxidation rate of the liquid metal and the resulting properties of the oxide layer formed on the ligament surface. If the oxygen concentration is in between the above two extremes, the oxidation rate of the liquid metal is not instantaneous. In such cases, the size of fragmenting ligaments determines the shape of secondary droplets. A typical example of such a ligament is depicted in figure 10(d). The pinch-off of these ligaments is influenced by interfacial forces (such as  $\sigma _{la}$ for the liquid Galinstan–air interface and
 $\sigma _{sl}$ for the solid gallium oxide-liquid Galinstan interface), and a thin metal oxide layer that provides an elastic resistance to the pinch-off process, resulting in circumferential compressive stress. As a result, the normal force balance on the interface is given by the expression
 \begin{equation} (p_i - p_{atm})\delta L d_l = 2[\phi(t) \sigma_{sl} \delta L + \psi(t) \sigma_{la} \delta L- \alpha \tau(t)], \end{equation}
where  $p_i$ and
 $p_{atm}$ represent the internal and ambient pressure of the ligament, respectively;
 $\delta L$ represents the infinitesimal element of the ligament and
 $d_l$ represents the diameter of the ligament; the weight factors
 $\phi (t)$ and
 $\psi (t)$ are time dependent and control the effective interfacial tension of the solid–liquid and liquid–air interfaces, respectively;
 $\alpha$ represents the yield strength of the oxide layer and
 $\tau (t)$ represents the time-varying thickness of the oxide layer. Initially,
 $\tau (t)$ and
 $\phi (t)$ will be zero, and
 $\psi (t)$ will be 1 since there will be no oxide layer at the start of the process (
 $t = 0$). The magnitudes of these factors will change over time based on the thickness of the oxide layer. Equation (3.4) can be further simplified to
 \begin{equation} (p_i - p_{atm}) d_l = 2[\sigma_{effective}- \alpha bt]=2F_i (t), \end{equation}
where  $\sigma _{effective}$ is the effective interfacial tension and
 $b$ is the growth rate of oxide layer;
 $F_i$ represents the interfacial force per unit ligament length, which is equivalent to the liquid–air interfacial tension when the oxide layer is not present. After following the linear stability for PR instability, using (3.5) one can obtain the growth rate of instability as
 \begin{equation} \omega^2 = \frac{F_i}{\rho_l R_l^3}kR_l \frac{I_1(kR_l)}{I_0(kR_l)}(1-k^2R_l^2). \end{equation}
The growth rate of instability ( $\omega$) depends on
 $F_i$, which decreases with time. Consequently, the growth rate of instability is expected to decrease over time, as shown in figure 10(e). If the pinch-off of a ligament occurs before the instability growth rate reaches zero, then we can expect the formation of spherical droplets, as observed in the Galinstan–nitrogen test case. However, if this criterion is not fulfilled, as in the case of the Galinstan–air test case, the formed ligaments do not undergo further atomisation into secondary droplets. The time scale of
 $F_i \to 0$ is given by
 $t_o = {\sigma _{effective}}/{\alpha b}$ from (3.5). For a typical ligament size of
 $O(100)\ \mathrm {\mu }{\rm m}$, we can consider two extreme situations to determine the possible oxidation rates of the Galinstan. The capillary breakup time scale for this ligament size is
 $O(100)\ \mathrm {\mu }{\rm s}$. For the first instance, if we consider the instantaneous oxidation of the ligament, i.e. assuming the time scale of the oxide layer formation is
 $O(1)\ \mathrm {\mu }{\rm s}$ and
 $\sigma _{effective} =\sigma _{sl}$, the oxidation rate (b) turned out to be of
 $O(1)\ {\rm mm}\ {\rm s}^{-1}$. Here an estimation of
 $\alpha$ is taken from Dickey et al. (Reference Dickey, Chiechi, Larsen, Weiss, Weitz and Whitesides2008) using oxide layer thickness estimates from Scharmann et al. (Reference Scharmann, Cherkashinin, Breternitz, Knedlik, Hartung, Weber and Schaefer2004), Jia & Newberg (Reference Jia and Newberg2019) and Bilodeau, Zemlyanov & Kramer (Reference Bilodeau, Zemlyanov and Kramer2017). For the second instance, if the oxidation rate is very slow, as in the case of an inert atmosphere,
 $\sigma _{effective} =\sigma _{la}$ and the oxidation rate is estimated as
 $O(0.1)\ \mathrm {\mu }{\rm m}\ {\rm s}^{-1}$ provided complete oxidation is assumed to occur at
 $O(10)$ ms. Comparing
 $t_o$ with the time scale of capillary breakup
 $(t_c)$ gives an essential criterion for the ligament size that will undergo pinch-off into droplets for a given oxidation rate as
 \begin{equation} R_l \ll \left(\frac{\sigma_{effective} ^2 F_i}{\rho_l \alpha^2 b^2} \right)^{1/3}. \end{equation}
The above-proposed framework provides a phenomenological explanation for the complete pinch-off of Galinstan ligaments in nitrogen environments and flake formation in air environments. The presented framework fits well for the two extreme oxidation rates considered in this work. However, verifying this framework for an intermediate oxidation rate could not be obtained because estimation for the Galinstan oxidation rate is an onerous task. As per the author's knowledge, there is no existing literature available for such an estimation. The oxidation rate models provided for other liquid metals (Zhang Reference Zhang2010) cannot be translated here because of the very short time scale of the phenomenon in the present case. This difficulty arises due to the short time scale of the oxidation phenomenon (around  $100\ \mathrm {\mu }{\rm s}$) and the small length scales involved (around
 $O(1)$ nm). Therefore, currently, it is not possible to achieve quantitative validation of the proposed model for intermediate oxidation rates. Nevertheless, if a robust estimation of the Galinstan oxidation rate becomes available in the future, it could be used to feed values into the proposed framework, and quantitative validation of the model could be achieved.
4. Conclusions
The aerobreakup of a liquid metal droplet at a high-Weber-number ( $We \sim 400\unicode{x2013}8000$) regime is investigated. Galinstan is taken as a test fluid, and multiscale spatial and temporal investigations are carried out for three test environments: oxidizing (Galintan–air), inert (Galinstan–nitrogen) and conventional fluids (water–air). Using Galinstan–nitrogen as a test case provides an excellent base for comparing liquid metal atomisation results with conventional fluids, an approach considered for the first time in this work. A global view of atomisation dynamics reveals similar qualitative and quantitative features between Galinstan–nitrogen and water–air test cases. This indicates that the results of conventional fluids can be translated to liquid metal droplets provided similar Weber numbers and environmental conditions are maintained. On the other hand, the Galinstan–air test case showed a difference in the morphology of fragmenting secondary droplets due to the rapid oxidation of liquid metal, while the mode and mechanism of atomisation remain similar to other cases.
For the considered  $We$ values, all test fluids show a similar breakup mode and mechanism at multiple length scales and time scales explored in this work. The SIE breakup mode is observed in all cases. Minimal influence is observed on droplet breakup due to the initial wave interaction. However, the later-stage breakup mechanism is primarily governed by shock-induced gas flow interaction with the droplet.
Quantitative similarities for the three test cases are also provided regarding the temporal evolution of the non-dimensionalized cross-stream diameter and experimental measurement of KH surface waves. The cross-stream deformation is found to be similar for all test fluids until the beginning of droplet atomisation. In all test cases, the wavelength of KH waves decreases with an increase in the flow Reynolds number, consistent with previous measurements for Newtonian and viscoelastic fluids. Furthermore, the criteria for SIE mode breakup (i.e. SIE mode only exists if  $D_o/\lambda _{KH} \gg 1$) is validated in the present work for liquid metal droplets.
The morphology of DI water and Galinstan–nitrogen secondary droplets are similar, where spherical-shaped secondary droplets are formed. However, in the third case (Galinstan–air), flake-like fragments are produced due to the rapid oxidation of the fragmenting ligaments, which inhibits further breakup and locks the liquid metal into irregular-shaped metal oxide shells. The PR instability is responsible for the pinch-off of the ligaments into secondary droplets in the first two cases. A phenomenological framework is also provided, which explains the flake-like secondary droplets formation in the Galinstan–air test case. The postulated framework depends on the oxidation rate of the liquid metal and the properties of the oxide layer formed on the ligament surface. The oxidation rate of liquid metals can be controlled by modifying the oxygen concentration in the environment. When the oxidation rate is between the two extreme conditions (no oxidation and rapid oxidation), the size of the fragmenting ligaments determines the shape of the secondary droplets.
Supplementary material and movies
Supplementary material and movies are available at https://doi.org/10.1017/jfm.2023.705.
Acknowledgements
The authors gratefully acknowledge Professor C. Tropea (TU Darmstadt, Germany), Professor S. Chakraborty (IIT KGP, India), Professor I. Roisman (TU Darmstadt, Germany), SMS group (Germany), Tata Steel (India) and IGSTC PPAM group for their insights and discussions during the development of the present work.
Funding
The authors acknowledge support from IGSTC (Indo–German Science and Technology Center) through project no. SP/IGSTC-18-0003. N.K.C. acknowledges support from the Prime Ministers Research Fellowship (PMRF).
Declaration of interests
The authors report no conflict of interest.