INTRODUCTION
Recent studies of precision cereal farming systems have documented large within-field and annual variation in grain yield (Booltink et al. Reference Booltink, van Alphen, Batchelor, Paz, Stoorvogel and Vargas2001; Blackmore et al. Reference Blackmore, Godwin and Fountas2003; Joernsgaard & Halmoe Reference Joernsgaard and Halmoe2003; Welsh et al. Reference Welsh, Wood, Godwin, Taylor, Earl, Blackmore and Knight2003; Yamagishi et al. Reference Yamagishi, Nakamoto and Richner2003). Uniform application of seed, fertilizer and pesticide across a field does not apparently represent the most efficient input use and furthermore, there is increased risk of nutrient leaching from areas of poor growth and low yield in the field (van Alphen Reference Van Alphen2002; Welsh et al. Reference Welsh, Wood, Godwin, Taylor, Earl, Blackmore and Knight2003; Wood et al. Reference Wood, Welsh, Godwin, Taylor, Earl and Knight2003). There are numerous interrelated reasons for within-field variation in growth capacity and productivity. These are often attributed to spatial differences in soil characteristics, including availability of nutrients, soil texture and soil water holding capacity, but also pathogen and pest infestation cause spatial variability in crop growth (Timlin et al. Reference Timlin, Pachepsky, Walthall and Loechel2001; Skerritt et al. Reference Skerritt, Adams, Cook and Naglis2002). In addition, cultivation methods, particularly those for soil incorporation, increase within-field variability (Timlin et al. Reference Timlin, Pachepsky, Walthall and Loechel2001; Earl et al. Reference Earl, Taylor, Wood, Bradley, James, Waine, Welsh, Godwin and Knight2003; James & Godwin Reference James and Godwin2003; Taylor et al. Reference Taylor, Wood, Earl and Godwin2003; Wendroth et al. Reference Wendroth, Reuter and Kersebaum2003; Yamagishi et al. Reference Yamagishi, Nakamoto and Richner2003). Quality traits, especially protein and kernel weight, also respond to within-field fluctuation in growing conditions. Quality requirements must be met if the grain is to be used as raw material for processing, including malting and baking. Skerritt et al. (Reference Skerritt, Adams, Cook and Naglis2002) reported large variation in protein quantity and quality in wheat (Triticum aestivum L.) comparable to that for grain yield. Otherwise, recent research has emphasized detection and analysis of variation in grain yield, not so in quality traits.
Most of the data reported recently were obtained using conventional combine harvesters equipped with a global positioning system (GPS) and continuous yield scaling equipment (Blackmore et al. Reference Blackmore, Godwin and Fountas2003; Joernsgaard & Halmoe Reference Joernsgaard and Halmoe2003). Such technology generates excellent data for investigating the extent of spatial within-field variation in grain yield, but does not provide information on the underlying determinants of the variation. It is, however, evident that there are major differences in the way the yield is built up in different parts of a field, i.e. structure of the yield components. The data on, for example, the proportions of the yield-determining components such as head bearing shoots and tiller numbers, grain numbers in heads and single grain weight (SGW) are scarce. Therefore, the primary aim of the present study was to examine the degree of variation in biomass, yield, yield component structure and grain protein by collecting crop samples from low, intermediate and high-yielding patches of commercial spring barley (Hordeum vulgare L.) fields. In addition there was interest in estimating the degree of within-sample variation in the measured traits compared with that between the field patches and to establish whether there are any common traits strongly associated with detected intra-field differences in yielding ability.
MATERIALS AND METHODS
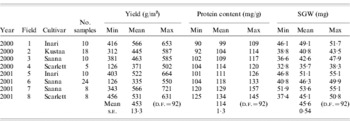
To attain true field-scale conditions and variation, the experiment was carried out in fields of commercial malting barley producers. Plant samples were collected from the fields of commercial farmers located in southern Finland in 2000 and 2001 (Table 1). Farmers cultivated their fields using their own standard cultivation and management methods, thus the experiment was not a traditional controlled field experiment. However, the cultivation methods were largely very similar: in all fields seeds were incorporated with the seed drill (125 mm row spacing), aiming for 500 viable seeds/m2. Compound fertilizer was applied simultaneously with the seed (250 mm row spacing) at an average N rate of 90 kg/ha. In field 7, the farmer provided two supplementary N fertilizer rates in addition to the standard N rate: zero and double N rate for a restricted area (2·5×15 m). Soils were characteristically mineral soils. The malting barley cultivars used in the study were the two-row cultivars Inari, Kustaa, Saana and Scarlett. Selection of low, intermediate and high yielding patches (5–24 patches per field, depending on the field) for plant sample (0·5 m2) collection and analysis was based on visual evaluation of two aerial infrared colour images, taken 3 weeks apart from about 1000 m during the growing season. Visual analysis was considered to be accurate enough for selection of sampling locations as higher biomass areas usually show up as a more intensive red colour in infrared colour images than low biomass areas. The film used was Kodak Aerochrome II Infrared Film 2443. Wavelengths shorter than 525 nm were filtered out. The image data were also compared to sample data in order to establish how well the data predicted yield in sample locations. For this purpose, images were scanned to a ground resolution of 0·5 m and georegistered using official field boundaries determined by the Finnish Ministry of Agriculture. The digital image data (i.e. colour digits for red, green and blue bands) for the sample locations were extracted and a vegetation index was calculated using an equation: (red−green)/(red+green). The red band of an infrared colour film responds mainly to near infrared light and the green band to red light. Thus, this equation approximates to a well known normalized vegetation index (Asrar et al. Reference Asrar, Fuchs, Kanemasu and Hatfield1984). The change in vegetation index between two successive images for the same location was compared to the 0·5 m2 sample yield data.
Year, field number, cultivar, number of plant samples, mean, minimum and maximum values for grain yield, grain protein and SGW

When plant stands were yellow ripe (Zadoks GS 91), 8×0·5 m (=0·5 m2) selected patches were sampled from each field expressing differences in biomass accumulation on the basis of visual evaluation of the aerial infrared colour images. Plants were uprooted to enable division into main shoot and tillers. Plant samples were dried to approximately 100 g moisture/kg before storage. Intact plants (30 per patch in 2000 and 50 per patch in 2001) were hand-threshed to determine individual main shoot and tiller phytomass (mg/plant), tiller number/main shoot, tiller weight (mg/plant), head weight (mg grains/plant), number of grains/head, number of grains/m2, harvest index (HI; grain to straw ratio) and SGW (mg) separately on main shoots and individually on each tiller. Furthermore, when grain number in heads exceeded eight, grain weight (mg) of the second uppermost grain, middle grain and second lowermost grain in each head was determined. After individual yield component analyses, the remainder of the 0·5 m2 sample was scaled to measure phytomass and heads were threshed with a single head thresher to obtain the total grain weight. Subsequently total phytomass (g/m), grain yield (g/m) and total number of main shoot and tiller heads/m2 were calculated. Grain protein content (mg/g dry matter) was analysed using the Kjeldahl-method using a Tecator Keltec Auto 1030 Analyser (AOAC 1980). Hand and machine threshed grains were mixed and used in quality analyses. In 2001, an additional 6×0·5 m2 areas were sampled (fields 7 and 8, Table 1) just prior to heading, to measure total above-ground biomass (g/m2) and nitrogen (N) accumulation to leaves and stems (g N/m2). Also, main shoot and tiller number and leaf area index (LAI) (Hayashi Denkoh Co. Ltd. Tokyo, Japan) were determined. Single grain protein (SGP) content (mg/g) was determined using a Leco® FP-428 Analyzer (St. Joseph, USA). Single grain β-glucan was determined from the samples of the crop in 2000 only, according to Analytica EBC (EBC 1998), but the method was modified for small samples as described in Home et al. (Reference Home, Wilhelmson, Tammisola and Husman1997). Grain protein content, SGP and single grain β-glucan are presented as mg/g dry weight. Grain size distribution (>2·8, >2·5, >2·2 and <2·2 mm) was determined according to Analytica EBC (EBC 1998) method 3.11.1.
Statistical analyses were carried out with Statistical Analysis System (SAS Institute 1985). Means and standard deviations (PROC MEANS) were calculated for measured yield component traits. Box-plot images were drawn to visualize the degree of variation within the sample. Standard deviations of measured traits were plotted against the grain yield and protein content corresponding to each patch to compare variation within the field.
RESULTS
Yield formation and aerial infrared colour images
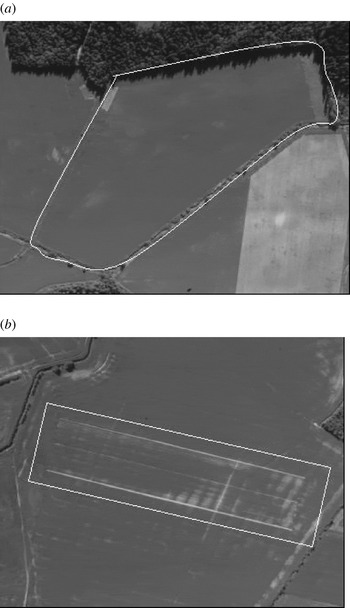
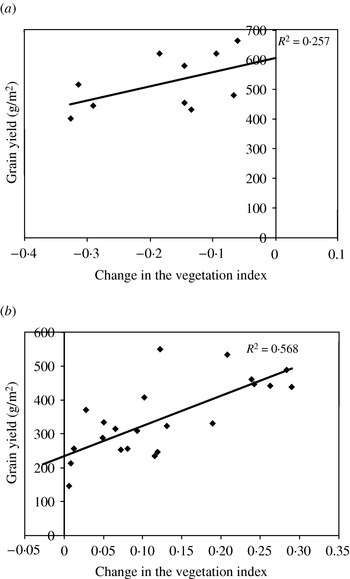
Grain yield (g/m2) varied predictably within the fields (Table 1) as the sample collection criterion was to select patches of varying yield potential. The lowest grain yield recorded was 126 g/m2 and the highest 721 g/m2 (Table 1). Figure 1 shows aerial infrared colour images of two fields (5 and 6) that clearly contrasted in canopy variation. The relationship between the change in vegetation index and grain yield in the sample location is shown in Fig. 2. As expected, this association was more evident in field 6, as the yield ranged from 126–550 g/m2, whereas the association and yield range were weaker for field 5 (Table 1).
Aerial images of fields no. 5 (b) with high canopy variation and 6 (a) with low canopy variation.

The relationship between the change of the vegetation index of each sample location in fields 5 (b) and 6 (a).

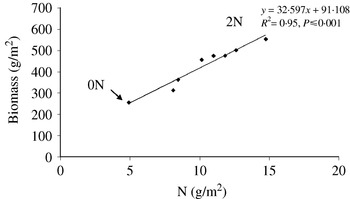
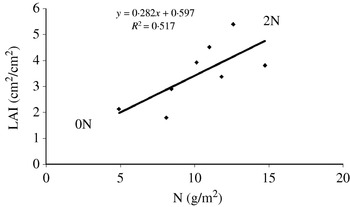
Early growth reflected the grain yield, as phytomass measured prior heading correlated with grain yield in field 7 (r=0·79, P⩽0·05), whereas the correlation coefficient for N accumulation (g/m2) and grain yield was only just statistically significant (r=0·71). Nitrogen accumulation (g/m2) was strongly correlated with biomass accumulation (r=0·97, P⩽0·001), expressing differences in growth potential in field 7 (Fig. 3). Likewise, leaf area was associated with N accumulation (r=0·72, P⩽0·05, Fig. 4). Among other growth resources, N availability probably contributed to the recorded differences in growth potential. This was emphasized as additional fertilizer windows, with either zero or double N rate in patches 1 and 2 (marked with an arrow in the figures), had a marked effect on biomass and N accumulation (g/m2), as did LAI (Fig. 4). But N availability was not the sole or the dominant factor contributing to the differences, as plant tissue N concentration did not vary markedly in different field patches and hence it did not associate with the biomass accumulation (data not shown).
Nitrogen and biomass accumulation (g/m2) prior to heading in the field 7. Zero and double N rate is pointed out by an arrow.

Nitrogen accumulation (g/m2) and LAI prior to heading in field 7. Zero and double N rate is pointed out by an arrow.

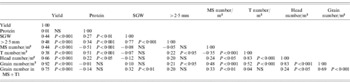
The principal yield determining trait in two-row barley was the grain number/m2, followed by grain number in the main shoot and first tiller head, and total number of heads/unit land area. However, SGW had a negligible effect on the grain yield (Table 2).
Correlation coefficients for grain yield, protein and various yield traits

>2·5 mm, grain proportion over 2·5 mm grade; MS, main shoot; T, tiller; T1, first tiller; NS, not significant.
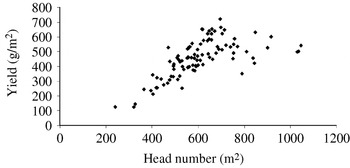
Main shoot heads produced the majority of the yield, as the tiller-produced grain yield comprised 0·23 of total yield in average, but ranged widely from 0 to 0·58. According to the data, head number correlated (r=0·85, P⩽0·001) with grain yield up to 700 heads/m2 (Fig. 5). When head number exceeded 750/m2, the grain yield response levelled off or diminished (Fig. 5).
Pooled association between grain yield and head number/m2.

Variation in the quality parameters
In addition to yield formation parameters, those for quality also varied, although not in parallel with the variation in grain yield (Table 1). Grain protein content is an important quality parameter for malting barley. This varied between and within the studied fields, the mean values ranging from 99–134 mg/g. However, no association between grain protein content and grain yield was found (Table 2). Pooled correlation analysis indicated a negative correlation between grain protein content and main shoot number, and positive correlation between grain protein content and tiller number (Table 2). The grain protein content was notably higher in 2001 compared with 2000 (Table 1).
SGW varied between and within the studied fields, the mean values ranging from 35·7–53·6 mg (Table 1). When the degree of within-sample variation in SGW was visualized by box-plot images and by scatter plots of standard deviation of SGW plotted against grain yield and protein of that particular plant sample, no trend or association was found between the degree of variation in SGW and grain yield or grain protein (data not shown).
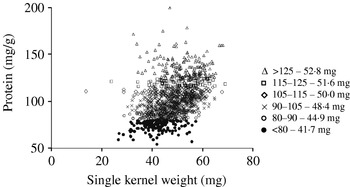
Variation in single kernel protein (SKP) content and single kernel weight (SKW) was studied in more detail by analysing individual single kernels within the plant sample. In general, SKW and SKP content were not correlated. However, in some samples, the mean SKW increased with increasing protein content when data were divided into different protein groups (<80, 80–90, 90–105, 105–115, 115–125, >125 mg/g kernel protein; Fig. 6). This somewhat contradicts the general assumption that larger grains contain less protein. No trend or association was found between the degree of variation in SGP content and grain yield (data not shown). The standard deviation of SKP content (mg/g) varied between 6·7 and 22.
Association between SKW and SKP in the field no. 3. Average SKW of protein groups shown next to the protein legend.

It was found that the degree of variation was smaller in single kernel β-glucan than in SGP. The single grain β-glucan content varied between 30 and 42 mg/g in the pooled data. In fields 1 and 3 there was a positive correlation between β-glucan content and yield. The degree of variation in β-glucan content did not correlate with yield or kernel weight.
DISCUSSION
Aerial images reveal yield variation
Grain yield varied predictably within the fields. In this sense, the aerial images provided reasonably good estimates of grain yield for the selected field patches and remote sensing data can be used for locating areas within a field that support differing plant growth patterns, as established previously (Plant et al. Reference Plant, Munk, Roberts, Vargas, Rains, Travis and Hutmacher2000; Dobermann & Ping Reference Dobermann and Ping2004; Zarco-Tejada et al. Reference Zarco-Tejada, Ustin and Whiting2005). However, the smaller the variation within the field, the more difficult it was to detect it with remote sensing data. In addition, when the LAI reaches a level of about 4, canopy differences cannot be detected using image data (Serrano et al. Reference Serrano, Filella and Penuelas2000; Hoffmann & Blomberg Reference Hoffmann and Blomberg2004). The leaves at the top of the canopy cover the lower leaves and thus it is not possible to see how many leaf layers exist in the canopy. This practically restricts the usefulness of aerial images at advanced growth stages when LAI exceeds 4. The change is mainly negative in Fig. 2 a and positive in Fig. 2 b. This was because both images for field 5 were taken when leaf area was still increasing, whereas the second image from field 6 was taken at a time when the leaf area was already decreasing due to senescence of lower leaves. Moreover, even the lowest yields from field 5 were relatively high and such yields require reasonable leaf area.
Figure 1 indicates that remote sensing data can be used for locating areas within a field where there are problems in crop growth and where further analysis and management planning can be applied to the problems. However, in the short and intensive growing cycle of spring malting barley in northern latitudes, there is hardly any time for corrective action and management during the growing season. Therefore, the likely primary use of aerial images is to provide back-up information to the farmer in management planning for the subsequent year, even though the usefulness of field-scale yield maps for such a purpose have been questioned (Blackmore et al. Reference Blackmore, Godwin and Fountas2003; Welsh et al. Reference Welsh, Wood, Godwin, Taylor, Earl, Blackmore and Knight2003). If images reveal an area of poor growth and hence a likely increased risk of poor quality (=high protein) for that area, the farmer could use the image for decision making in harvesting; the poor yielding area could be harvested separately for feed rather than malting.
Some of the observed variation in the present data probably originated from changing soil characters within the field, as pointed out by Timlin et al. (Reference Timlin, Pachepsky, Walthall and Loechel2001) and Taylor et al. (Reference Taylor, Wood, Earl and Godwin2003). However, the regular variation pattern seen in field 6 probably resulted from uneven tillage that caused variation in plant stands and consequently in grain yield in this particular field (Fig. 1, Table 1). Inconsistent management is particularly unwanted under the conditions of a short growing period. Due to long days, plant development and growth is intensive throughout the growing cycle, leaving little time for compensatory growth (Peltonen-Sainio Reference Peltonen-Sainio, Smith and Hamel1999).
The availability of N and water are prominent factors dominating growth and yield formation in crop plants (Baethgen et al. Reference Baethgen, Christianson and Lamothe1995; Kätterer et al. Reference Kätterer, Ekersten, Andrén and Pettersson1997; Boonchoo et al. Reference Boonchoo, Fukai and Hetherington1998; Vold Reference Vold1998; Timlin et al. Reference Timlin, Pachepsky, Walthall and Loechel2001; James & Godwin Reference James and Godwin2003). Biomass and N accumulation were correlated in field 7, indicating a relatively stable concentration of N in plants collected from patches having varying growth potential (Figs 3 and 4). Reasonably high tissue N concentrations (around 25 g N/kg dry matter), measured just prior to the heading, indicate that the N status or availability had probably not been the primary factor limiting growth (Justes et al. Reference Justes, Mary, Meynard, Machet and Thelier-Huche1994; Jones Reference Jones1998; Lawlor et al. Reference Lawlor, Lemaire, Gastal, Lea and Morot-Gaudry2001). Furthermore, low prevailing temperatures in autumn and spring, and freezing of the soil during winter, reduce N mineralization in Finland. Typically, Finnish clay soils contain relatively low amounts of N available for the plants prior to sowing, ranging from 20–30 kg N/ha (Sippola & Yläranta Reference Sippola and Yläranta1985). This supports the assumption that the reason for the different growth potential of the patches probably did not originate from varying N availability at sowing.
Grain number dominates yield formation
Grain number dominated yield formation (Table 2). The dominance of grain number over SGW in determining final grain yield is a common feature in barley (Smith et al. Reference Smith, Dijak, Bulman, Ma, Hamel, Smith and Hamel1999; García del Moral et al. Reference García del Moral, García del Moral, Molina-Cano and Slafer2003; Prystupa et al. Reference Prystupa, Savin and Slafer2004; Peltonen-Sainio et al. Reference Peltonen-Sainio, Kangas, Salo and Jauhiainen2006). The grain number in the heads of the two-row barley is less responsive compared with inflorescences of oat (Avena sativa L.) and wheat (Bonnett Reference Bonnett1961; Kirby & Appleyard Reference Kirby and Appleyard1984; Peltonen-Sainio & Peltonen Reference Peltonen-Sainio and Peltonen1995); however, this is probably compensated for by better ability to produce head-bearing tillers. The development rate of cereal crops is primarily controlled by daylength (Langer Reference Langer1979; Jones & Allen Reference Jones and Allen1986). Under a long photoperiod, spikelet initiation rate is enhanced but the duration is shortened, resulting in fewer spikelets compared with under a longer photoperiod (Cottrell et al. Reference Cottrell, Dale and Jeffcoat1982; Hutley-Bull & Schwabe Reference Hutley-Bull, Schwabe and McLaren1982; Craufurd & Cartwright Reference Craufurd and Cartwright1989). In the present experiment, the maximum grain number in the main shoot head rarely exceeded 22, which probably represented the maximum for modern two-row barley cultivars grown under northern growing conditions. In these conditions, the vegetative period (i.e. leaf and tiller initiation) of spring cereals is very short, initiation of floral parts beginning typically at the two-leaf stage, independent of genotype (Peltonen-Sainio & Peltonen Reference Peltonen-Sainio and Peltonen1995; Peltonen-Sainio & Rajala Reference Peltonen-Sainio and Rajala2007). Accordingly, a long photoperiod associated with high seeding rate suppresses the yield potential of tillers, as grain number in tiller heads was clearly lower compared with number of grains in main shoot heads (data not shown). This was also demonstrated in oat grown in high latitudes (Peltonen-Sainio & Järvinen Reference Peltonen-Sainio and Järvinen1995).
When the maximum grain number/head is restricted and SGW plays a secondary role, the essential component in yield formation in two-row barley is the number of grain bearing heads/unit land area (Smith et al. Reference Smith, Dijak, Bulman, Ma, Hamel, Smith and Hamel1999; García del Moral et al. Reference García del Moral, García del Moral, Molina-Cano and Slafer2003). Typically, Finnish farmers aim to sow approximately 500 viable seeds/m2, resulting in main shoot dominance in yield production. A relatively high seeding rate does not allow for much tillering. Typically, 200–300 tiller heads are produced at 500 seeds/m2. In addition to the lower grain number recorded for tiller heads, a lower SGW from tiller heads compared with those from main shoots was also noted (data not shown). Thus, a smaller proportion of the tiller-produced grains meets malting grading requirements. Therefore, in terms of optimizing grading requirements, under northern growing conditions most of the grain yield should preferably be produced by main shoots. This requirement may be applicable particularly to growing conditions characterized by intensive development and growth. Under growing conditions of a longer vegetative period, only minor differences were recorded for SGW of main shoot and primary tillers of barley grown in the field, possibly due to more uniform development and growth between main shoot and tillers (Lauer Reference Lauer1991; Wade & Froment Reference Wade and Froment2003).
When head number exceeded 750/m2, the grain yield response levelled off or diminished (Fig. 5). The reason for this could be that the higher head number means excessive interplant competition, which tends to result in slightly lighter grains, although this association was rather weak and not statistically significant (Table 2). SGW and head and grain number/m2 are often slightly negatively correlated (Wych et al. Reference Wych, Simmons, Warner, Kirby and Rasmusson1988; Baethgen et al. Reference Baethgen, Christianson and Lamothe1995; Wade & Froment Reference Wade and Froment2003; Prystupa et al. Reference Prystupa, Savin and Slafer2004). In the present data, SGW and grain number/m2 and grain number/individual plant were not negatively associated (Table 2). This indicates that, in general, grain number/individual plant or unit land area did not exceed the potential capacity of the plant canopy to fill the grains. Thus, the recorded grain number seemed to be in relatively good balance with the prevailing growing conditions and capacity of each field patch.
Relationship between yield and protein
No association was found between grain protein content and grain yield (Table 2). Hence, measured grain protein varied irrespective of the grain yield within the studied fields. Lack of association or poor association between grain yield and grain protein content has been noted in other studies (Bertholdsson Reference Bertholdsson1999; Engel et al. Reference Engel, Long, Carlson and Meier1999; Przulj & Momcilovic Reference Przulj and Momcilovic2001; Skerritt et al. Reference Skerritt, Adams, Cook and Naglis2002). Yield and protein responses to N are known to vary considerably; in general, increases in yield result in decreases in grain protein (Boonchoo et al. Reference Boonchoo, Fukai and Hetherington1998), though the responses are greatly affected by environmental conditions (Birch et al. Reference Birch, Fukai and Broad1997; Bertholdsson Reference Bertholdsson1999). When assuming increasing N availability, three different yield and protein response schemes are potential/possible: (1) where the plant stand is fully utilizing N for growth and improved yield capacity, grain protein content will decrease; (2) where the yield response is weakening, grain protein will remain unchanged and (3) where the yield response has levelled off, grain protein will increase (Borghi Reference Borghi, Satorre and Slafer1999). Because of potential protein risk in malting barley, most of the available N should be taken up and utilized prior to the grain filling to build up the canopy and yield structures. Poor plant-stand establishment and inadequate growth are probably associated with incomplete utilization of nutrients prior to heading. When there is abundant N available at grain filling, N is prone to end up in the filling grains, elevating grain protein content (Boonchoo et al. Reference Boonchoo, Fukai and Hetherington1998; Przulj & Momcilovic Reference Przulj and Momcilovic2001). This is likely to occur in the uniformly fertilized field characterized with uneven plant stand and growth. Accordingly, pooled correlation analysis of the present data indicated a negative correlation between grain protein content and main shoot number, and positive correlation between grain protein content and tiller number (Table 2). This indicates a situation of low and/or irregular seedling emergence, possibly due to uneven tillage or sowing, or varying soil characteristics. In patches with poor seedling emergence, more N is available to each individual plant, which may result in higher grain protein. Also, at lower plant densities tillers have more space and resources, which favours their growth. According to Wade & Froment (Reference Wade and Froment2003), lower plant densities are associated with increased grain protein in spring malting barley, which is in accordance with the present findings concerning main shoot and tiller number and their association with grain protein under long day conditions.
The grain protein content was notably higher in 2001 compared with 2000 (Table 1). This was not due to a higher fertilizer rate or a lower grain yield in 2001. However, there was a difference in temperature regime – the grain filling period of 2001 was characterized by temperatures above the long-term average (the accumulated temperatures for July were 320°C days in 2000 and 417°C days in 2001; the long-term average for July is 346°C days). Post-anthesis high temperatures and water stress contribute to increased risk of high grain protein content, especially at high N application rates (Fathi et al. Reference Fathi, McDonald and Lance1997; Boonchoo et al. Reference Boonchoo, Fukai and Hetherington1998; Passarella et al. Reference Passarella, Savin and Slafer2002). A likely explanation for the high protein level is stress-induced reduction in dry mass accumulation to the grains (Savin et al. Reference Savin, Stone, Nicolas and Wardlaw1997; Wallwork et al. Reference Wallwork, Logue, MacLeod and Jenner1998; Passarella et al. Reference Passarella, Savin and Slafer2002). This results in increased grain protein, especially as the grain N accumulation seems to be less sensitive to environmental factors (Savin et al. Reference Savin, Stone, Nicolas and Wardlaw1997; Passarella et al. Reference Passarella, Savin and Slafer2002). However, in the present data, higher temperature at grain filling in 2001 apparently did not reduce dry matter accumulation to the grains as SGW were equal in both years and grain yields were comparable (Tables 1 and 2). One potential explanation for elevated protein is that higher temperature during the grain filling period enhanced soil microbiological activity, promoting mineralization of N (Aulakh et al. Reference Aulakh, Doran, Walters, Mosier and Francis1991), which easily ends up in to the grain (Boonchoo et al. Reference Boonchoo, Fukai and Hetherington1998; Przulj & Momcilovic Reference Przulj and Momcilovic2001). Data collected by Finnish Food Safety Authority (www.evira.fi) revealed a positive correlation between average air temperature in July and grain protein content in malting barley samples (data not shown). Also, in this same data set, the temperature in July did not associate with yield or SGW (data not shown). This extensive data comprising hundreds of samples per year (1996–2006) supports the present authors' hypothesized associations between protein, SGW and yield.
The correlation coefficient of SGW with grain yield and grain protein content was quite low (Table 2). This indicates that, in general, SGW appears to associate poorly with quantity and quality (in terms of protein formation) in two-row barley grown under northern growing conditions. Even though the association between SGW and grain protein content was weak, the close association of SGW with grading makes it a highly important quality trait for malting barley. When the degree of within-sample variation in SGW was visualized by box-plot images and by scatter plots of standard deviation of SGW plotted against grain yield and protein of that particular plant sample, no trend or association was found between the degree of variation in SGW and grain yield or grain protein (data not shown). The degree of variation, which was evaluated as degree of deviation of the values around their arithmetical mean, varied without being correlated to yield potential. This finding suggests that within-field variation in yield potential does not determine heterogeneity of grain yield in terms of grain weight. Similar results have been published for wheat, for which SGW and grain protein content, and variation in these traits, was not associated with grain yield (Engel et al. Reference Engel, Long, Carlson and Meier1999; Skerritt et al. Reference Skerritt, Adams, Cook and Naglis2002).
Protein content and grain weight was determined also at individual kernel level. Variation in SKP content in the plant sample was measured using a Leco nitrogen analyser. In general, SKW and SKP content were not correlated. However, in some samples, the mean SKW increased with increasing protein content when data were divided into different protein groups (<80, 80–90, 90–105, 105–115, 115–125, >125 mg/g kernel protein; Fig. 6). This somewhat contradicts the general assumption that larger grains contain less protein. No trend or association was found between the degree of variation in SGP content and grain yield (data not shown). The standard deviation of SKP content (mg/g) varied between 6·7 and 22. Similar standard deviations were reported previously for barley samples from small plots (Home et al. Reference Home, Wilhelmson, Tammisola and Husman1997).
Low β-glucan content is generally desirable for malting barley. The β-glucan has to be enzymatically hydrolysed during the malting process to ensure good brewing properties for the malt. A high degree of variation in single kernel β-glucan content can result in heterogeneous malt, with unpredictable brewing performance. The present work found that the degree of variation was smaller in single kernel β-glucan than in SGP. The single grain β-glucan content varied between 30 and 42 (mg/g) in the pooled data. In fields 1 and 3 there was a positive correlation between β-glucan content and yield. The degree of variation in β-glucan content did not correlate with yield or kernel weight.
In conclusion, aerial infrared colour images revealed within-field variation in yield potential. Thus, the farmer can use them to locate areas of problematic crop growth and to assist in analysis and management planning for that particular field. Grain protein content and SGW varied, but irrespective of the variation in grain yield. Accordingly, in terms of degree of variation, there was no association between yield and these two important quality traits. Thus, homogeneity of yield seems to develop independently of yield formation. In two-row barley, yield formation is dominated by grain number/m2 and grain number in main shoot and first tiller head, whereas the SGW plays a smaller role.
Erja Kotaviita, Juhani Olkku, Erkki Rytsä, Hannu Mikkola and Christian Eriksson are warmly thanked for their help and collaboration during the study.