INTRODUCTION
Leishmania donovani, an obligatory digenetic parasite, is the aetiological agent of human visceral leishmaniasis (VL) (Murray et al. Reference Murray, Berman, Davies and Saravia2005). Recognition and entry into macrophages are important events in the life cycle of Leishmania sp. that involves several complex phenomena that are not completely understood. Glycoconjugates have been characterized in Leishmania species namely L. adleri (Palatnik et al. Reference Palatnik, Previato, Gorin and Mendonga-Previato1985), L. major (Handman et al. Reference Handman, Greenblatt and Golding1984), L. mexicana (Russell and Wilhelm, Reference Russell and Wilhelm1986), L. tarentolae (Xavier et al. Reference Xavier, Previato, Gorin and Mendonga-Previato1987), and L. donovani (Turco et al. Reference Turco, Hull, Orlandi, Sheperd, Homans, Dwek and Rademacher1987) and suggested to participate in adhesion of parasites into host cells (Dwyer et al. Reference Dwyer, Langreth and Dwyer1974). Studies have shown that mannose-fucose- and mannose-phosphate-present on the parasite surface might be involved in entry of L. donovani promastigotes into macrophages (Wilson and Hardin, Reference Wilson and Hardin1988).
Sialic acids (SA), typically present as terminal residues on glycoproteins and glycolipids, play a significant role in many biological phenomena and have been interesting targets for sialoglycotherapeutics (Kamerling et al. Reference Kamerling, Schauer, Shukla, Stoll, Van Halbeek and Vliegenthart1987; Ghoshal et al. Reference Ghoshal, Mukhopadhyay and Mandal2008). Amongst diverse structural modifications of sialic acid, N-acetylneuraminic acid (Neu5Ac), O-acetyl substitutions are common and 9-O-acetylated sialic acid (9-O-AcSA) predominates, generating a family of 9-O-acetylated sialoglycoconjugates (9-O-AcSGs) (Schauer et al. Reference Schauer2000). Previous reports from our group have demonstrated the presence of 9-O-AcSA as a surface constituent of virulent AG83 (Chatterjee et al. Reference Chatterjee, Chava, Kohla, Pal, Merling, Hinderlich, Unger, Strasser, Gerwig, Kamerling, Vlasak, Crocker, Schauer, Schwartz-Albiez and Mandal2003; Mukhopadhyay and Mandal, Reference Mukhopadhyay and Mandal2006; Bandyopadhyay and Mandal, Reference Bandyopadhyay and Mandal2008); however, their role, if any, with regard to infectivity still remains unexplored. This prompted us to explore the distribution of this unique sugar in avirulent vs virulent strains and accordingly, the study therefore attempts to (i) compare the differential presence of 9-O-AcSA in promastigotes of avirulent (UR6) vs virulent (AG83, GE1, NS1, NS2); (ii) explore the role of 9-O-AcSA in the entry of promastigotes into macrophages and (iii) compare metacyclic avirulent vs virulent L. donovani promastigotes with regard to 9-O-AcSA.
MATERIALS AND METHODS
Parasites and macrophages
Several attempts in the past to induce visceral infection by intracardiac inoculation with UR6 (MHOM/IN/78/UR6) have failed (Mukhopadhyay et al. Reference Mukhopadhyay, Bhattacharyya, Majhi, De, Naskar, Majumdar and Roy2000); accordingly UR6 was cultured (Ray, Reference Ray1932) has been considered as ‘avirulent’ owing to its poor ability to infect and multiply within macrophages (Mukhopadhyay et al. Reference Mukhopadhyay, Sena, Bhattacharyya, Majumdar and Roy1999, Reference Mukhopadhyay, Bhattacharyya, Majhi, De, Naskar, Majumdar and Roy2000).
Virulent strains studied included MHOM/IN/83/AG83, MHOM/IN/90/GE1, NS1, NS2 cultured at 22°C in M-199 medium containing HEPES buffer (20 mm, pH 7·5) supplemented with 10% heat-inactivated fetal calf serum (HIFCS) and antibiotics (penicillin 100 U/ml and streptomycin 100 μg/ml). Virulence was maintained by routinely passaging the parasites in hamsters.
Log-phase promastigotes were obtained from 2-day cultures whereas metacyclic promastigotes were purified from 5 to 6-day stationary cultures by treatment with peanut agglutinin (PNA; Vector Labs, Inc., Burlingame, USA). Briefly, stationary promastigote cultures washed in M-199 medium were resuspended at 108/ml, and incubated with 100 μg/ml of PNA (Sacks et al. Reference Sacks, Pimenta, McConville, Schneider and Turco1995) for 30 min; the suspension was centrifuged at 40 g for 5 min, non-agglutinated promastigotes (PNA-negative) in the supernatant fraction were collected, washed twice by centrifugation at 2100 g for 5 min and were used in this study. Unless specified, all assays were performed with stationary-phase promastigotes.
Murine (Balb/C) peritoneal macrophages were collected and processed for the subsequent assays (Chava et al. Reference Chava, Bandyopadhyay, Chatterjee and Mandal2004a).
Fluorimetric high-performance liquid chromatography (HPLC) for the estimation of sialic acids
Promastigotes (2×10⁹) from AG83 and UR6 were extensively washed in PBS (0·02 m, pH 7·2). The pellet was lyophilized and subjected to mild acid hydrolysis with acetic acid (2 m, 200 μl) for 3 h at 80°C to release SA. Aliquots of the free SA-containing samples were derivatized with 1,2-diamino-4,5-methylenedioxybenzene (DMB) (Hara et al. Reference Hara, Yamaguchi, Takemori, Furuhata, Ogura and Nagamura1989; Chatterjee et al. Reference Chatterjee, Chava, Kohla, Pal, Merling, Hinderlich, Unger, Strasser, Gerwig, Kamerling, Vlasak, Crocker, Schauer, Schwartz-Albiez and Mandal2003; Chava et al. Reference Chava, Chatterjee, Gerwig, Kamerling and Mandal2004b). The labelled SA was analysed on a Cosmosil 5C18-AR-II column (4·6×250 mm; Waters) using acetonitrile/methanol/water (9:7:84, v/v/v). Fluorescence was detected using an excitation and emission wavelength of 373 nm and 448 nm, respectively. DMB derivativatized authentic Neu5Ac (Sigma, MO, USA) and liberated SA from bovine submanidular mucin (BSM) served as an internal standard.
MALDI-TOF-MS of Neu5Ac and Neu5Gc
Corresponding peaks of purified DMB-derivatized Neu5Ac from AG83 and Neu5Gc from UR6 promastigotes were collected after fluorimetric HPLC and lyophilized for further analysis. Each fraction was dissolved in water (2–20 pmol/μl) and directly analysed by MALDI-TOF-MS (Applied Biosystem, USA). The samples were prepared by the dried-droplet procedure using 2,5-dihydroxybenzoic acid (10 μg/μl, DHB, Sigma) in ethanol (60%) as matrix (Stehling et al. Reference Stehling, Gohlke, Fitzner and Reutter1998). Typically, an equal volume of this matrix was mixed with DMB-sialic acids and 0·5 μl was placed on the target. All mass spectra were recorded in the positive ion mode using the reflector. The ion acceleration potential and the potential in the reflector were 10·5 kV and 9·7 kV respectively. The acquired spectra were the average of 1000 laser shots.
Purification of Achatinin-H, a 9-O-AcSA binding lectin
Bovine submandibular glands, procured locally, were used as a source to purify BSM as previously described (Chatterjee et al. Reference Chatterjee, Sharma, Mandal, Sundar and Sen1998). 9-O-AcSA (%) was determined by subtracting the relative unsubstituted SA from that obtained after de-O-acetylation (Sharma et al. Reference Sharma, Chatterjee, Mandal, Sen and Basu1998). BSM was then coupled to Sepharose 4B (Chatterjee et al. Reference Chatterjee, Sharma, Mandal, Sundar and Sen1998). Achatinin-H was purified from the haemolymph of the common giant African land snail Achatina fulica by affinity chromatography using BSM coupled to Sepharose 4B as an affinity matrix (Sen and Mandal, Reference Sen and Mandal1995). Lectin binding of Achatinin-H was checked by haemagglutination (Sen and Mandal, Reference Sen and Mandal1995), its carbohydrate binding specificity towards 9-O-AcSA examined by haemagglutination inhibition using mono- and disaccharides as also several sialoglycoproteins as inhibitory reagents (Sen and Mandal, Reference Sen and Mandal1995; Sinha et al. Reference Sinha, Bhattacharya and Mandal1999; Pal et al. Reference Pal, Ghosh, Mandal, Kohla, Brossmer, Isecke, Merling, Schauer, Schwartz-Albiez, Bhattacharya and Mandal2004).
Estimation of total sialic acids and 9-O-acetylated sialic acid
Sialic acids present on washed promastigotes (AG83, GE1, NS1, NS2 and UR6) were fluorimetrically quantitated separately (Shukla and Schauer, Reference Shukla and Schauer1982; Sharma et al. Reference Sharma, Chatterjee, Mandal, Sen and Basu1998). Briefly, samples were oxidized with sodium metaperiodate (200 μl, 2·5 mm) in buffer A [NaCl (3 g), KCl (0·2 g), disodium hydrogen phosphate dehydrate (1 g), and sodium dihydrogen phosphate monohydrate (0·15 g), potassium dihydrogen phosphate (0·2 g) per litre, pH 7·2] at 4°C for 15 min in the dark. After centrifugation (12 000 g for 5 min), the supernatants (400 μl) were mixed with sodium arsenite (100 μl, 2% in 0·5 m HCl) and 300 μl of acetyl acetone solution (0·075 ml of glacial acetic acid, 0·05 ml of acetyl acetone, and 3·75 g of ammonium acetate in a final volume of 25 ml of double-distilled water). The mixtures were incubated at 60°C for 10 min and the samples (0·7 ml) were diluted with 1·8 ml of double-distilled water. The relative fluorescence intensity [(excitationmax=410 nm), (emissionmax=510 nm)] of each sample was measured against reagent blanks. The 9-O-AcSA (%) was determined by subtracting the relative unsubstituted sialic acids from that obtained after de-O-acetylation.
Preparation of de-O-acetylated and de-sialylated promastigotes
To remove surface 9-O-AcSA from AG83 (1×10⁶), promastigotes were incubated with 9-O-acetyl haemagglutinin esterase of influenza C virus (100 U/ml, 100 μl/ tube) containing recombinant protein for 1 h at 20–25°C (Vlasak et al. Reference Vlasak, Krystal, Nacht and Palese1987; Chatterjee et al. Reference Chatterjee, Chava, Kohla, Pal, Merling, Hinderlich, Unger, Strasser, Gerwig, Kamerling, Vlasak, Crocker, Schauer, Schwartz-Albiez and Mandal2003). De-O-acetylated cells were then washed and processed for lectin-binding studies. For removal of SA, esterase-treated cells were washed and incubated overnight with Arthrobacter ureafaciens sialidase (50 μl, 10 U/ml, Roche, Germany) at 37°C. The viability of the enzyme-treated promastigotes was routinely checked by microscopical examination. Further confirmation of the viability was checked by the colorimetric MTT assay as described elsewhere (Dutta et al. Reference Dutta, Mandal, Mandal and Chatterjee2007).
Flow cytometry
To examine the presence of sialic acids on the surface of promastigotes of AG83 and UR6, two sialic acid-binding lectins, Sambucus nigra agglutinin (SNA) and Maackia amurensis agglutinin (MAA) (5 μl, 5 μg/ml, Vector Labs, Burlingame, USA), that recognize (α2→6)- and (α2→3)-sialogalactosyl residues, respectively, were used (Chatterjee et al. Reference Chatterjee, Chava, Kohla, Pal, Merling, Hinderlich, Unger, Strasser, Gerwig, Kamerling, Vlasak, Crocker, Schauer, Schwartz-Albiez and Mandal2003).
Achatinin-H was labelled with fluorescein 5′-isothiocyanate (FITC) by following the method of (Coligan et al. Reference Coligan, Kruisbeek, Margulies, Shevach and Strober1993). Briefly, FITC (20 μl, 5 mg/ml) for each mg of protein in dimethyl sulphoxide was incubated in the dark for 2 h at 20°C in borate buffer (50 mm, pH 9·0). Subsequently, the unbound FITC was removed by gradual dialysis with 2–3 changes in borate buffer at 4°C for at least 2 days and the stochiometry of coupling determined before use (García-Barrado et al. Reference García-Barrado, Gata, Santano, Solís, Pinto and Macías1999). The differential presence of 9-O-AcSA on promastigotes was analysed using FITC-Achatinin-H and analysed by a FACS Calibur flow cytometer using CellQuestPro software (Becton Dickinson, Mountain View, CA). In parallel, the binding of FITC-Achatinin-H with de-O-acetylated promastigotes was also measured (Chatterjee et al. Reference Chatterjee, Chava, Kohla, Pal, Merling, Hinderlich, Unger, Strasser, Gerwig, Kamerling, Vlasak, Crocker, Schauer, Schwartz-Albiez and Mandal2003).
Identification of 9-O-acetylated sialoglycoconjugates by Achatinin-H through ELISA
Promastigotes of different strains (AG83, GE1, NS1, NS2 and UR6) were harvested separately, washed with PBS and the pellet was resuspended in lysis buffer (Tris-HCl 20 mm, NaCl 40 mm, pH 7·2) containing phenylmethylsulfonyl fluoride (2 mm), leupeptin (1 mg/ml), ethylenediamine tetraacetic acid (5 mm), and iodoacetamide (5 mm) (Chatterjee et al. Reference Chatterjee, Chava, Kohla, Pal, Merling, Hinderlich, Unger, Strasser, Gerwig, Kamerling, Vlasak, Crocker, Schauer, Schwartz-Albiez and Mandal2003). The crude promastigote lysate of the individual strains were separately used as the coating antigen (5 μg/ml, 50 μl/well in 0·02 m phosphate buffer, pH 7·8), and binding of Achatinin-H was determined by measuring binding of rabbit anti-Achatinin-H using horseradish peroxidase-conjugated anti-rabbit IgG and 2,2′- Azino-bis (3-ethylbenzthiazoline-6-sulfonic acid) ammonium salt (ABTS) as the substrate at 405 nm.
Quantitation of 9-O-acetylated sialoglycoconjugates on promastigotes by Scatchard analysis
The purified Achatinin-H was iodinated, by chloramine T method (Hunter, Reference Hunter and Weir1978). Achatinin-H (5 μg) was incubated with Na [125I] and chloramine T for 1 min. Subsequently, the reaction was stopped with sodium metabisulfite for 1 min followed by addition of potassium iodide. The radio-isotope-labelled lectin (125I-Achatinin-H) was purified using a Biogel P10 column. The radioactivity was determined using a gamma counter. Promastigotes (5×10⁶) of AG83 and UR6 were incubated with increasing amounts of 125I-Achatinin-H (specific activity being 3·10×105 cpm/μg) in the presence of CaCl2 (0·3 m, 10 μl) and Tris-buffered saline (pH 7·2) containing bovine serum albumin (0·2%) at 4°C for 60 min in the presence or absence of a 50-fold excess of unlabelled-Achatinin-H. 125I-Achatinin-H-bound promastigotes were separated from free 125I-Achatinin-H by layering the mixture onto a 5% sucrose solution followed by centrifugation at 12 857 g for 10 min at 4°C (Bishayi and Samanta, Reference Bishayi and Samanta1996). Promastigote-bound radioactivity in the pellet was measured by a gamma counter. The number of receptors per cell was extrapolated by the intersection of the curve with the x axis, and the K d was obtained by dividing the number of receptors per cell by the bound/free ratio at the y axis intercept. The dissociation constant (Kd) and number of binding sites for Achatinin-H was calculated by the Scatchard plot (Scatchard, Reference Scatchard1949).
Promastigote-macrophage interaction experiments
Murine (Balb/C) peritoneal macrophages were lavaged, washed, resuspended in RPMI containing 10% FCS (Medium A) and plated on to cover-slips (3×10⁵/200 μl/cover-slip). Following an overnight incubation at 37°C, 5% CO2 the non-adherent macrophages were gently removed. To optimize the interaction, macrophages were initially incubated with promastigotes in varying ratios of 1:2, 1:5, 1:10, 1:25, and 1:50 at 37°C for 45 min in medium A. Subsequently, a ratio of 1:10 macrophage: promastigote was selected and interaction was allowed to continue for 15 to 240 min. Additionally, macrophages were allowed to interact with promastigotes (before and after de-O-acetylation and de-sialylation) in 1:10 ratio at 37°C for 2 h. Cover-slips were washed in phosphate-buffered saline (PBS, 0·02 m, pH 7·2) to remove the unbound promastigotes, fixed with absolute methanol for 5 min and stained with propidium iodide (PI, 5 μg/ml) containing digitonin (0·05%) as the permeabilizing agent. The entry of promastigotes into macrophages was examined under a Carl Zeiss Axiostar plus FLTrinocular microscope (100×oil immersion objective). The number of promastigotes per macrophage was evaluated by counting at least 200 macrophages/cover-slip in quadruplicate. The phagocytic index was determined by multiplying the mean number of promastigotes/macrophages observed in 200 macrophages and the percentage of infected macrophages (Monteiro et al. Reference Monteiro, Lobato, Silva, Medina, de Oliveira, Seabra, de Souza and DaMatta2005). Images were processed for representative profiles.
To further substantiate the specific role of 9-O-AcSA in entry of virulent promastigotes, assays were carried out by initially blocking the existing sugar gates on macrophages (Weir, Reference Weir1980). To achieve this, carbohydrates (20 mm each) namely D-(+)-mannose, D-(+)-galactose, D-(+)-glucose, L-fucose and sialic acid were combined and considered as cocktail A. Adherent macrophages were initially incubated with cocktail A for 60 min, washed and subsequently incubated with promastigotes (before and after removal of 9-O-AcSA) at a ratio of 1:10 for 2 h. Cover-slips were then extensively rinsed with Medium A and the phagocytic index was determined as described previously.
Characterization of promastigote-macrophage interactions
To study the influence of temperature, the interaction of promastigotes with macrophages was performed at 4, 25 and 37°C as previously described. Additionally, the influence of Ca2+ (10 mm) on Leishmania-macrophage interactions via 9-O-AcSA in the presence and absence of an equimolar concentration of EGTA was assessed. Furthermore, the influence of Mg2+ was similarly studied. In parallel, assays were also performed in the presence of decomplemented serum. Cell viability was noted by microscopy and, unless otherwise specified, all assays were performed at 37°C for 2 h, the macrophage: promastigote ratio being 1:10.
Lectin-mediated agglutination
To assess the degree of binding of Achatinin-H logarithmic, stationary and metacyclic promastigotes from both AG83 and UR6 were separated as described above. They were washed thrice with PBS, and resuspended (1×10⁷/ml). Promastigotes (100 μl) were incubated with Achatinin-H (4 μg) at 20–25°C for 30 min, centrifuged at 150 g for 5 min. The unagglutinated promastigotes remaining in the supernatant were washed twice in PBS, examined microscopically and counted; accordingly, the agglutination (%) was determined. In parallel the inhibition of lectin-mediated agglutination was performed in the presence of BSM. Similarly, to confirm the stage-specific promastigotes, PNA (10 μg) was used for agglutination assay.
Statistical analysis
Results are reported as mean±s.d. Statistical analyses were performed using the Graph-Pad Prism statistics software (Graph-Pad Software Inc., San Diego, CA, USA). Student's paired t-test was performed, and P<0·05 was considered to be statistically significant at 95% confidence interval.
RESULTS
Promastigotes of avirulent UR6 contain a minimal amount of sialic acids
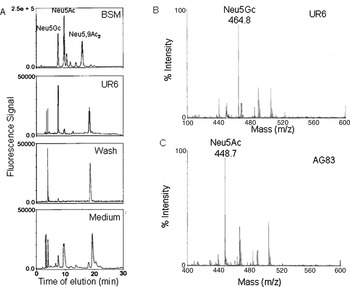
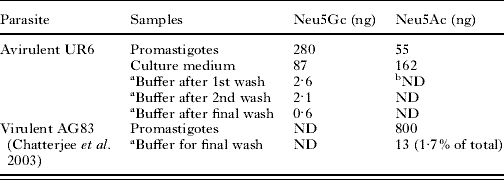
The chromatogram of UR6 exhibited a well-resolved intense peak of N-glycolylneuraminic acid (Neu5Gc, 280 ng/2×109), and a small peak co-migrating with Neu5Ac (55 ng/2×109, Fig. 1A). In contrast, Neu5Gc was completely absent in promastigotes of virulent AG83 as reported in our earlier studies (Chatterjee et al. Reference Chatterjee, Chava, Kohla, Pal, Merling, Hinderlich, Unger, Strasser, Gerwig, Kamerling, Vlasak, Crocker, Schauer, Schwartz-Albiez and Mandal2003, Table 1). The chromatogram of UR6 did not show the presence of 9-O-AcSA (Fig. 1A, Table 1). To exclude that sialic acids were not loosely adherent to the surface of UR6, promastigotes were extensively washed (50 ml/wash) and the washes examined; negligible amounts of sialic acids were found in the final wash of UR6 (Fig. 1A, Table 1). The chromatogram of the culture medium showed peaks co-migrating with Neu5Gc and Neu5Ac (Fig. 1A, Table 1). The representative chromatogram of free sialic acids purified from BSM, used as an internal standard (Fig. 1A).
Determination of sialic acids. (A) Fluorimetric HPLC. Representative profile of a HPLC chromatogram of fluorescent derivatives of free sialic acids derived from avirulent UR6 promastigotes, buffer used after washing the promastigotes, and medium for culturing UR6 as compared to sialic acids liberated from BSM used as an internal standard is shown. Glycosidically bound sialic acids were subjected to acid hydrolysis, derivatized with 1,2 diamino-4,5-methylenedioxybenzene and analysed as described in the Materials and Methods section. (B) MALDI-TOF mass spectra of HPLC purified Neu5Gc from UR6. The fraction corresponding to the DMB derivatized Neu5Gc peak from avirulent UR6 was collected after fluorimetric-HPLC, lyophilized and placed on the target with an equal volume of matrix (2,5-dihydroxybenzoic acid). All mass spectra were analysed by MALDI-TOF MS in the positive ion mode producing a representative mass spectra profile of fractionated Neu5Gc as shown. (C) A representative mass spectra profile of fractionated Neu5Ac from AG83. The fraction corresponding to the DMB derivatized Neu5Ac peak from virulent AG83 was collected after fluorimetric-HPLC, lyophilized and placed on the target with an equal volume of matrix (2,5-dihydroxybenzoic acid). All mass spectra were analysed by MALDI-TOF MS in the positive ion mode.

Quantitative analysis of sialic acids of avirulent and virulent promastigotes by fluorimetric HPLC analysis
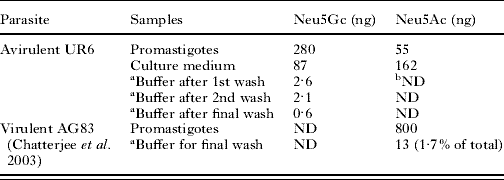
a Promastigotes were extensively washed thrice with PBS (50 ml per wash).
b ND, not detectable.
To further establish the presence of Neu5Gc on UR6 and Neu5Ac on AG83, the corresponding fractions were collected after fluorimetric-HPLC and lyophilized. Neu5Gc and Neu5Ac when analysed by MALDI-TOF MS, yielded the expected signal for the sodium cationized molecular ion having m/z at 464·8 (Fig. 1B) and 448·7 (Fig. 1C) confirming their presence in the respective strains.
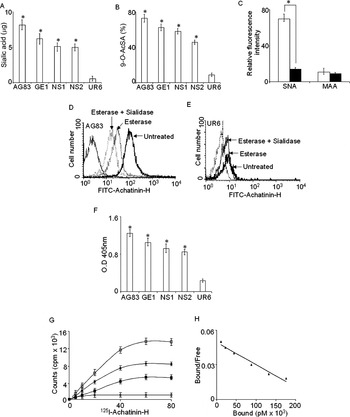
Fluorimetric estimation of the total SA content on the surface of UR6 promastigotes demonstrated a 15-fold reduction as compared to AG83, the mean±s.d. being 0·55±0·22 vs 8·17±1·5 μg respectively (Fig. 2A). A similar trend was evident in other virulent strains like GE1 (6·22±0·21 μg), NS1 (5·14±0·18 μg) and NS2 (4·98±0·15 μg). The 9-O-AcSA (%) on promastigotes (1×10⁷) of UR6 was minimal, being 8·3-fold lower than AG83 (72·66±5·66% vs 8·76±1·75%; Fig. 2B). Similarly, other virulent strains GE1, NS1 and NS2 also showed higher amounts of 9-O-AcSA (%) than UR6 being 62·35±1·78, 58·22±2·12 and 45·74±2·01 respectively (Fig. 2B).
(A–E) Demonstration of differential presence of sialic acids on virulent and avirulent promastigotes of Leishmania donovani by fluorimetric quantitation and flow cytometry. (A) Quantitation of sialic acids. Sialic acids on promastigotes were fluorimetrically quantitated after oxidization with sodium metaperiodate before and after saponification of O-acetyl groups. Results are the mean±s.d. of 4 experiments carried out in duplicate, where, * (asterix) means P<0·01 as compared to UR6. (B) Fluorimetric quantitation of 9-O-AcSA (%). 9-O-AcSA on promastigotes was fluorimetrically quantitated separately before and after saponification. Results are the mean±S.D. of 4 experiments performed in duplicate and * (asterix) means P<0·01 as compared to UR6. (C) Surface expression of (α2→6) and (α2→3) linked sialic acids. AG83 (□) and UR6 (▪) were incubated with biotinylated SNA and MAA and the binding was detected using FITC-streptavidin (Chatterjee et al. Reference Chatterjee, Chava, Kohla, Pal, Merling, Hinderlich, Unger, Strasser, Gerwig, Kamerling, Vlasak, Crocker, Schauer, Schwartz-Albiez and Mandal2003). Results are the mean±s.d. of 4 experiments performed in duplicate, where * (asterix) means P<0·01 for the binding of AG83 with SNA as compared to UR6. (D) Presence of surface 9-O-AcSA on AG83 promastigotes. Promastigotes (1×10⁶) were incubated with FITC-Achatinin-H and the number of Achatinin-H positive promastigotes was determined by flow cytometry. In parallel, promastigotes were incubated with 9-O-acetyl haemagglutinin esterase of influenza C virus (100 U/ml, 100 μl/ tube) for 1 h at 20°C to remove O-acetyl groups (Vlasak et al. Reference Vlasak, Krystal, Nacht and Palese1987; Chatterjee et al. Reference Chatterjee, Chava, Kohla, Pal, Merling, Hinderlich, Unger, Strasser, Gerwig, Kamerling, Vlasak, Crocker, Schauer, Schwartz-Albiez and Mandal2003). Esterase-treated cells were further exposed to Arthrobacter ureafaciens sialidase (10 U/ml, 50 μl/tube,) to remove the surface sialic acids and processed similarly. (E) Negligible presence of 9-O-AcSA on avirulent UR6. De-O-acetylated and de-sialylated promastigotes were processed similarly. (F–H) Demonstration of sialic acids on virulent and avirulent promastigotes of L. donovani by ELISA and Scatchard analysis. (F) Quantification of 9-O-AcSA on promastigotes by ELISA. Membrane lysates of promastigotes were separately incubated with Achatinin-H and binding was detected colorimetrically. Each point is the mean±s.d. of 4 independent experiments in duplicate, where, * (asterix) means P<0·01 as compared to UR6. (G) Differential binding of 125I-Achatinin-H to AG83 and UR6. Promastigotes (2×10⁶/tube) were incubated for 60 min at 4°C with varying doses of 125I-Achatinin-H, washed and processed. Specificity of binding was determined in parallel competition experiments using a 50-fold excess of unlabelled Achatinin-H and by subsequent separation of the bound and unbound Achatinin-H as described in the text. To determine specific binding of AG83 (◆), the nonspecific (unbound) binding (▪, obtained from 50-fold excess of unlabelled Achatinin-H in the presence of the same amount of 125I-Achatinin-H used in binding) was subtracted from the total binding (□) of 125I-Achatinin-H with promastigotes. In UR6 (◊), a basal level of specific binding is observed. (H) Scatchard plot of the binding of 125I-Achatinin-H with 9-O-AcSA present on AG83 promastigotes. The apparent dissociation constant was obtained from the Scatchard plot in which bound/free was plotted against various amounts of specifically bound Achatinin-H (pM).

Avirulent UR6 promastigotes contain decreased (α2→6)-linked sialic acids
Flow cytometry revealed a reduced presence of (α2→6)-linked sialic acids on UR6 as evidenced by a 6-fold lower binding of SNA as compared to AG83, being 11±2·8% vs 70·0±14·3% (Fig. 2C). MAA bound to (α2→3)-linked sialic acids showed a relatively lower binding in both UR6 (9±5·4%) and AG83 (14±2·33%) (Fig. 2C).
De-sialylated AG83 promastigotes showed a reduced binding of SNA and MAA, the corresponding values being 10±2·3% and 3±1·3%, indicating binding specificity of both lectins (Fig. 2D). UR6 with minimal sialic acids showed an insignificant reduction in the binding with both the lectins after subsequent desialylation (Fig. 2E).The viability of the promastigotes after de-sialylation and de-O-acetylation was ∼95±2·13% as compared to untreated controls as determined by MTT assay.
Binding of Achatinin-H to avirulent and virulent promastigotes
Avirulent promastigotes demonstrate decreased presence of 9-O-AcSA
The minimal presence of 9-O-AcSA on avirulent UR6 promastigotes was further confirmed by the 7-fold lower binding (11±2·5%, Fig. 2E) of Achatinin-H (preferentially binds to 9-O-AcSA) as compared to AG83 (70±3·4%, Fig. 2D). De-O-acetylation of AG83 caused a near total abolition of lectin binding (17±3%, Fig. 2D), whereas in UR6, de-O-acetylation caused no significant alteration of Achatinin-H binding (Fig. 2E).
Decreased 9-O-AcSA on avirulent promastigotes as corroborated by ELISA
ELISA also corroborated the decreased presence of 9-O-AcSA on avirulent UR6, as compared to virulent promastigotes of AG83, GE1, NS1 and NS2. The O.D. 405nm of UR6 was 0·24±0·01 as compared to a significantly higher Achatinin-H binding in all 4 virulent strains, AG83 (1·24±0·03), GE1 (1·05±0·02), NS1 (0·92±0·02) and NS2 (0·85±0·02) (Fig. 2F).
Minimal presence of 9-O-AcSA on UR6 as demonstrated by Scatchard analysis
Measurement of the receptor binding density of Achatinin-H by Scatchard analysis demonstrated an increased number of 9-O-AcSA molecules on virulent AG83, being 6×10⁶/promastigote (Fig. 2G). For evaluating the specific nature of binding, a 50-fold excess of cold unlabelled Achatinin-H was added and the apparent dissociation constant was found to be 1·88±0·02 nm (Fig. 2H). In contrast, binding of UR6 with Achatinin-H was negligible and remained unchanged with increasing doses of Achatinin-H, reconfirming absence or minimal expression of this glycotope (Fig. 2G).
Leishmania promastigote-macrophage interactions
The influence of temperature on entry of AG83 promastigotes via 9-O-AcSA was studied at 25°C and 4°C and found to be 51±2·5% and 10% (or less) respectively, whereas, at 37°C it was 98±1·5%, indicating that entry of promastigotes into macrophages was a physiological process; similar results were observed with other strains (data not shown).
To validate the influence of calcium on the entry of promastigotes into macrophages, assays were performed in the presence of Ca2+ (10 mm) which revealed a phagocytic index of 800±51 in virulent AG83, which was reduced by 59% to 473±31 in the presence of EGTA (10 mm). This inhibition was reversed by addition of an equimolar concentration of Ca2+ indicating that Ca2+ plays a role in promastigote entry in all the strains (data not shown).
The entry of promastigotes via 9-O-AcSA was independent of complement, as addition of decomplemented serum showed no significant change on infectivity (%) or phagocytic index (data not shown).
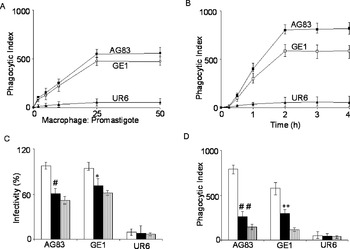
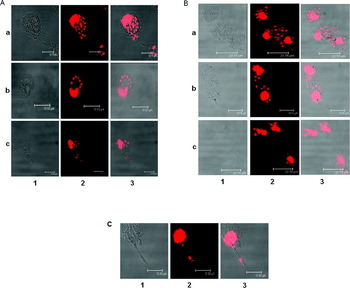
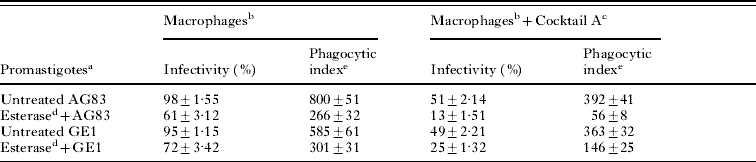
The kinetics of entry of Leishmania promastigotes into mouse macrophages varied with alteration in the macrophage: promastigote ratio and incubation time (Fig. 3A and B). The phagocytic index showed a linear increase with varying macrophage: promastigote ratio, which attained saturation at a ratio of 1:25 following 45 min of incubation (Fig. 3A). Subsequently, a macrophage: promastigote ratio of 1:10 demonstrating a suboptimal phagocytic index was selected for allowing the promastigotes to interact with macrophages for varying incubation times (Fig. 3B). The internalization of promastigotes, as monitored by the phagocytic index, did not increase beyond 2 h at the macrophage: promastigote ratio of 1:10 (Fig. 3B). Subsequently, the ratio 1:10 was used for all the subsequent interaction experiments between the macrophage and promastigote for 2 h. As compared to AG83 and GE1, promastigotes of avirulent UR6 demonstrated a drastically decreased phagocytic index. Interestingly, the phagocytic index of UR6 was negligible and remained unchanged with both increasing promastigote: macrophage ratio and time of incubation (Fig. 3A and B) signifying its inherent nature of avirulence in accordance with the existing reports (Mukhopadhyay et al. Reference Mukhopadhyay, Sena, Bhattacharyya, Majumdar and Roy1999, Reference Mukhopadhyay, Bhattacharyya, Majhi, De, Naskar, Majumdar and Roy2000). The phagocytic index for both virulent AG83 and GE1 was proportional to the incubation period up to 2 h, wherein the maximal number of promastigotes per macrophage was evidenced by the high phagocytic index of 800±51 and 585±45 respectively (Fig. 3B). In contrast, UR6 promastigotes revealed a 14·5-fold lower phagocytic index (55±9) as compared to AG83 (Table 2). In all strains after 2 h, 98% of macrophages had internalized promastigotes, and their phagocytic capacity was saturated (Fig. 3B). We did not observe any morphological evidence of rapid digestion of promastigotes from virulent AG83 during this period, and have concluded that the observed plateau was not a balance between ingestion and digestion of parasites in macrophages. On the contrary, the morphology of internalized parasites corresponded to that of amastigotes, indicating that they were completing their life cycle (Fig. 4A, panel a). Similar results were also obtained using GE1 promastigotes (Fig. 4B, panel a).
Leishmania-macrophage interactions at physiological temperature. (A) Effect of macrophage: promastigote ratio. Promastigotes from AG83 (▪), GE1 (□) and UR6 (▴) in varying macrophage: promastigote ratio (1:2, 1:5, 1:10, 1:25, and 1:50) was incubated with the macrophages for 45 min at 37°C. The phagocytic index was compared for different ratios by microscopical quantification as described in the Materials and Methods section and expressed as the mean±s.d. of 4 experiments performed in duplicate. (B) Effect of varying incubation time. Promastigotes from AG83 (▪), GE1 (□) and UR6 (▴) were allowed to interact with macrophages at a ratio of 10:1, at 37°C for different time-periods and the phagocytic index was determined as described in the Materials and Methods section. Each point is the mean±s.d. of 4 independent experiments performed in duplicate. (C) Reduced infectivity (%) of de-O-acetylated and de-sialylated virulent promastigotes. Promastigotes of AG83, GE1 and UR6 before (□) and after de-O-acetylation (▪) were incubated with macrophages at the selected macrophage: promastigote ratio of 1:10, for 2 h at 37°C. The promastigotes were treated with 9-O-acetylesterase derived from the HE1 region of the influenza C esterase gene for de-O-acetylation. In parallel, promastigotes were de-sialylated ( ) after incubating with Arthrobacter ureafaciens sialidase under similar conditions and the infectivity (%) was calculated. Error bars show standard deviations of 3 experiments. The reduction in the infectivity (%) of de-O-acetylated virulent strains was compared against untreated control, where # denotes P<0·01 for AG83 and * denotes P<0·05 for GE1. (D) Reduced phagocytic index of de-O-acetylated and de-sialylated virulent promastigotes. Promastigotes of AG83, GE1 and UR6 before (□) and after de-O-acetylation (▪) were subjected to the same experimental conditions as described in Fig. 3C. In parallel, the strains were de-sialylated () after incubating with Arthrobacter ureafaciens sialidase under similar conditions and the phagocytic index was calculated. The phagocytic index of enzyme-treated promastigotes was compared with untreated controls. Error bars show standard deviations of 3 experiments. The reduction in the phagocytic index of de-O-acetylated virulent strains was compared against untreated control, where ## denotes P<0·01 for AG83 and ** denotes P<0·01 for GE1.

Effect of esterase and sialidase on the entry of promastigotes as demonstrated by confocal microscopy. Representative photomicrographs of entry of promastigotes before and after esterase treatment after 2 h of incubation was processed as described in the Materials and Methods section. Red dots represent DNA binding. The number of promastigotes inside a macrophage was determined by counting 2 small red dots representing nucleus and kinetoplast DNA. Representative profiles of entry of promastigotes of AG83 (A) and GE1 (B) before (Panel a), after esterase (Panel b) and esterase followed by sialidase treatment (Panel c) are shown. A representative image of minimal entry of untreated UR6 with negligible 9-O-AcSA is shown in (C). Column 1, phase photomicrograph. Column 2, detection of propidium iodide-stained fluorescence. Column 3, overlap of 1 and 2.

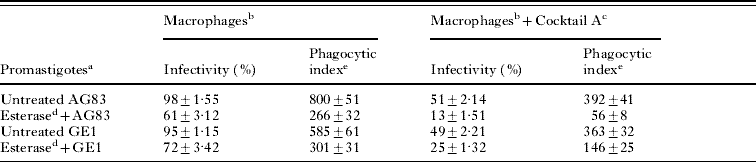
Promastigote-macrophage interaction under different experimental conditions
a Stationary phase promastigotes were used.
b Murine peritoneal macrophages were used for the respective experimental conditions.
c Carbohydrates namely D-(+)-mannose, D-(+)-galactose, D-(+)-glucose, sialic acid, and L-fucose (20 mm each) were mixed and referred to as cocktail A.
d The promastigotes were incubated with 9-O-acetylesterase to remove the O-acetyl group.
e Determined by multiplying the number of promastigotes per macrophage and the percentage of infected macrophages. Results are represented as mean±s.d. and P<0·01 for phagocytic index of esterase treated versus untreated Leishmania sp. promastigotes.
Esterase-treated virulent AG83, having minimal 9-O-AcSA demonstrated a considerable decrease in promastigote entry; evidenced by a decrease in infectivity (%) and phagocytic index to 61±3·12% and 266±32 respectively (Fig. 3C and D, Table 2). The decrease in infectivity (%) showed a good correlation with the reduced phagocytic index of de-O-acetylated AG83 promastigotes (r=0·95). Under identical assay conditions, virulent GE1, showed a similar decrease in infectivity (%) to 72±3·42% after de-O-acetylation as compared to the untreated control. Similarly, esterase-treated GE1 promastigotes demonstrated a reduced phagocytic index of 301±31 (Fig. 3C and D, Table 2). In contrast, avirulent UR6 promastigotes having a minimal amount of 9-O-AcSA demonstrated no significant change in infectivity (%) and phagocytic index after de-O-acetylation (Fig. 3C and D, Table 2). The role of 9-O-AcSA as an important determinant of entry for virulent promastigotes was further corroborated by confocal microscopy. Representative photomicrographs revealed a drastic reduction in the number of promastigotes per macrophage after de-O-acetylation in AG83 (from 16 to 7; Fig. 4A, panel a and b) and GE1 (from 9 to 5; Fig. 4B, panel a and b), whereas UR6 demonstrated minimal promastigote entry irrespective of de-O-acetylation (Fig. 4C).
De-sialylation of AG83 promastigotes demonstrated a reduction in the phagocytic index and infectivity (%), values being 150±28 and 52±4·25% (Fig. 3C and D). Representative photomicrographs obtained by confocal microscopy showed 4 internalized promastigotes of AG83, indicating the involvement of sialic acids in invasion (Fig. 4A, panel c). A similar trend in the reduction of phagocytic index, infectivity (%) and promastigotes per macrophage was observed with de-sialylated GE1 promastigotes (Fig. 4B, panel c). In contrast, avirulent UR6 having undetectable levels of sialic acids showed no significant alteration in their phagocytic index and infectivity (Fig. 3C and D, Fig. 4C).
To further substantiate the specific role of 9-O-AcSA as an important determinant responsible for promastigote entry, macrophages were pre-incubated with a cocktail of sugars containing sialic acid (cocktail A); in parallel, promastigotes, before and after removal of 9-O-AcSA were also used. The effective entry of AG83 mediated exclusively by 9-O-AcSA was demonstrated by the inhibition of infectivity (%) from 98±1·55% to 38±1·65% and reduction of phagocytic index from 800±51 to 336±24 reconfirming the role of 9-O-AcSA in entry (Table 2). Similar results were obtained for GE1 (Table 2).
Increased number of metacyclic AG83 promastigotes with higher presence of 9-O-AcSA as compared to avirulent UR6
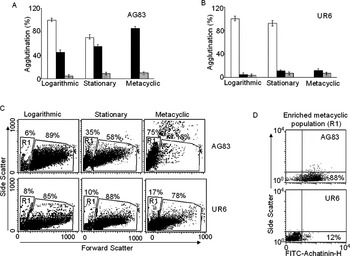
Metacyclic promastigotes of Leishmania spp. were purified from stationary cultures based on the agglutination by PNA of non-infective promastigotes present in the total population. Logarithmic promastigotes of AG83 demonstrated 100% agglutination with PNA, which was reduced to 70% in the stationary phase (Fig. 5A). In contrast, stationary promastigotes of avirulent UR6 demonstrated 92% agglutination with PNA (Fig. 5B). This indicated that stationary AG83 promastigotes have increased numbers of metacyclic promastigotes as compared to UR6.
Enhanced presence of 9-O-AcSA in metacyclic promastigotes of AG83 as compared to UR6 (A) Increased 9-O-AcSA on metacyclic AG83 promastigotes as demonstrated by agglutination using Achatinin-H. Promastigotes (1×10⁷/ml, 100 μl) in logarithmic, stationary and metacyclic (after purification) phases were incubated with Achatinin-H (▪) at 20–25°C for 30 min, centrifuged and the unagglutinated promastigotes in the supernatant fraction were examined microscopically and counted; accordingly, the degree of agglutination was extrapolated. Achatinin-H-mediated agglutination of promastigotes through binding to surface 9-O-AcSA was confirmed by inhibition in the presence of BSM (). To confirm the stage specificity of the promastigote agglutination mediated by PNA (□) was performed under identical assay conditions. Each point is the average of 3 independent experiments. (B) Minimal presence of 9-O-AcSA on UR6 promastigotes irrespective of different growth phases. Promastigotes of UR6 (1×10⁷/ml, 100 μl) in logarithmic, stationary and metacyclic (after enrichment) phases were similarly incubated with Achatinin-H (▪) and processed as described (A). Achatinin-H-mediated agglutination of promastigotes through binding to surface 9-O-AcSA was confirmed by inhibition in the presence of BSM (). Similar studies were performed with PNA (□). Each point is the average of 3 independent experiments. (C) Increased metacyclic promastigotes (FSClow, R1 population) in AG83 as compared to UR6 by flow cytometry. Promastigotes of AG83 and UR6 in different growth phases like logarithmic, stationary and metacyclics after their enrichment through PNA negative selection as described in the Materials and Methods section were analysed by flow cytometry. The results are shown in terms of the percentage values on FSC versus SSC dot plots representing 1 out of 5 analyses of the promastigote subpopulation corresponding to different cell sizes. The promastigotes gated within R1 corresponding to FSClow intensities comprise of the metacyclics. In parallel, the FSChigh population are the logarithmic promastigotes. (D) Increased 9-O-AcSA on metacyclic promastigotes of virulent AG83 by flow cytometry. The distribution of 9-O-AcSA on the metacyclic promastigotes in R1 of both AG83 and UR6 was determined by the binding of FITC-Achatinin-H plotted in a FITC-Achatinin-H versus side scatter dot plot. The R1 population of metacyclic promastigotes of both AG83 and UR6 was taken as 100% and the Achatinin-H positivity of the population was tested as described in the Materials and Methods section.

Metacyclic promastigotes of AG83 and UR6 were also identified by flow cytometry based on their cell size, which discriminates the FSClow population as metacyclic (designated as R1 in Fig. 5C) in FSC versus SSC plots, whereas, FSChigh population was considered as logarithmic promastigotes (Fig. 5C). Interestingly, metacyclic infective FSClow cells i.e. the R1 population increased significantly from logarithmic to stationary growth phases in AG83 (Fig. 5C). In contrast, an unaltered proportion of metacyclic promastigotes was observed in both the logarithmic and stationary phase of avirulent UR6 (Fig. 5C).
Subsequently, metacyclic infective populations of both AG83 and UR6 were enriched by PNA negative selection and analysed by flow cytometry. Metacyclics of the enriched AG83 subpopulation within the gated R1 region reached 75±3·25% whereas UR6 was only 17±2·25% (Fig. 5C).
To correlate the presence of increased 9-O-AcSA and metacyclogenesis leading to virulence, the enriched metacyclic promastigote population (R1) of both AG83 and UR6 was checked for the binding of FITC-Achatinin-H as represented in a dot-plot (Fig. 5D). This R1 population of metacyclic promastigotes of both AG83 and UR6 was taken as 100%. The metacyclic R1 population (FSClow population) of virulent AG83 demonstrated 88±3·51% Achatinin-H positivity in contrast to only a very small population of 12±2·12%, demonstrating that not only there was reduced metacyclogenesis, but also even in this small population, 9-O-AcSA positivity was negligible, suggesting a probable cause for avirulence of UR6.
Exploiting the preferential affinity of Achatinin-H towards 9-O-AcSA, the presence of these derivatives was further evidenced by a dramatic increase in agglutination of both stationary and purified metacyclic promastigotes of AG83 (Fig. 5A). Achatinin-H-mediated agglutination of promastigotes through 9-O-AcSA was further confirmed by inhibition of agglutination in the presence of an inhibitor, BSM known to contain high levels of 9-O-AcSA (Fig. 5A). In contrast, stationary and metacyclic UR6 promastigotes demonstrated only 11% and 12% agglutination respectively (Fig. 5B).
DISCUSSION
Leishmania are obligate intracellular parasites that reside in mononuclear phagocytes causing a wide spectrum of clinical manifestations resulting in substantial morbidity and mortality (Murray et al. Reference Murray, Berman, Davies and Saravia2005). A growing interest in the pathophysiological role of microbial sialoglycoconjugates has arisen following the identification of sialic acid and its 9-O-acetylated derivatives on the cell surface of viruses, bacteria, fungi, and protozoans (Crocker and Varki, Reference Crocker and Varki2001). Leishmanial parasites have adapted, not only to survive but also to proliferate, largely due to protection conferred by unique glycoconjugates; the principal participants include a family of phosphoglycans and glycoinositol phospholipids whose principal features are the presence of Gal β1→ 4 Man α1→PO4 repeating units (Ferguson, Reference Ferguson1999; Turco et al. Reference Turco, Späth and Beverley2001). Glycosylation also serves as an important host-parasite recognition determinant. In Leishmania donovani chagasi promastigotes a major Con A-binding surface glycoprotein is important in attachment to human macrophages, and reported as a factor in parasite virulence (Wilson and Hardin, Reference Wilson and Hardin1988). Evidence in this aspect suggests that Leishmania donovani utilizes a mannose receptor on human mononuclear phagocytes to establish intracellular parasitism (Wilson and Pearson, Reference Wilson and Pearson1986).
The assessment of sialoglycan profiles of Leishmania sp. and their role remains a relatively less explored domain in parasite glycobiology. However, studies from our group showed the presence of sialoglyconjugates especially the 9-O-AcSA on L. donovani promastigotes and amastigotes (Chatterjee et al. Reference Chatterjee, Chava, Kohla, Pal, Merling, Hinderlich, Unger, Strasser, Gerwig, Kamerling, Vlasak, Crocker, Schauer, Schwartz-Albiez and Mandal2003; Chava et al. Reference Chava, Chatterjee, Gerwig, Kamerling and Mandal2004b; Mukhopadhyay et al. Reference Mukhopadhyay and Mandal2006). Based on this finding, we were interested in exploring the differential distribution of sialic acids, especially 9-O-AcSA in avirulent vs virulent strains and also their contribution in the entry of virulent promastigotes into host macrophages. Comparison of the surface profile of promastigotes by fluorimetric HPLC, followed by confirmation of Neu5Gc in UR6 and Neu5Ac in AG83 by MALDI-TOF-MS, fluorimetric quantification, flow cytometry, ELISA and Scatchard analysis conclusively demonstrated the decreased presence of sialic acids and the absence or negligible presence of 9-O-AcSA, on avirulent UR6 promastigotes as compared to virulent AG83.
Since Leishmania sp. does not have the necessary machinery for sialylation, we have previously demonstrated that sialic acids are acquired by the promastigotes by a mechanism of poly-anionic adsorption from the culture medium (Chatterjee et al. Reference Chatterjee, Chava, Kohla, Pal, Merling, Hinderlich, Unger, Strasser, Gerwig, Kamerling, Vlasak, Crocker, Schauer, Schwartz-Albiez and Mandal2003; Chava et al. Reference Chava, Bandyopadhyay, Chatterjee and Mandal2004a,Reference Chava, Chatterjee, Gerwig, Kamerling and Mandalb). Although considerable amounts of SA were demonstrated in the culture medium, avirulent UR6 had minimal levels of Neu5Ac and undetectable levels of 9-O-AcSA, indicating that the avirulent strain is unable to adsorb these two derivatives of sialic acids from the environment as efficiently as virulent AG83. This observation was corroborated by flow cytometric analysis of promastigotes, demonstrating a similar pattern of minimal binding to all the three sialic acid binding lectins (SNA, MAA and Achatinin-H), again suggesting the incapability of adsorption when the avirulent UR6 promastigotes were cultured in medium containing FCS (10%). However, UR6 promastigotes cultured in medium containing varying amounts of FCS (2–20%) demonstrated a similar basal level of Neu5Ac further proving that UR6 was unable to absorb sialic acids from the environment beyond a certain basal level (data not shown). In contrast, avirulent UR6 is capable of adsorbing Neu5Gc from the environment in contrast to virulent strain AG83 and that these were not loosely adherent to the surface as indicated by the negligible presence of Neu5Gc in the final wash. Therefore, the preferential uptake of Neu5Gc by avirulent UR6 promastigotes in contrast to virulent AG83 allow speculations and possibly future investigations on the preferential uptake of this sugar by the UR6 strain. Hence, our data reveal that the borrowing of sialic acid occurs in a specific manner depending upon virulence of the strain.
The role of sialic acids in establishment of infection by Trypanosoma cruzi has been demonstrated in Chagas disease (Monteiro et al. Reference Monteiro, Lobato, Silva, Medina, de Oliveira, Seabra, de Souza and DaMatta2005). The African trypanosome T. brucei, cannot synthesize sialic acids. However, with the help of a unique enzyme, trans-sialidase, it can acquire sialic acids from the host's sialoglycoconjugates and transfer to its own glycosylphosphatidylinositols (GPIs) abundantly expressed on their surface. These surface sialic acids help protect the parasites from the digestive and trypanocidal environments (Nagamune et al. Reference Nagamune, Acosta-Serrano, Uemura, Brun, Kunz-Renggli, Maeda, Ferguson and Kinoshita2004).
In L. major, infectivity to macrophages and sandflies was dependent upon surface glycoproteins, gp63 and LPG. A family of phosphoglycans and glycoinositol phospholipids also plays a unique role in survival and proliferation of Leishmania parasites (Weir, Reference Weir1980; Pereira-Chioccola et al. Reference Pereira-Chioccola, Acosta-Serrano, Correia de Almeida, Ferguson, Souto-Padron, Rodrigues, Travassos and Schenkman2000). Hence, the ever-expanding complexity in the composition of the glycocalyx highlights the need for identification of newer molecular determinants affecting infectivity. A 3·0-fold decreased presence of α2→6 linked the sialoglycans along with a significantly basal level binding with increasing doses of Achatinin-H in avirulent UR6 as compared to AG83 confirmed the minimal presence of 9-O-AcSA, signifying that this unique glycotope is a potential marker for virulent L. donovani strains.
The recognition followed by entry of promastigotes is a crucial phase in disease pathogenesis and a better comprehension of this interaction may lead to better understanding of the disease pathology. The entry was maximal at 37°C, indicating that the interaction via 9-O-AcSA is a physiological process. Earlier reports have proven the role of calcium in bacteria-phagocyte interactions (Hackam et al. Reference Hackam, Rotstein, Schreiber, Zhang and Grinstein1997). Similarly, we observed the influence of calcium in promastigote-macrophage interaction via 9-O-AcSA. The entry of promastigotes through this unique glycotope was found to be independent of the complement factors. The observed non-infectivity of UR6 was in accordance with earlier reports, which limited our assay to promastigotes as a platform for comparison between the strains (Mukhopadhyay et al. Reference Mukhopadhyay, Sena, Bhattacharyya, Majumdar and Roy1999, Reference Mukhopadhyay, Bhattacharyya, Majhi, De, Naskar, Majumdar and Roy2000). Avirulent UR6 promastigotes having negligible amounts of 9-O-AcSA demonstrated a 9-fold decrease in infectivity (%) and a 8·4-fold lower phagocytic index than virulent AG83 promastigotes. GE1 also showed a 6-fold higher phagocytic index in contrast to UR6 reconfirming the presence of 9-O-AcSA as a key factor necessary for promastigote entry. This was confirmed by evaluation of promastigote entry following de-O-acetylation wherein a 3-fold reduction in phagocytic index of virulent AG83 was evident. Confocal microscopic images of entry of de-O-acetylated virulent promastigotes demonstrated reduction in the number of promastigotes per macrophage further proving the role of 9-O-AcSA in macrophage invasion. De-sialylation of both AG83 and GE1 promastigotes demonstrated a 8-fold reduction in phagocytic index, which was further, confirmed a reduced number of promastigotes (∼2) per macrophage, indicating the role of sialic acid in entry.
De-O-acetylation and de-sialylation of UR6 promastigotes showed almost absence of infectivity, which raises the obvious question about the distribution of other important virulent determinants of Leishmania sp. According to existing reports, avirulent UR6 is devoid of LPG and has a reduced presence of gp63, the primary virulence factors in Leishmania (Tolson et al. Reference Tolson, Turco, Beecroft and Pearson1989; Mukhopadhyay et al. Reference Mukhopadhyay, Sena, Bhattacharyya, Majumdar and Roy1999; Chakrabarty et al. Reference Chakrabarty, Mukherjee, Lu, McGwire, Chang and Basu1996). Furthermore, the attachment and internalization pattern of both virulent and avirulent Leishmania sp. into peritoneal macrophages showed that avirulent parasites attach more avidly on the macrophage surface whereas the virulent parasites are internalized or phagocytosed rapidly within the macrophages, probably because of differential and reduced distribution of ligands (Chakrabarty et al. Reference Chakrabarty, Mukherjee, Lu, McGwire, Chang and Basu1996). Glycophosphosphingolipids (GSPL), purified from UR6 were found to contain galactose, mannose, myoinositol, phosphate, ceramide and hexosamine but no sialic acid, unlike AG83 (Chakrabarty et al. Reference Chakrabarty, Chakrabarty and Basu1998). The absence, decreased or altered presence of these virulent determinants thus provides a hint towards differential metacyclogenesis in avirulent and virulent strains of L. donovani.
Changes in saccharide composition of LPG, are associated with the metacyclogenesis process in L. major and L. donovani (Da Silva and Sacks, Reference da Silva and Sacks1987; Sacks et al. Reference Sacks, Pimenta, McConville, Schneider and Turco1995). Interestingly, avirulent UR6 lacking LPG, hints towards the fact that metacyclogenesis is probably restricted causing its inherent inability to invade macrophages. Interestingly, not only the proportion of metacyclic promastigotes in AG83 was higher as compared to UR6, but also a 8-fold increased presence of 9-O-AcSA was observed in this metacyclic population. Enhanced presence of 9-O-AcSA in these metacyclic promastigotes of AG83 was further corroborated by increased Achatinin-H mediated agglutination, indicating that this unique sialoglycotope was involved in virulence as compared to UR6. Thus we have demonstrated that not only there was reduced metacyclogenesis, but also even in this small population, 9-O-AcS positivity was negligible. Therefore, it may be envisaged that both decreased metacyclogenesis accompanied by the drastically reduced presence of 9-O-AcSA is one of the probable causes behind the inherent avirulence of UR6. Therefore, it may be envisaged that the undetectable levels of 9-O-AcSA in UR6 add to another face of the unraveled mystery, which would strengthen the basis of infection in virulent versus avirulent strains. However, exhaustive investigations on the role of sialylation influencing metacyclogenesis are ongoing.
This study thus demonstrates the negligible or undetectable presence of 9-O-AcSA in avirulent strains in contrast to virulent strains and its subsequent role in recognition and entry of promastigotes into macrophages. A detailed study of these molecules might help in designing synthetic analogues to inhibit host-pathogen interaction and would provide a direction towards protection against infection. This will also be important in future to further define the role of 9-O-AcSA in survival strategies within the host and in other Leishmania strains; such studies are currently ongoing.
The Department of Biotechnology and Indian Council of Medical Research, and Council of Scientific and Industrial Research (CSIR), I.I.C.B. Govt. of India supported the work. Ms A. Ghoshal and S. Mukhopadhyay are senior research fellows of CSIR. We express our special thanks to Dr R. Vlasak, Applied BioTechnology, Salzburg, Austria, for providing 9-O-acetylesterase. Our sincerest thanks to Mr Ashish Mullick for his excellent technical assistance and Dr Avijit Dutta for help with fluorescence microscopy.