




1 Introduction
Since Kim & Adrian (Reference Kim and Adrian1999) observed two distinct peaks in the premultiplied spectrum of streamwise fluctuating velocity in pipe flows (termed as large-scale motions (LSMs) and very large-scale motions (VLSMs) with typical streamwise scales of several and tens of the outer flow units, respectively), VLSMs have received particular attention in the wall-bounded turbulence research community. While the origin and evolution mechanisms of VLSMs are still unclear, their presence has been repeatedly verified by abundant experimental and numerical studies in various wall-bounded flow scenarios, such as pipe (Guala, Hommema & Adrian Reference Guala, Hommema and Adrian2006; Bailey & Smits Reference Bailey and Smits2010; Hellström, Sinha & Smits Reference Hellström, Sinha and Smits2011; Baltzer, Adrian & Wu Reference Baltzer, Adrian and Wu2013; Lee & Sung Reference Lee and Sung2013; Lee, Ahn & Sung Reference Lee, Ahn and Sung2015), closed channel (Balakumar & Adrian Reference Balakumar and Adrian2007; Lee et al. Reference Lee, Lee, Choi and Sung2014, Reference Lee, Ahn and Sung2015), turbulent boundary layer (Balakumar & Adrian Reference Balakumar and Adrian2007; Lee & Sung Reference Lee and Sung2013) and atmospheric surface layer (known as ASL) (Wang & Zheng Reference Wang and Zheng2016).
Compared to the aforementioned wall-bounded flow types, the presence of VLSMs in open channel flow, however, was not well recognized in earlier studies of large-scale coherent structures in this unique wall-bounded flow with a free surface. Though structures with comparable length scale to that of VLSMs have been documented, most of the previous literature relating to the coherent structures in open channel flow generally categorized all structures larger than the outer flow units (i.e., water depth  $h$) as large-scale structures without explicit distinction between LSMs and VLSMs. One of these well documented large-scale structures is the strong bursting motions occupying the entire water depth (Grass Reference Grass1971; Nakagawa & Nezu Reference Nakagawa and Nezu1977, Reference Nakagawa and Nezu1981; Rashidi & Banerjee Reference Rashidi and Banerjee1988; Rashidi Reference Rashidi1997). Another type of large-scale structure which has been of great concern is the long streamwise-elongated and alternating high/low speed regions and their free surface signature (high/low speed streaks). Their existence has been repeatedly confirmed both in laboratory experiments (Nakagawa & Nezu Reference Nakagawa and Nezu1981; Imamoto & Ishigaki Reference Imamoto and Ishigaki1986; Gulliver & Halverson Reference Gulliver and Halverson1987; Tamburrino & Gulliver Reference Tamburrino and Gulliver1999; Shvidchenko & Pender Reference Shvidchenko and Pender2001; Tamburrino & Gulliver Reference Tamburrino and Gulliver2007; Zhong et al. Reference Zhong, Li, Chen and Wang2015, Reference Zhong, Chen, Wang, Li and Wang2016) and field measurements (Jackson Reference Jackson1976; Roy et al. Reference Roy, Buffin-Bélanger, Lamarre and Kirkbride2004; Sukhodolov, Nikora & Katolikov Reference Sukhodolov, Nikora and Katolikov2011; Franca & Lemmin Reference Franca and Lemmin2015). Table 1 lists the characteristic streamwise scales of these large-scale structures obtained from both lab experiments and field measurements at a wide range of Reynolds numbers. It can be readily seen that the typical length scales of these large-scale structures vary from approximately
 $2h$ to dozens of
 $h$. Though this wide-scale range implicitly implies the presence of structures with comparable length scale to that of VLSMs, direct and statistical evidence of the presence of VLSMs in open channel flows cannot be obtained straightforwardly therein given that LSMs and VLSMs are not explicitly distinguished.
Previous studies about large-scale structures in open channel flow from laboratory experiments and field measurements. Reynolds number  $Re=U_{m}h/\unicode[STIX]{x1D708}$, where
 $U_{m}$ is the depth mean velocity,
 $h$ is the water depth and
 $\unicode[STIX]{x1D708}$ is the kinematic viscosity.

In recent years, LSMs and VLSMs have been explicitly distinguished in the open channel flow research community; for example Zhong et al. (Reference Zhong, Li, Chen and Wang2015) found experimental evidence supporting the closed-loop feedback cycle model for the generation and maintenance of VLSMs by Adrian (Kim & Adrian Reference Kim and Adrian1999; Adrian & Marusic Reference Adrian and Marusic2012) based on the very large-scale and large-scale dividing in open channel flows. Cameron, Nikora & Stewart (Reference Cameron, Nikora and Stewart2017) provided direct and statistical evidence of the presence of VLSMs in rough-walled open channel flows for the first time, and an empirical formula for the streamwise wavelength of VLSMs at different flow conditions was proposed. The recent further research from the same group shows that the drag force on the rough bed has a close relationship with the VLSMs in open channel flows (Cameron, Nikora & Marusic Reference Cameron, Nikora and Marusic2019). The low-frequency peak of the drag force spectra corresponds to the presence of VLSMs, and the amplitude of high-frequency drag force fluctuations is modulated by the VLSMs, which indicates that sediment entrainment may occur when a low-pressure region embedded in the high-velocity portion of a VLSM overlays a particle. Wang & Richter (Reference Wang and Richter2019) reported that the suspended low inertia and high inertia sediment particles both strengthen the VLSMs following two distinct routes in open channel flows by direct numerical simulations.
It can be seen that the current research on the VLSMs in open channel flows is mainly focused on the interactions between VLSMs and rough bed/suspended sediment particles. This is due to one of the two main characteristics that distinguish open channel flows from other canonical wall-bounded flows being sediment movement, which leads to the rough and often movable channel bed and suspended sediment in open channel flows.
The other main characteristic of open channel flow is the free gas–liquid surface. The free surface affects the underlying turbulence by both the dynamic and kinematic boundary conditions (Shen et al. Reference Shen, Zhang, Yue and Triantafyllou1999), which in turn induces some unique features for turbulence statistics in open channel flows. One of the well known features is the redistribution of the turbulent kinetic energy near the free surface, i.e., the reduction of the wall-normal velocity fluctuations and the increase of the streamwise and spanwise components as has been reported in different flows with a free surface (Nezu & Rodi Reference Nezu and Rodi1986; Handler et al. Reference Handler, Swean, Leighton and Swearingen1993; Pan & Banerjee Reference Pan and Banerjee1995; Nagaosa Reference Nagaosa1999; Shen et al. Reference Shen, Zhang, Yue and Triantafyllou1999; Lee et al. Reference Lee, Suh, Sung and Pettersen2012; Zhong et al. Reference Zhong, Li, Chen and Wang2015). The other feature is the smaller wake strength in the outer layer of open channel flow compared to zero-pressure-gradient boundary layers (Nezu & Rodi Reference Nezu and Rodi1986), which means the mean streamwise velocity in open channel flow is smaller than that in the turbulent boundary layers at the same inner-scaled wall-normal location  $y^{+}(yu_{\unicode[STIX]{x1D70F}}/\unicode[STIX]{x1D708})$ when the frictional Reynolds number is identical.
The outer boundary conditions have been demonstrated to have strong effects on the characteristics of VLSMs in other wall-bounded flows (e.g., pipe, closed channel and turbulent boundary layer (TBL)) (Balakumar & Adrian Reference Balakumar and Adrian2007; Monty et al. Reference Monty, Hutchins, Ng, Marusic and Chong2009; Lee & Sung Reference Lee and Sung2013; Lee et al. Reference Lee, Ahn and Sung2015). It is important to question whether and in what extent the upper boundary free surface would cause specific characteristics of VLSMs in open channel flows. However, the answer to this question remains open. Furthermore, since the turbulence statistics have resulted from the superpositions of turbulence structures with various scales, the unique features of turbulence statistics in the outer layer of open channel flows (i.e., the redistribution of the turbulent kinetic energy and smaller wake strength) indicate the presence of turbulence structure differences. Given that VLSMs have been demonstrated to make great contributions to turbulence statistics (i.e., carrying approximately half of the kinetic energy and act to decelerate the mean velocity profile in the outer region of pipe and closed channel flows (Guala et al. Reference Guala, Hommema and Adrian2006; Balakumar & Adrian Reference Balakumar and Adrian2007)), it is also of interest to know whether the VLSMs play any specific role in contributing to the unique features of turbulence statistics in open channel flows.
The present paper will focus on the above two unclarified issues, i.e., free surface effects on VLSMs and contributions of VLSMs to the unique features of turbulence statistics in open channel flows. For this purpose, both the wavelength of VLSMs and their contributions to turbulence statistics were investigated in smooth-walled open channels based on time-resolved particle image velocity (PIV) experimental data. The smooth-wall condition was considered here to avoid the influence of the rough bed and ensure that the only difference between the flows of the present study and other canonical wall-bounded flows is the upper boundary condition. Thus, comparisons with other canonical wall-bounded flows are possible and then the effects of free surface on VLSMs as well as the contributions of VLSMs in relation to the unique features of turbulence statistics can be clarified. The paper is organized as follows. Section 2 describes methods for instrumentation and data analysis. Section 3 verifies the accuracy of current measurements by comparing the turbulence statistics and power spectra with classic data. Sections 4, 5 and 6 present the contributions of VLSMs to the turbulence statistics including turbulence intensity, Reynolds shear stress, and mean velocity, respectively, among which the effects of free surface on VLSMs as well as the contributions of VLSMs in relation to the unique features of turbulence statistics will be demonstrated. Finally, § 7 gives a summary of the major findings.
2 Experiments and methods
Throughout this study, the streamwise, wall-normal and spanwise directions are denoted by  $x$,
 $y$ and
 $z$, respectively. The mean velocities along corresponding directions are
 $U$,
 $V$ and
 $W$, with velocity fluctuations denoted as
 $u$,
 $v$ and
 $w$. All quantities normalized with friction velocity
 $u_{\unicode[STIX]{x1D70F}}$ and kinematic viscosity
 $\unicode[STIX]{x1D708}$ are represented with a superscript
 $+$, such as
 $y^{+}=y/(\unicode[STIX]{x1D708}/u_{\unicode[STIX]{x1D70F}})$. Root mean square is denoted by a prime and angle brackets,
 $\langle \,\rangle$, indicates the ensemble average.
2.1 Experiments
Five steady, uniform flow conditions (denoted as C1 to C5, as listed in table 2) with friction Reynolds number  $Re_{\unicode[STIX]{x1D70F}}$ ranging from 614 to 2407 were considered in this study.
Flow conditions.  $B$, channel width;
 $S$, channel slope;
 $h$, water depth;
 $B/h$, width-depth ratio;
 $\unicode[STIX]{x1D708}$, kinematic viscosity;
 $U_{m}$, depth mean velocity;
 $u_{\unicode[STIX]{x1D70F}}$, friction velocity, determined based on the log law with von Kármán constant
 $\unicode[STIX]{x1D705}=0.412$ and additive constant
 $A=5.29$;
 $Fr=U_{m}/\sqrt{gh}$, Froude number (
 $g$ is the gravitational acceleration);
 $Re=U_{m}h/\unicode[STIX]{x1D708}$, Reynolds number;
 $Re_{\unicode[STIX]{x1D70F}}=u_{\unicode[STIX]{x1D70F}}h/\unicode[STIX]{x1D708}$, friction Reynolds number.

For the former three lower Reynolds number flow cases (i.e., C1 to C3), the experiments were conducted in a closed recirculating open channel flume with dimensions of 20 m long and 30 cm wide at Tsinghua University, as schematically depicted in figure 1. The channel slope can be changed using the adjustment wheel under the flume. The channel bed and sidewalls are made of ultra-clear glass to facilitate the application of PIV measurements. Honeycombs with decreasing diameters were placed at the entrance of the flume to flatten the flow and remove probable large-scale flow structures generated during the recirculating process. The flume was driven by a pump and the flow rate could be adjusted by changing the motor rotating speed of the pump through a frequency converter. The flow rate was monitored by an electromagnetic flowmeter mounted on the backwater pipe. Eight ultrasonic level sensors were set along the flume to monitor the water depth. The measurement section was located 12 m downstream of the flume entrance to obtain fully developed flow conditions. This distance (approximately  $343\sim 480h$) satisfies the criteria documented in the literature, e.g.,
 $76h$ suggested by Kirkgöz & Ardiçlioğlu (Reference Kirkgöz and Ardiçlioğlu1997) and a conservative value of
 $150h$ suggested by Lien et al. (Reference Lien, Monty, Chong and Ooi2004).
(a) Schematic diagram of the 20 m long and 30 cm wide open channel flume (not to scale) and (b) corresponding PIV system arrangement and (c) operation mode.

The PIV measurement was conducted in a streamwise wall-normal plane in the middle of the channel. A 1.5 mm-thick laser sheet generated from a pulse laser (Nd:YLF,  $20~\text{mJ}~\text{pulse}^{-1}$ at 1 kHz) was used to illuminate the field of view (known as FOV), and a high-speed CMOS camera (IDT Y7-S3, 64GB,
 $1920\times 1080~\text{pixels}$) was used to capture the particle images. Hollow glass spheres (Dantec Dynamics, HGS-10) with a density of
 $1.06\times 10^{3}~\text{kg}~\text{m}^{-3}$ and mean diameter of
 $10~\unicode[STIX]{x03BC}\text{m}$ were used as tracer particles. The pulse laser and camera were synchronized with a digital delay pulse generator (known as DDPG) as demonstrated in figures 1(b) and 1(c). The time interval between the two frames within each image pair,
 $\unicode[STIX]{x0394}t$, satisfies the one quarter rule (Adrian & Westerweel Reference Adrian and Westerweel2011). The sampling frequency,
 $F_{s}$, is at
 $O(1000)~\text{Hz}$ and high enough (with the corresponding time interval between successive velocity field
 $\unicode[STIX]{x0394}T^{+}<1$) to resolve the small-scale energetic motions. The total image acquisition time
 $T$, during which the streamwise distance of the mean flow movement
 $TU_{m}$ was greater than
 $10\,000h$, is long enough to give convergent spectral results at the largest energetic wavelengths.
As for the latter two highest Reynolds number flow cases (i.e., C4 to C5), the experiments were conducted in a longer and wider recirculating open channel flume at Chongqing Jiaotong University (31 m long, 56 cm wide and 70 cm deep). The bed and sidewalls are also made of glass, for the application of PIV measurements. Three  $5~\text{cm}\times 5~\text{cm}$ grids were set at the flume entrance to remove possible large-scale motions. The flow rate and water depth were also monitored by electromagnetic flowmeter and ultrasonic level sensors, respectively. Similar high-frequency and long-duration PIV measurements were performed in the streamwise wall-normal plane at the channel centre, located 16.5 m downstream of the flume entrance to ensure fully developed flow conditions.
Details of the flow conditions and PIV measurement parameters for all the five cases can be seen in tables 2 and 3, respectively. For all cases, the acquired particle images were post-processed with an in-house PIV software using a multipass and multigrid window deformation algorithm which is very similar to that of Scarano (Reference Scarano2002). Accuracy verification of the PIV algorithm can be found in the report of the 4th International PIV Challenge (under the symbol TsU (Kähler et al. Reference Kähler, Astarita, Vlachos, Sakakibara, Hain, Discetti, La Foy and Cierpka2016)). The initial and final interrogation window sizes are  $64\times 64$ and
 $16\times 16$ pixels with an overlap of 50 % with the resulting inner-scaled wall-normal vector spacing
 $\unicode[STIX]{x0394}y^{+}=5{-}14$.
The PIV parameters:  $F_{s}$, the sampling frequency of the velocity fields. Here,
 $\unicode[STIX]{x0394}T^{+}=\unicode[STIX]{x0394}T/(\unicode[STIX]{x1D708}/u_{\unicode[STIX]{x1D70F}}^{2})$ and
 $\unicode[STIX]{x0394}TU_{m}/h$, inner- and outer-scaled time interval between successive velocity fields;
 $T$, total image acquisition time;
 $\unicode[STIX]{x0394}y^{+}$ (or
 $\unicode[STIX]{x0394}x^{+}$), the inner-scaled vector spacing in wall-normal (or streamwise) direction.

2.2 Power spectrum
For simplicity of description,  $u_{i}$ (
 $i=1,2$) was adopted to denote the streamwise and wall-normal fluctuating velocity signals with
 $u_{1}=u$ and
 $u_{2}=v$. Then the power spectrum (or cross-power spectrum) can be defined as
 $$\begin{eqnarray}\unicode[STIX]{x1D6F7}_{u_{i}u_{j}}(f)=c|F_{u_{i}}(f)F_{u_{j}}^{\ast }(f)|,\end{eqnarray}$$
where  $F_{u_{i}}(f)$ denotes the Fourier transform of fluctuating velocity signal
 $u_{i}$,
 $f$ is frequency, superscript
 $\ast$ indicates the complex conjugate,
 $|\,|$ designates the modulus,
 $c$ is a constant determined by satisfying the following equation:
 $$\begin{eqnarray}\overline{u_{i}u_{j}}=\int _{0}^{\infty }\unicode[STIX]{x1D6F7}_{u_{i}u_{j}}(f)\,\text{d}f.\end{eqnarray}$$
Based on Taylor’s frozen turbulence hypothesis (Taylor Reference Taylor1938), the frequency-based spectrum  $\unicode[STIX]{x1D6F7}_{u_{i}u_{j}}(f)$ can be transformed to streamwise wavenumber
 $k_{x}$ (or wavelength
 $\unicode[STIX]{x1D706}_{x}$) spectrum
 $\unicode[STIX]{x1D6F7}_{u_{i}u_{j}}(k_{x})$ (or
 $\unicode[STIX]{x1D6F7}_{u_{i}u_{j}}(\unicode[STIX]{x1D706}_{x})$) through the following relationships:
 $$\begin{eqnarray}\left.\begin{array}{@{}c@{}}\displaystyle k_{x}=\frac{2\unicode[STIX]{x1D70B}f}{U(y)},\\ \displaystyle \unicode[STIX]{x1D706}_{x}=\frac{2\unicode[STIX]{x1D70B}}{k_{x}},\end{array}\right\}\end{eqnarray}$$
where  $U(y)$ is the mean streamwise velocity at
 $y$. Even though Taylor’s hypothesis may not be accurate in the low wavenumber range, the errors involved in Taylor’s hypothesis will not corrupt the present results unduly (Kim & Adrian Reference Kim and Adrian1999; Guala et al. Reference Guala, Hommema and Adrian2006). Furthermore, wavenumber spectra derived from Taylor’s hypothesis must reveal less energy at low wavenumber than the true wavenumber spectra, since the time-delayed correlation should decay faster than the two-point correlation due to evolution of the eddy structures as they pass over the measurement point. Therefore, wavenumber spectra in the present paper will be a conservative estimate of the VLSMs.
3 Accuracy verification
In this section, profiles of turbulence statistics as well as their uncertainties and spectral results at typical wall-normal locations will be presented and compared with the previous studies for verifying the accuracy of experimental data as well as the rationality of the data post-processing method.
3.1 Turbulence statistics
Profiles of the mean velocity, turbulence intensity and Reynolds shear stress for all five cases are shown in figure 2. The mean velocity profiles closely follow the direct numerical simulation (DNS) results of closed channel flow (Hoyas & Jiménez Reference Hoyas and Jiménez2008) and exhibit a clear logarithmic distribution (von Kármán constant  $\unicode[STIX]{x1D705}=0.412$ and additive constant
 $A=5.29$, as suggested by Nezu & Nakagawa (Reference Nezu and Nakagawa1993) in open channel flow). The Reynolds shear stress profiles are linearly distributed in the outer layer. Turbulence intensities are consistent with the classical universal functions for open channel flows proposed by Nezu & Rodi (Reference Nezu and Rodi1986). The unique feature relating to the redistribution of turbulent kinetic energy in open channel flows (Komori et al. Reference Komori, Nagaosa, Murakami, Chiba, Ishii and Kuwaharaa1993; Nezu & Nakagawa Reference Nezu and Nakagawa1993; Zhong et al. Reference Zhong, Li, Chen and Wang2015) can be clearly seen in figure 2(b) by comparing the turbulence intensities with those in closed channel flows especially in the near surface region where the free surface restricts and weakens wall-normal turbulence intensity while strengthening the streamwise component. This free-surface induced redistribution of kinetic energy will be discussed further in § 4.3 from a new perspective in terms of VLSMs.
Wall-normal profiles of turbulence statistical parameters: (a) the mean velocity; (b) turbulence intensity and Reynolds shear stress. von Kármán constant  $\unicode[STIX]{x1D705}=0.412$ and additive constant
 $A=5.29$ are used in the log law (Nezu & Nakagawa Reference Nezu and Nakagawa1993). The DNS results of closed channel flows at
 $Re_{\unicode[STIX]{x1D70F}}=950$ (CCF950) are from Hoyas & Jiménez (Reference Hoyas and Jiménez2008).

3.2 Uncertainty analysis
For the instantaneous velocity obtained from PIV measurements, the uncertainties mainly originated from the random error in estimating the subpixel location of the correlation peak. This random error is estimated to be less than 0.1 pixel for the present PIV algorithm based on the accuracy verification using 3rd PIV Challenge Case B data, and this uncertainty is consistent with the well documented value of 0.05–0.1 pixels (Westerweel Reference Westerweel1997). Given a mean tracer particle displacement of 8–12 pixels in the present study, this uncertainty accounts for less than 1 % of the real velocity value and shows negligible effects compared to the real velocity fluctuations, based on which this random error would not be considered in the subsequent analysis.
As for the turbulence statistics, they are also affected by the uncertainty. Following the analysis in Sciacchitano & Wieneke (Reference Sciacchitano and Wieneke2016), the uncertainty of the mean velocity (denoted as  $\unicode[STIX]{x1D6FF}U$ and
 $\unicode[STIX]{x1D6FF}V$ for streamwise and wall-normal component, respectively) is given by
 $$\begin{eqnarray}\unicode[STIX]{x1D6FF}U=\frac{u^{\prime }}{\sqrt{N_{eff}}},\quad \unicode[STIX]{x1D6FF}V=\frac{v^{\prime }}{\sqrt{N_{eff}}},\end{eqnarray}$$
where  $u^{\prime }$ and
 $v^{\prime }$ are the streamwise and wall-normal turbulence intensities,
 $N_{eff}$ represents the effective number of independent velocity samples and can be obtained through
 $N_{eff}=T/2T_{int}$ (
 $T_{int}$ is the integral time scale). The uncertainty of the turbulence intensities (
 $\unicode[STIX]{x1D6FF}u^{\prime }$ and
 $\unicode[STIX]{x1D6FF}v^{\prime }$) is
 $$\begin{eqnarray}\unicode[STIX]{x1D6FF}u^{\prime }=\frac{u^{\prime }}{\sqrt{2(N_{eff}-1)}},\quad \unicode[STIX]{x1D6FF}v^{\prime }=\frac{v^{\prime }}{\sqrt{2(N_{eff}-1)}}.\end{eqnarray}$$
The uncertainty of Reynolds shear stress,  $\unicode[STIX]{x1D6FF}\langle uv\rangle$, is obtained by
 $$\begin{eqnarray}\unicode[STIX]{x1D6FF}\langle uv\rangle =u^{\prime }v^{\prime }\sqrt{\frac{1+\unicode[STIX]{x1D70C}_{uv}^{2}}{N_{eff}-1}},\quad \unicode[STIX]{x1D70C}_{uv}=\frac{\langle uv\rangle }{u^{\prime }v^{\prime }}.\end{eqnarray}$$
In each case, uncertainties of the above turbulence statistics at each  $y$ location have been quantified. In summary, the normalized uncertainties by friction velocity are very small (
 $\unicode[STIX]{x1D6FF}U^{+}<0.03$,
 $\unicode[STIX]{x1D6FF}V^{+}<0.017$,
 $\unicode[STIX]{x1D6FF}{u^{\prime }}^{+}<0.022$,
 $\unicode[STIX]{x1D6FF}{v^{\prime }}^{+}<0.012$,
 $\unicode[STIX]{x1D6FF}\langle uv\rangle ^{+}<0.036$) and demonstrate that sufficiently large independent velocity samples have been acquired in the present study to obtain reliable turbulence statistics.
3.3 Wavenumber spectrum
For the velocity signals at each wall-normal location, Welch’s overlapped segment averaging method was used to obtain the spectrum. To avoid spectral leakage due to the truncation at the segment edge, a Hamming window was applied for each segment before performing the discrete Fourier transform as advocated by Buxton, de Kat & Ganapathisubramani (Reference Buxton, de Kat and Ganapathisubramani2013). Given that the raw spectrum derived from a raw velocity signal would be contaminated by the high-frequency measurement noise, a 9-point Gaussian kernel with standard deviation of 1.7 was applied to the raw velocity signals to reduce the noise effects. Then, a bandwidth moving filter (BMF) (Baars, Hutchins & Marusic Reference Baars, Hutchins and Marusic2016) of 35 % (meaning that the filtered spectrum at wavenumber  $k_{x_{i}}$ is equal to the average of the unfiltered spectrum over span
 $k_{x_{i}}\pm 35\,\%$) was further adopted to smooth the spectrum to facilitate the identification of bio-peaks of LSMs and VLSMs while not altering the shape of the spectrum.
Figure 3 presents both the raw spectrum (obtained from the raw velocity signal) and filtered spectrum (obtained from the Gaussian filtered velocity signal followed by a 35 % BMF filtering) for streamwise velocity fluctuations at  $y/h=0.1$. For comparison, the spectral results in other canonical wall-bounded turbulent flows (pipe, closed channel and TBL) at similar
 $y$ location and comparable
 $Re_{\unicode[STIX]{x1D70F}}$ (Kim & Adrian Reference Kim and Adrian1999; Balakumar & Adrian Reference Balakumar and Adrian2007) are also included. The high-frequency measurement noise can be readily seen at high wavenumber range (
 $k_{x}y>10$, corresponding to a wavelength of
 $0.06h$ at this
 $y$ position) of the raw spectrum. The filtering processes adopted here effectively eliminate this inherent high-frequency noise as well as the raw spectrum fluctuations. Good agreement can be observed between the current filtered spectrum and that in other flows, and thereby verifies both the measurement accuracy and the rationality of the post-processing method.
Wavenumber spectrum for streamwise velocity fluctuation at  $y/h=0.1$. Lines are current open channel flow results (dashed lines, raw spectrum obtained from the raw velocity signals; solid lines, filtered spectrum obtained from the Gaussian filtered velocity signals followed by a 35 % BMF filtering). Results of pipe flow (Pipe-1984) are from Kim & Adrian (Reference Kim and Adrian1999) at
 $Re_{\unicode[STIX]{x1D70F}}=1984$,
 $y/R=0.084$ (
 $R$ is the pipe radius). The remaining closed channel and TBL results are from Balakumar & Adrian (Reference Balakumar and Adrian2007): Channel-531,
 $Re_{\unicode[STIX]{x1D70F}}=531$,
 $y/h=0.12$ (
 $h$ is the channel half-height); Channel-960,
 $Re_{\unicode[STIX]{x1D70F}}=960$,
 $y/h=0.11$; Channel-1584,
 $Re_{\unicode[STIX]{x1D70F}}=1584$,
 $y/h=0.12$; TBL-1476,
 $Re_{\unicode[STIX]{x1D70F}}=1476$,
 $y/\unicode[STIX]{x1D6FF}=0.11$ (
 $\unicode[STIX]{x1D6FF}$ is the boundary layer thickness); TBL-2395,
 $Re_{\unicode[STIX]{x1D70F}}=2395$,
 $y/\unicode[STIX]{x1D6FF}=0.11$.

4 Contributions to turbulence intensity
4.1 Premultiplied spectra of streamwise velocity
Following previous studies (Kim & Adrian Reference Kim and Adrian1999; Guala et al. Reference Guala, Hommema and Adrian2006; Adrian Reference Adrian2007; Hutchins & Marusic Reference Hutchins and Marusic2007; Monty et al. Reference Monty, Hutchins, Ng, Marusic and Chong2009), the premultiplied power spectrum of the streamwise velocity,  $k_{x}\unicode[STIX]{x1D6F7}_{uu}(k_{x})$, is used to show the streamwise wavelengths associated with LSMs and VLSMs. Premultiplied power spectra across the entire water depth are presented in figure 4, where inner-scale normalization is used in column (i) (left) to highlight the inner layer while outer-scale normalization is used in column (ii) (right) to highlight the outer layer.
Premultiplied power spectra of streamwise velocity. Inner- and outer-scale normalizations are used in column (i) (left) and column (ii) (right), respectively.

The most noticeable feature in column (i) of figure 4 is the inner peak below the buffer layer ( $y^{+}<\sim 30$) with typical wavelength
 $\unicode[STIX]{x1D706}_{x}^{+}\sim O(1000)$. It is well known that the main energetic structures in the buffer layer are quasi-streamwise vortices (QSVs) (Robinson Reference Robinson1991; Panton Reference Panton2001; Schoppa & Hussain Reference Schoppa and Hussain2002; Jiménez Reference Jiménez2018). These QSVs with typical streamwise extent of 300–400 (
 $\unicode[STIX]{x1D708}/u_{\unicode[STIX]{x1D70F}}$) can coherently align along the streamwise direction with their transportation roles creating the elongated near-wall streaks with the streamwise extent of
 ${\sim}O(1000)(\unicode[STIX]{x1D708}/u_{\unicode[STIX]{x1D70F}})$, which is identical to
 $\unicode[STIX]{x1D706}_{x}^{+}$ of the inner peak in premultiplied power spectra. This result agrees with the conclusion in previous literature that the near-wall cycle of streaks and quasi-streamwise vortices contribute to the strongest peak in premultiplied power spectra (Monty et al. Reference Monty, Hutchins, Ng, Marusic and Chong2009).
As demonstrated in column (ii) of figure 4, the main feature in the outer layer is that there are two dominant and energetic modes (as roughly marked by white dashed lines), which is the same as the double peaks in closed channel and pipe flows (Balakumar & Adrian Reference Balakumar and Adrian2007; Monty et al. Reference Monty, Hutchins, Ng, Marusic and Chong2009). The typical wavelengths of the two modes are around  $O(3h)$ and
 ${\sim}20h$. Thus, they are LSMs and VLSMs, respectively. Comparisons among different cases further show that the energy contained in VLSMs becomes more distinct when the Reynolds number increases, and an outer peak (as marked by black crosses) emerges in C3 to C5 cases despite the peak being very weak in the C3 case. In the two highest Reynolds number cases with
 $Re_{\unicode[STIX]{x1D70F}}>1800$ (C4,
 $Re_{\unicode[STIX]{x1D70F}}=1903$; C5,
 $Re_{\unicode[STIX]{x1D70F}}=2407$), because of the sufficient inner- and outer-scale separation, a clear outer peak can be observed with its wall-normal position located near the centre of log region (i.e.,
 $y^{+}=3.9\sqrt{Re_{\unicode[STIX]{x1D70F}}}$, as highlighted by horizontal black dotted lines), which is similar to that identified in pipe and channel flows (Ng et al. Reference Ng, Monty, Hutchins, Chong and Marusic2011).
(a) Wavelength of LSMs ( $\unicode[STIX]{x1D706}_{xLSMs}$) and VLSMs (
 $\unicode[STIX]{x1D706}_{xVLSMs}$), represented by small and large symbols, respectively; (b) ratios between
 $k_{x}\unicode[STIX]{x1D6F7}_{uu}(k_{x})$ at
 $\unicode[STIX]{x1D706}_{xVLSMs}$ and
 $\unicode[STIX]{x1D706}_{xLSMs}$; (c) the fraction of kinetic energy carried by VLSMs. In panels (a) and (b), results of different flow types are distinguished by colours (open symbols for present smooth-wall open channel flows (smooth-OCF); closed symbols in different colours are the results of other flow types from the literature) and within each flow type the flow case at different Reynolds numbers are presented with different symbols, as listed in the lower left corner. As for the additional lines, the magenta dashed line in (a) is the empirical formula from Monty et al. (Reference Monty, Hutchins, Ng, Marusic and Chong2009),
 $\unicode[STIX]{x1D706}_{xVLSMs}=23(y/h)^{3/7}$, and lines in (b) are the linear fitting for the results of different flow types. In (c), results of other flow types are presented with the same symbols as those in (a) and (b) except the present open channel results which are presented by lines (see the legend in panel c) instead of symbols.

4.2 Wavelength, strength and kinetic energy content
For more details, wavelength associated with the LSMs and VLSMs in the premultiplied spectra of streamwise velocity (denoted as  $\unicode[STIX]{x1D706}_{xLSMs}$ and
 $\unicode[STIX]{x1D706}_{xVLSMs}$, respectively) have been identified and compiled in figure 5(a). Additional data extracted from other wall-bounded turbulence studies on pipe flow (Guala et al. Reference Guala, Hommema and Adrian2006), closed channel flow (Balakumar & Adrian Reference Balakumar and Adrian2007), TBL (Balakumar & Adrian Reference Balakumar and Adrian2007) as well as recent studies on rough-wall open channel flows (Cameron et al. Reference Cameron, Nikora and Stewart2017) are also presented for comparison. It should be mentioned here that although the characteristics of VLSMs in rough-wall open channel flows are supposed to be different from those in current smooth-wall conditions, comparisons between the two flow conditions are still meaningful especially for clarifying the potential wall condition effects on the characteristics of VLSMs.
For LSMs, their wavelength  $\unicode[STIX]{x1D706}_{xLSMs}$ is roughly the same among different flow scenarios along the whole water depth exhibiting a typical value of
 $3{-}6h$. However, the wavelength of VLSMs,
 $\unicode[STIX]{x1D706}_{xVLSMs}$, shows different signatures. Compared to the rough-wall open channel flows,
 $\unicode[STIX]{x1D706}_{xVLSMs}$ at current smooth-wall conditions is smaller. This can be speculated and explained as follows: the roughness Reynold number in Cameron et al. (Reference Cameron, Nikora and Stewart2017) is
 $D^{+}=605$ (
 $D$ is the diameter of the roughness elements) and indicates a fully rough-flow condition. These rough elements seem to be big enough to restrict the inherent meandering feature of VLSMs, based on which a longer wavelength of VLSMs can be captured from a fixed-point measurement. Given the finite size of these roughness elements, the above speculated roughness effects are expected to be weakened when the water depth increases, i.e., the submergence of the rough elements increases. As can be seen in figure 5(a),
 $\unicode[STIX]{x1D706}_{xVLSMs}$ in rough wall open channel flows will decrease and tend to follow our smooth-wall results when the Reynolds number increases (realized by increasing the water depth, or in other words, increasing the submergence of the rough elements given that
 $D^{+}$ is fixed (
 $D^{+}=605$) in Cameron et al. (Reference Cameron, Nikora and Stewart2017)), this observation provides strong support for the above speculation. When compared with other canonical wall-bounded turbulent flows (pipe, closed channel and TBL), although the wavelength of VLSMs in present smooth-wall open channel flows shows a comparable value, their presence extends further away from the wall and can almost extend to the free surface.
Figure 5(b) further shows the relative strength relationship between VLSMs and LSMs in different flow types by plotting the ratios between  $k_{x}\unicode[STIX]{x1D6F7}_{uu}(k_{x})$ at
 $\unicode[STIX]{x1D706}_{xVLSMs}$ and
 $\unicode[STIX]{x1D706}_{xLSMs}$. When there were no distinct peaks at a given
 $y$ position,
 $k_{x}\unicode[STIX]{x1D6F7}_{uu}(k_{x})$ values at
 $3h$ and
 $15h$ were adopted as the surrogates. Although data points are relatively scattered, we can also find out the different trends among different flow types within experimental uncertainty. The strength of VLSMs compared with LSMs at the same
 $y$ position in closed channel, pipe and TBL is always reducing beyond
 $y/h=0.5$, which could be roughly demonstrated by the negative slope of the linear fitting lines as shown in figure 5(b). The slopes of the linear fitting lines for closed channel, pipe and TBL are
 $-0.26$,
 $-1.03$ and
 $-0.93$, respectively. At
 $y/h=0.8$, the
 $k_{x}\unicode[STIX]{x1D6F7}_{uu}(k_{x})$ for VLSMs is approximately 70 %, 50 % and 35 % of that for LSMs in closed channel, pipe and TBL, respectively. However, this ratio remains greater than 90 % beyond
 $y/h=0.5$ in open channel flows both at smooth- and rough-wall conditions given the slower decreasing trends (the negative slopes are
 $-0.12$ and
 $-0.11$ for smooth- and rough-wall open channel, respectively), and indicates that VLSMs maintain the comparable strength with LSMs in the outer and near surface region.
Following the widely adopted separation scale value in the literature (Guala et al. Reference Guala, Hommema and Adrian2006; Balakumar & Adrian Reference Balakumar and Adrian2007),  $\unicode[STIX]{x1D706}_{x}=3h$ was used here to separate LSMs and VLSMs. Then the contributions of VLSMs to turbulence intensity, or equivalently the fraction of energy carried by VLSMs, can be defined as
 $$\begin{eqnarray}\unicode[STIX]{x1D6FE}_{uu}=\frac{\displaystyle \int _{0}^{2\unicode[STIX]{x1D70B}/3h}\unicode[STIX]{x1D6F7}_{uu}(k_{x})\,\text{d}k_{x}}{\displaystyle \int _{0}^{\infty }\unicode[STIX]{x1D6F7}_{uu}(k_{x})\,\text{d}k_{x}}.\end{eqnarray}$$
The variation in  $\unicode[STIX]{x1D6FE}_{uu}$ as a function of
 $y/h$ is shown in figure 5(c), where results from other wall-bounded flows are also included for comparison. In the outer region of open channel flows (e.g.,
 $y/h>0.15\sim 0.2$) where VLSMs dominate,
 $\unicode[STIX]{x1D6FE}_{uu}$ is
 $0.5\sim 0.65$ and indicates that VLSMs contribute to over 50 % of the streamwise turbulence intensity, which is consistent with the reported value in pipe (Guala et al. Reference Guala, Hommema and Adrian2006) and closed channel flows (Balakumar & Adrian Reference Balakumar and Adrian2007) while greater than that in turbulent boundary layers (Balakumar & Adrian Reference Balakumar and Adrian2007). As discussed by Balakumar & Adrian (Reference Balakumar and Adrian2007) and Monty et al. (Reference Monty, Hutchins, Ng, Marusic and Chong2009), the variations in the streamwise kinetic energy carried by the VLSMs in different wall-bounded turbulent flows may be induced by the difference of flow geometry.
4.3 Free surface effects and relations to TKE redistribution
To clarify the free surface effects relating to VLSMs, comparisons are made between open channel and closed channel flows in this subsection, as the only difference between them is the upper boundary.
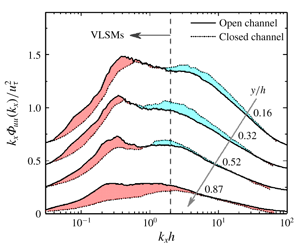
As has been documented for quite a long time, compared to closed channel flow, the presence of free surface in open channel will result in the redistribution of TKE (i.e., reduction of wall-normal fluctuations while strengthening the streamwise and spanwise ones). This TKE redistribution can be readily seen in figure 6(a), where the open channel flow shows a higher streamwise turbulence intensity than closed channel in the outer region at comparable Reynolds number. Given that the turbulence intensity is a statistical reflection of the inherent turbulence structures, the turbulence intensity difference implies a strong free surface effect on the turbulence structures.
Comparison of streamwise turbulence intensity (a) and premultiplied spectra (b,c) with closed channel flow at comparable Reynolds numbers. Solid lines are from C3 case,  $Re_{\unicode[STIX]{x1D70F}}=1508$,
 $Fr=1.43$; dash-dotted lines are from C4 case,
 $Re_{\unicode[STIX]{x1D70F}}=1903$,
 $Fr=0.91$; dashed lines are the data from closed channel flows: data in (a) are from Hoyas & Jiménez (Reference Hoyas and Jiménez2008),
 $Re_{\unicode[STIX]{x1D70F}}=2000$, and in (b,c) is from Balakumar & Adrian (Reference Balakumar and Adrian2007),
 $Re_{\unicode[STIX]{x1D70F}}=1584$. The lines in (b,c) from top to bottom are the premultiplied power spectra at
 $y/h=0.16$, 0.32, 0.52 and 0.87, respectively (as marked in panel a), with 0.2 added on each higher line. Shaded regions represent the difference between the curves of open channel and closed channel, with red and blue representing higher and lower value region in open channel flows.

To see what structure difference the free surface results in, the premultiplied spectra  $k_{x}\unicode[STIX]{x1D6F7}_{uu}(k_{x})$ at multiple
 $y$ positions (
 $y/h=0.16$, 0.32, 0.52 and 0.87) are compared between closed channel and present open channel flows at comparable Reynolds numbers (see figures 6b and 6c), among which the spectral results of closed channel flow (
 $Re_{\unicode[STIX]{x1D70F}}=1584$) are from Balakumar & Adrian (Reference Balakumar and Adrian2007). For the results of open channel flows, both C3 (
 $Re_{\unicode[STIX]{x1D70F}}=1508$,
 $Fr=1.43$, corresponding to the supercritical flow condition) and C4 (
 $Re_{\unicode[STIX]{x1D70F}}=1903$,
 $Fr=0.91$, corresponding to the subcritical flow condition) cases are presented to consider the potential Froude number effect. It should be noted here that the spectral curves in figures 6(b) and 6(c) for
 $y/h=0.16$, 0.32, 0.52 and 0.87 are shown from top to bottom with 0.2 added on each higher line. And the corresponding
 $y$ positions were marked with arrows in figure 6(a) to show the turbulent intensity difference at corresponding positions. For a better demonstration of the difference, the regions between the curves of open and closed channel flows are coloured, where red and blue regions denote higher and lower values in open channel, respectively.
As demonstrated in figure 6(b), in the near-wall positions (e.g.,  $y/h=0.16$ and 0.32), even though the area under open and closed channel curves is roughly the same given the turbulence intensities of the two flows are identical therein, the curves shape is slightly different, i.e., higher
 $k_{x}\unicode[STIX]{x1D6F7}_{uu}(k_{x})$ values in the low wavenumber range while lower
 $k_{x}\unicode[STIX]{x1D6F7}_{uu}(k_{x})$ values in the high wavenumber range of open channel flows as indicated by red and blue regions, respectively. This difference could be caused by some real and physical structure difference, but also could be an artificial difference resulting from the error in the integration and normalization process. More detailed comparative studies need to be carried out before we can come to a certain conclusion. Moving away from the wall, the area under the curves of open channel flow becomes bigger than that of closed channel flow because of the higher turbulence intensity in open channel flows. In addition, the curves of the two flow types tend to become identical in the high wavenumber range which could be seen from the vanishing of the blue region. It is also quite clear that extra area in open channel flows near the free surface (see the curves for
 $y/h=0.87$) mostly resides within the low wavenumber region. By checking the wavenumber, it can be readily known that this extra area is mostly contributed by VLSMs. The above spectral difference between closed and open channel flows presents at both supercritical (C3 case, see figure 6b) and subcritical (C4 case, see figure 6c) flow conditions with no observable difference seen between the two flow regimes, at least within the Froude number range considered in this study (
 $(0.8{-}0.91)<Fr<1.43$). More systematic experiments that cover a much wider Froude number range are needed to see whether any Froude number effect presents therein.
Combining the results in § 4.2 and figure 6, it can be readily seen that the free surface seems to sustain/promote the development and survival of VLSMs which in turn results in their further presence and higher strength in the outer layer of open channel. Despite the causality between the TKE redistributions and VLSMs still being unclear, the spectral difference between open channel and closed channel flows in the near surface region, which are almost all contributed from VLSMs, gives a strong indication of the close relationship between VLSMs and TKE redistributions.
5 Contributions to Reynolds stress
Premultiplied cospectra of streamwise and wall-normal velocity  $k_{x}\unicode[STIX]{x1D6F7}_{uv}(k_{x})$ will be presented in this section to investigate the contributions of VLSMs to the Reynolds shear stress.
Premultiplied cospectra of the streamwise and wall-normal velocity (a–e) and the fraction of Reynolds shear stress carried by VLSMs (f). Inner- and outer-scale normalizations are used in column (i) (left) and column (ii) (right), respectively. Symbols in (f) are the same as in figure 5(c).

Figure 7 shows the premultiplied cospectra  $k_{x}\unicode[STIX]{x1D6F7}_{uv}(k_{x})$ for all cases. In column (i) of figure 7, where inner-scale normalization is used, the most noticeable feature is the inner peak (see the black cross) near
 $y_{m}$ (the position where Reynolds shear stress reaches maximum, which is marked by black dotted lines). The peak area in cospectra for different cases share a similar wavelength range (
 $\unicode[STIX]{x1D706}_{x}^{+}\sim O(1000)$) with the power spectra of streamwise velocity as shown in figure 4. It confirms that the coherent structures near the wall are the major contributors to both streamwise turbulence intensity and Reynolds shear stress.
Normalization by outer scale  $h$ is used in column (ii) of figure 7 to highlight the situation in the outer layer. The cospectra share similar significant double peaks as the power spectra of streamwise velocity. The typical wavelength for VLSMs is
 $\unicode[STIX]{x1D706}_{x}/h\approx 20$, the same as the power spectra in figure 4; while the wavelength for LSMs reduces from
 $3h$ in streamwise velocity power spectra to
 $2h$ in cospectra. Thus, the behaviour of cospectra also supports the
 $3h$ dividing line between LSMs and VLSMs.
Following the definition of  $\unicode[STIX]{x1D6FE}_{uu}$, the fraction of Reynolds shear stress carried by the VLSMs,
 $\unicode[STIX]{x1D6FE}_{uv}$, can be obtained in identical ways and the wall-normal variations of
 $\unicode[STIX]{x1D6FE}_{uv}$ are presented in figure 7(f). Here,
 $\unicode[STIX]{x1D6FE}_{uv}$ increases monotonically between
 $0<y/h<0.5$. At
 $y/h=0.5$,
 $\unicode[STIX]{x1D6FE}_{uv}$ reaches approximately
 $0.5\sim 0.6$. After
 $y/h=0.5$,
 $\unicode[STIX]{x1D6FE}_{uv}$ decreases slightly and the reducing speed seems to increase when approaching the free surface region (
 $y/h>0.8$). Results from pipe, closed channel and TBL are also plotted in figure 7(f), and the value for present open channel is similar to that in pipe and closed channel, while larger than that in TBL. Summarizing over all flow scenarios, approximately 40 %–60 % of Reynolds shear stress comes from VLSMs in the outer region. Thus, combining the spectral results demonstrated in figures 4 and 7, it can be readily seen that VLSMs are both energetic and stress active across the entire outer region in open channel flows.
6 Contributions to the mean velocity
Net force spectra will be adopted in this section to investigate the contributions of VLSMs to the mean velocity.
The net force is defined as the  $y$-derivative of Reynolds shear stress. It was firstly studied by Guala et al. (Reference Guala, Hommema and Adrian2006) and then Chen et al. (Reference Chen, Adrian, Zhong, Li and Wang2014) introduced it into open channel flows. Assuming the flow in the middle plane of the channel is steady and uniform along
 $x$ and
 $z$ directions, the Reynolds equation can be simplified to
 $$\begin{eqnarray}\frac{\overline{\text{D}}U}{\overline{\text{D}}t}=0=g\sin \unicode[STIX]{x1D703}+\frac{\unicode[STIX]{x2202}(-\overline{uv})}{\unicode[STIX]{x2202}y}+\unicode[STIX]{x1D708}\frac{\unicode[STIX]{x2202}^{2}U}{\unicode[STIX]{x2202}y^{2}},\end{eqnarray}$$
where  $g\sin \unicode[STIX]{x1D703}$ and
 $\unicode[STIX]{x1D708}\unicode[STIX]{x2202}^{2}U/\unicode[STIX]{x2202}y^{2}$ are the gravitational and viscous force, respectively. Here,
 $\unicode[STIX]{x2202}(-\overline{uv})/\unicode[STIX]{x2202}y$ can be considered as a virtual force caused by turbulent fluctuation. The net force spectrum can be obtained from the
 $y$-derivative of cospectrum
 $$\begin{eqnarray}\frac{\text{d}(-\overline{uv})}{\text{d}y}=\int _{0}^{\infty }\frac{-\text{d}\unicode[STIX]{x1D6F7}_{uv}(k_{x})}{\text{d}y}\,\text{d}k_{x}.\end{eqnarray}$$
Equation (6.2) shows that the derivative of  $\unicode[STIX]{x1D6F7}_{uv}$ represents the contribution of a given range of wavenumbers to the net force. The positive (negative) value of net force spectrum at a given wavenumber translates into mean flow acceleration (retardation) caused by this wavenumber. As found by Guala et al. (Reference Guala, Hommema and Adrian2006), it is very difficult to obtain the smooth net force spectrum since we need sufficient spatial resolution and measurement accuracy to resolve the phase of the
 $u$ and
 $v$ signals (as opposed to the
 $uu$ or
 $vv$ spectra in which phase plays no role) and the spectrum changes within a small vertical distance. When obtaining the derivative spectrum at each
 $y$,
 $\unicode[STIX]{x0394}y$ is set to four times vector grid spacing in
 $y$ direction in order to reduce noise.
Premultiplied net force spectra (a–e) and the fraction of negative net force carried by the VLSMs (f). Inner- and outer-scale normalizations are used in column (i) (left) and column (ii) (right), respectively.

Figure 8 shows the net force spectrum for all cases. From column (i) of figure 8, all wavelength motions resolved here contribute positive net force near the wall. These regions all lie below the location of the maximum Reynolds shear stress  $y_{m}$. Hence the
 $y$-derivative of Reynolds shear stress profile must be uniformly positive, representing an acceleration of the near-wall layer. It is well known that sweeps carry high-momentum fluid from the upper region to the wall and then the near-wall layer is accelerated. The positive net force spectra in a wide range of wavelength imply that both LSMs and VLSMs constitute these sweeps. Moving away from the wall, a negative value appears in the low wavelength range. Different cases show similar features, that the low wavelength range is dominated by a negative value while the high wavelength range is dominated by a positive value.
The position of maximum Reynolds shear stress is located in the positive and negative coexistence region, where the positive value mostly resides within the VLSMs wavelength range as shown in column (ii) of figure 8. Therefore, the positive net force caused by VLSMs and the negative net force created by all other smaller scales will balance each other at the maximum Reynolds shear stress position. In other words, an important part of sweep motions is caused by these VLSMs. Combining with previous conclusions that VLSMs also constitute these sweeps in the near-wall regions, the results revealed by the net force spectra imply that the classic relatively small streamwise vortices and the imprints of VLSMs coexist in the near-wall region, as suggested by Hutchins & Marusic (Reference Hutchins and Marusic2007).
In the outer layer especially when  $y/h>0.3\sim 0.4$, all wavelength motions contribute negative net force. The fraction of negative net force carried by the VLSMs will be further discussed here to quantify the contributions of VLSMs to the negative net force, which can be defined as
 $$\begin{eqnarray}\unicode[STIX]{x1D6FE}_{net}=\frac{\displaystyle \int _{0}^{2\unicode[STIX]{x1D70B}/3h}\unicode[STIX]{x1D6F7}(k_{x})\,\text{d}k_{x}}{\displaystyle \int _{0}^{\infty }\unicode[STIX]{x1D6F7}(k_{x})\,\text{d}k_{x}},\end{eqnarray}$$
where
 $$\begin{eqnarray}\unicode[STIX]{x1D6F7}(k_{x})=\left\{\begin{array}{@{}ll@{}}0 & \text{if }-{\displaystyle \frac{\unicode[STIX]{x0394}\unicode[STIX]{x1D6F7}_{uv}(k_{x})}{\unicode[STIX]{x0394}y}}\geqslant 0,\\ -{\displaystyle \frac{\unicode[STIX]{x0394}\unicode[STIX]{x1D6F7}_{uv}(k_{x})}{\unicode[STIX]{x0394}y}} & \text{if }-{\displaystyle \frac{\unicode[STIX]{x0394}\unicode[STIX]{x1D6F7}_{uv}(k_{x})}{\unicode[STIX]{x0394}y}}<0.\end{array}\right.\end{eqnarray}$$
Figure 8(f) shows the variation of  $\unicode[STIX]{x1D6FE}_{net}$ with
 $y/h$. Although there is some scatter, the trends between different Reynolds numbers are the same. Here,
 $\unicode[STIX]{x1D6FE}_{net}$ increases from 0 to approximately 0.5 until
 $y/h=0.5$. Above
 $y/h=0.5$, it fluctuates within 0.5 to 0.65, which means that over 50 % of the negative net force is contributed by the VLSMs.
Summarizing over the results highlighted in figure 8 leads to the conclusion that VLSMs play a significant decelerating role in shaping the mean velocity profile in the outer region of open channel flows. Furthermore, as has been demonstrated in § 4, a higher strength of VLSMs persists in the outer region of open channel flows when compared with other wall turbulence scenarios. The inherent decelerating role accompanying with the higher strength of these VLSMs is supposed to make a great contribution to the smaller wake strength phenomenon in open channel flows.
7 Conclusions
Contributions of very large-scale motions to the turbulence statistics in open channel flows have been quantified based on the time-resolved particle image velocimetry experimental data obtained in smooth-walled open channels. The friction Reynolds number of the flow ranges from a low of 614 to a moderate of 2407. Smooth-wall conditions allow the comparisons with other wall-bounded flows and therefore the relevant and potential free-surface influence can be explicitly clarified. Velocity power spectral, cospectral and net force spectral analysis combined with scale separation were used to determine the contributions of VLSMs to the turbulent statistical quantities including turbulence intensity, Reynolds shear stress, and mean velocity, based on which the free surface effects on the characteristics of VLSMs and the contributions of VLSMs to the unique features of turbulence statistics in open channel flows (i.e., the redistribution of turbulent kinetic energy and smaller wake strength) have been clarified. Major findings are summarized as follows.
(1) The typical wavelength of VLSMs in smooth-wall open channel is approximately
 $20h$ ($h$ is the water depth), which is comparable to that reported previously in pipe and channel flow studies while smaller than that in rough wall open channel. More than 50 % of the streamwise turbulence intensity, Reynolds shear stress, and negative net force is contributed by the VLSMs in the outer layer of open channel flow.
(2) The free surface shows a strong effect and induces some unique features related with the VLSMs. Compared with other wall-bounded flows, the VLSMs in open channel flow maintain a relatively higher strength in the outer layer with non-negligible strength even in the near surface region (
$y\sim >0.8h$). This indicates that the free surface seems to sustain/promote the development of VLSMs.(3) Comparison between open channel and closed channel flows demonstrates that the extra streamwise turbulence intensity in the outer region of open channel flow is mainly contributed from the spectral content of VLSMs and implies the close relationships between VLSMs and the turbulent kinetic energy redistribution phenomenon in open channel flows.
(4) The VLSMs play important roles in the formation of the mean velocity profile, among which the VLSMs accelerate and decelerate the mean flow in the near-wall region and outer region, respectively. The inherent decelerating role of VLSMs combined with their higher strength in the outer region of open channel flow is supposed to make a great contribution to the smaller wake strength of the mean velocity in open channel flows.


Acknowledgements
The study was supported by the National Natural Science Foundation of China (grant no. 51809268) and the Fundamental Research Funds for the Central Universities (China Agricultural University, project no. 2019TC043). The authors would like to thank Professor S. Yang and Dr P. Zhang (National Inland Waterway Regulation Engineering Research Center, Chongqing Jiaotong University) for providing the experimental and technical support, and Professor Z. Yao (College of Water Resources and Civil Engineering, China Agricultural University) for providing partial computing resources. We also want to thank all the anonymous referees for their valuable comments to improve this paper.
Declaration of interests
The authors report no conflict of interest.



