





Nomenclature
- MILD
-
moderate or intense low-oxygen dilution combustion
- CO
-
carbon monoxide
- NOx
-
nitrogen oxides
- LPG
-
liquified petroleum gas
- SMD
-
Sauter mean diameter
- DND
-
droplet number density
Greek Symbol
-
 $\phi$
-
equivalence ratio

1.0 Introduction
In the early stages of combustion technology, liquid fuels gained significant attention due to their high energy density, ease of storage, transportation and relatively low costs as compared to gaseous fuels [Reference Reddy, Sawant, Trivedi and Kumar1]. However, the global energy sector is now shifting its focus towards decarbonisation [Reference Sorrentino, Sabia, De Joannon, Ragucci, Cavaliere and Göktolga2, Reference Srinivasarao, Jun, Lee and Reddy3]. This transition aims to reduce carbon-based emissions through CO2 capture, the adoption of combustion-free technologies and the use of carbon-free fuels. Despite their potential, carbon-free fuels such as hydrogen and ammonia pose considerable challenges for applications like gas turbines due to their lower energy density, storage difficulties and economic factors [Reference Srinivasarao and Reddy4]. As a result, there remains a pressing need to reduce emissions from existing combustion systems that rely on liquid fuels. Kerosene has emerged as a promising fuel for gas turbine applications. Numerous studies have explored kerosene combustion, focusing on flame characteristics and combustor design for low emissions [Reference Sharma, Kumar, Chowdhury, Yoon and Kumar5–Reference Khan, Gadgil and Kumar9]. There is a notable gap in experimental research involving actual gas turbine combustor configurations, particularly concerning the sustainability of the flameless combustion regime.
Flameless combustion, also sometimes referred to as MILD (moderate or intense low-oxygen dilution combustion) or distributed combustion, represents an advanced combustion regime characterised by a spatially distributed reaction zone and a highly uniform temperature field throughout the combustion chamber [Reference Khidr, Eldrainy and El-Kassaby10]. This combustion mode is typically established through strong internal recirculation of combustion products, which enables substantial dilution of fresh reactants with inert species and facilitates preheating of the fresh reactant mixture [Reference Reddy, Sawant, Trivedi and Kumar1, Reference Reddy, Katoch, Roberts and Kumar6]. The combined effects of dilution and preheating suppress localised high-temperature regions, thereby mitigating temperature hot spots and significantly reducing thermal NOx formation as well as CO emissions [Reference Overman, Cornwell and Gutmark11–Reference Derudi and Rota14]. A defining feature of flameless combustion is the absence of a visible flame front, with emission levels generally reported to be below 10 ppm under ideal operating conditions [Reference Khidr, Eldrainy and El-Kassaby10].
Achieving flameless combustion with liquid fuels is inherently more complex than with gaseous fuels, primarily due to the additional multistage physical processes that precede chemical reaction. Unlike gaseous fuels, liquid fuels must first undergo atomisation into fine droplets, followed by droplet heating, evaporation and subsequent mixing with the oxidiser before entering the reactive phase [Reference Reddy, Sawant, Trivedi and Kumar1]. These processes introduce significant spatial and temporal non-uniformities in mixture fraction and temperature fields, which hinder the establishment of a homogeneous distributed reaction zone. Consequently, in practical combustion systems, a localised high-temperature flame core often develops in the vicinity of the fuel injector or within the central recirculation region of the combustor. This localised reaction zone deviates substantially from the idealised flameless combustion regime, which is characterised by volumetrically distributed heat release and the absence of visible flame fronts.
Previous experimental and numerical studies investigating flameless combustion of liquid fuels, particularly kerosene in gas turbine combustors, have largely relied on elevated reactant preheating and external dilution techniques to suppress flame stabilisation and promote distributed combustion [Reference Sharma, Chowdhury and Kumar15, Reference Mardani, Kalat and Azimi16]. Reactant preheating increases the reactant temperature above the autoignition threshold, while external dilution with inert gases (e.g. nitrogen or exhaust gases) reduces oxygen concentration and moderates reaction rates, thereby facilitating distributed combustion conditions [Reference Katsuki and Hasegawa17–Reference Perpignan, Rao and Roekaerts20].
Furthermore, the fundamental characteristics and operational boundaries of flameless, MILD, and distributed combustion regimes have been comprehensively analysed in the literature. In particular, Srinivasarao et al. [Reference Srinivasarao, Sorrentino and Reddy21] provided an in-depth assessment of the governing parameters, including dilution ratio, reactant temperature, residence time and turbulence intensity, that dictate the transition between conventional flame-based combustion and distributed reaction modes. Their work elucidates the thermo-chemical and fluid dynamic criteria required for sustaining flameless combustion and highlights the challenges associated with extending these regimes to liquid-fuel-based practical combustors.
Due to the intrinsic challenges associated with establishing and sustaining flameless combustion mode, a substantial body of experimental research has relied on simplified laboratory-scale burner configurations that employ external dilution and reactant preheating strategies [Reference Mardani, Kalat and Azimi16, Reference Katsuki and Hasegawa17, Reference Guillou, Gutmark and Cornwell22]. As a result, a significant portion of the existing literature is based on highly idealised experimental platforms that do not adequately represent the complex thermo-fluid and chemical interactions encountered in practical industrial combustors or gas turbine systems [Reference Mardani, Kalat and Azimi16]. For instance, Mardani et al. [Reference Mardani, Kalat and Azimi16] emphasised the considerable difficulties in achieving stable flameless combustion when using liquid fuels, highlighting the necessity of elevated fresh reactant preheating temperatures [Reference Sharma, Chowdhury and Kumar15], substantial external dilution using inert gases such as nitrogen [Reference Reddy, Sawant, Trivedi and Kumar1, Reference Sharma, Chowdhury and Kumar15, Reference Mardani, Kalat and Azimi16] and the implementation of novel burner geometries [Reference Reddy, Sawant, Trivedi and Kumar1, Reference Reddy, Katoch, Roberts and Kumar6] to facilitate distributed reaction zones and suppress localised flame fronts.
However, from a practical engineering perspective, these requirements pose significant implementation challenges. Preheating large volumes of incoming combustion air to the required temperature levels is often impractical or energetically inefficient in real-world applications. Similarly, introducing large quantities of inert diluents to achieve the high dilution ratios necessary for flameless operation is operationally complex and economically prohibitive, particularly for industrial-scale systems. Furthermore, the incorporation of unconventional combustion chamber geometries into existing engine platforms would necessitate substantial modifications to the overall engine architecture, thereby limiting the adaptability and retrofit potential of the proposed combustor designs.
In addition to these practical constraints, several studies have reported that flameless combustion systems can still exhibit carbon monoxide (CO) and nitrogen oxides (NOx) emission levels exceeding 40 ppm under certain operating conditions [Reference Sharma, Kumar, Chowdhury, Yoon and Kumar5, Reference Reddy, Katoch, Roberts and Kumar6, Reference Sharma, Chowdhury and Kumar15, Reference Li, ElKady and Evulet23, Reference Kumar, Paul and Mukunda24], which undermines the perceived environmental advantages of this combustion mode. Consequently, there is a critical need for a comprehensive and systematic investigation of flameless combustion performance under realistic operating conditions, including conventional combustor geometries. Such an understanding is essential for advancing flameless combustion technology towards practical deployment and for achieving genuinely ultra-low CO and NOx emission targets in industrial and gas turbine applications.
In the present study, a can-type combustor is used to investigate various air staging strategies aimed at achieving flameless combustion with atmospheric air supply (298 K and 1 atm). Flameless combustion is a pioneering technology for attaining ultra-low emissions by promoting sufficient internal recirculation, which enhances combustion performance and reduces local high-temperature zones. This reduction in temperature hotspots helps lower NOx and CO emissions while maintaining effective combustion temperatures. The can combustor consists of four air inlets: swirler, primary stage, secondary stage and dilution stage. The individual airflow rates through these inlets must be carefully optimised to achieve stable flameless combustion. The optimisation of air staging was performed at a thermal input of 20 kW for equivalence ratios (
 $\phi$
) of 0.5, 0.6 and 0.7. These preliminary investigations were used to identify the optimal air staging strategy. To evaluate the robustness of the selected strategy at higher thermal input, additional experiments were conducted at 30 kW with
 $\phi$
= 0.7. Furthermore, the chosen air staging strategy was extensively tested at both 20 kW and 30 kW over a wider equivalence ratio range of 0.5 to 1.1. The present atmospheric inlet conditions (1 bar and 298 K) were intentionally considered to fundamentally investigate the influence of air staging on combustor performance under controlled baseline operating conditions. Such operating conditions are also encountered during certain operational phases of propulsion gas turbines, particularly during transition from high-altitude low-pressure conditions towards higher-pressure operating regimes in jet engine applications.
2.0 Experimental methodology
The experiments primarily focus on improving the combustion performance of the can-type combustor, particularly considering the narrow operational window of the flameless combustion mode. A can-type combustor capable of producing flameless/distributed combustion was used to investigate the influence of air staging on kerosene flames [Reference Sharma, Chowdhury and Kumar15]. In earlier studies, flameless operation was achieved at an equivalence ratio of 0.7 using preheated air at approximately 800 K [Reference Sharma, Chowdhury and Kumar15]. However, such high inlet air temperatures typically occur under high-pressure combustor operating conditions, whereas the present combustor is operated at atmospheric pressure.
In the present study, air preheating was deliberately eliminated to assess the combustor’s ability to sustain flameless combustion under more practical operating conditions. This requires a detailed evaluation of combustor performance under various air-flow distribution configurations. Accordingly, experiments were conducted over a wide range of operating conditions, including different air staging strategies, equivalence ratios and thermal input levels, rather than limiting the investigation to a single flameless operating point. These experiments demonstrate the feasibility of achieving flameless combustion under diverse operating conditions.
The combustor is mounted in a vertical orientation, with the liquid-fuel injector and swirler positioned at the bottom. A centrally located kerosene injector is surrounded by a swirler designed to enhance internal recirculation. The swirler comprises five slots, each with a diameter of 3 mm, arranged at a 60° angle, similar to the configuration reported in the earlier study [Reference Sharma, Chowdhury and Kumar15]. The can-type combustor incorporates four air inlet stages: swirler, primary, secondary and dilution. Achieving flameless combustion requires optimised air-flow distribution among these stages; therefore, air-flow optimisation was initially conducted at a thermal input of 20 kW. Air is supplied to all four stages using Aalborg electric mass flow controllers with an accuracy of ±1.5% of full scale. Liquid fuel is delivered through a stainless-steel injection system, with the fuel chamber pressurised using a nitrogen cylinder to achieve the required injection pressure. Flame initiation is accomplished using a liquified petroleum gas (LPG) pilot burner positioned 40 mm offset from the liquid-fuel injector. The experimental setup with the pilot flame is shown in Fig. 1, and the schematic line diagram of the system is presented in Fig. 2.
Experimental setup of the can combustor and pilot flame.

Figure 1. Long description
The image consists of three photos showing the experimental setup of a can combustor and pilot flame. Panel A: The first photo shows the overall setup of the can combustor. Visible components include the combustor, thermocouples, swirler air inlet, and dilution air inlet. Panel B: The second photo provides a closer view of the pilot flame external connections and the fuel inlet pipe. Panel C: The third photo shows a detailed view of the swirler and the pilot flame, with the fuel nozzle also visible.
The pilot flame arrangement is shown in detail in Fig. 1. Initially, the pilot flame is stabilised by supplying air through a rotameter and LPG through a mass flow controller (MFC). Once the 3 kW LPG pilot flame is fully established, approximately 100 LPM of air is introduced through the swirler and primary injection ports. Liquid fuel is then supplied at an injection pressure of 5 bar, allowing the kerosene flame to stabilise. After achieving stable kerosene combustion, the air and LPG supplies to the pilot burner are switched off, and the corresponding valves are closed. Following a preheating period of approximately 5 minutes, air is gradually introduced into the secondary and dilution stages while simultaneously increasing the liquid fuel flow rate. This procedure ensures a stable transition to the desired operating conditions.
A solid cone-type pressure swirl nozzle was used in the present experimental study. Shadowgraphy experiments were conducted using an independent non-reacting flow setup to quantify key spray characteristics, including the Sauter mean diameter (SMD), spray velocity and droplet number density (DND). Additional details of the experimental arrangement are provided in Ref. [Reference Sharma, Chowdhury and Kumar15]. Cold-flow measurements indicate that at an injection pressure of 9 bar, the nozzle produces a spray cone angle of 45° with an SMD of 35 µm. Increasing the injection pressure to 14 bar widens the spray cone angle to 56° and results in a slight reduction in SMD to 34 µm. Key atomiser parameters, including fuel flow rates and injection velocities, are summarised in Table 1.
Atomiser details. 9NZ1: NZ1 atomiser at an injection pressure of 9 bar, nozzle diameter of 0.187 mm

Table 1 Long description
A table comparing key atomizer parameters at different injection pressures. The table has four rows and five columns. Column headers are Sl No., Inj. pressure (bar), Mass flowrate (kg/hr), P (kW), and Velocity (m/s). Row 1: Sl No. 9NZ1, Inj. pressure 9, Mass flowrate 1.7, P 20.6, Velocity 22.04. Row 2: Sl No. 14NZ1, Inj. pressure 14, Mass flowrate 2.5, P 30, Velocity 32.4.
Line diagram of the experimental setup.

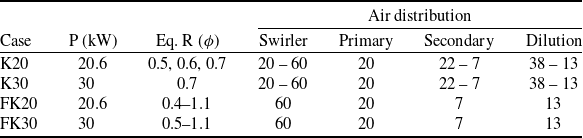
The desired operating conditions for the K20 cases are summarised in Table 2, which provides details of all experiments conducted in the present study. The K20 cases correspond to a thermal input of 20 kW with equivalence ratios (
 $\phi$
) ranging from 0.5 to 0.7, implemented using five different air staging operations. The K30 cases correspond to a thermal input of 30 kW at
 $\phi$
= 0.7, also using five air staging operations. In contrast, the FK20 and FK30 cases represent the finalised air staging strategy, tested over a wider equivalence ratio range of 0.5 to 1.1. The investigations were performed using measurements of temperature, gaseous emissions, acoustic emissions and direct flame imaging captured from the top of the combustor.
Previous investigations similar to the present study were reported by Sharma et al. [Reference Sharma, Chowdhury and Kumar15], using the same burner configuration. Their work employed preheated air at 800 K and 950 K, which enhanced droplet evaporation and combustion performance. However, the influence of air staging with varying air distribution ratios has not been systematically investigated and therefore constitutes the primary focus of this study. The objective is to elucidate the role of air distribution on combustion performance while achieving flameless kerosene combustion under atmospheric operating conditions. Table 2 shows the typical operation conditions in the present study.
Typical gas turbine combustors operate with thermal intensities ranging from approximately 5–40 MW/m3·atm for industrial systems, while even higher values are reported for aero-engine combustors depending on operating pressure and combustor compactness [Reference Arghode and Gupta25]. In the present work, the thermal intensity ranges between 30 and 40 MW/m³·atm, indicating that the compactness of the present burner configuration is comparable to that of practical gas turbine combustors.
Operating conditions considered for the investigation

Table 2 Long description
A table comparing operating conditions for different cases. The table has five rows and six columns. Column headers are Case, P (kW), Eq. R (phi), Swirler, Primary, Secondary, and Dilution. Row 1: Case K20, P 20.6, Eq. R 0.5, 0.6, 0.7, Swirler 20 - 60, Primary 20, Secondary 22 - 7, Dilution 38 - 13. Row 2: Case K30, P 30, Eq. R 0.7, Swirler 20 - 60, Primary 20, Secondary 22 - 7, Dilution 38 - 13. Row 3: Case FK20, P 20.6, Eq. R 0.4-1.1, Swirler 60, Primary 20, Secondary 7, Dilution 13. Row 4: Case FK30, P 30, Eq. R 0.5-1.1, Swirler 60, Primary 20, Secondary 7, Dilution 13.
Accuracy of the instruments used in present study

Table 3 Long description
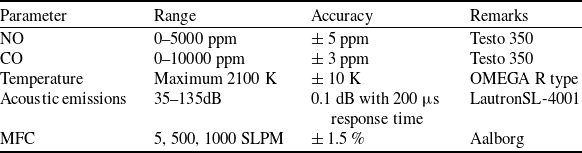
A table comparing the accuracy of various instruments used in a study. The table has five rows and four columns. The columns are labeled Parameter, Range, Accuracy, and Remarks. Row 1: Parameter, NO; Range, 0-5000 ppm; Accuracy, plus or minus 5 ppm; Remarks, Testo 350. Row 2: Parameter, CO; Range, 0-10000 ppm; Accuracy, plus or minus 3 ppm; Remarks, Testo 350. Row 3: Parameter, Temperature; Range, Maximum 2100 K; Accuracy, plus or minus 10 K; Remarks, OMEGA R type. Row 4: Parameter, Acoustic emissions; Range, 35-135 dB; Accuracy, 0.1 dB with 200 microsecond response time; Remarks, LautronSL-4001. Row 5: Parameter, MFC; Range, 5, 500, 1000 SLPM; Accuracy, plus or minus 1.5 percent; Remarks, Aalborg.
2.1 Experimental uncertainties
The uncertainties associated with the measurements of fuel and air flow rates, temperature, emissions, acoustic levels, equivalence ratio and heat input were evaluated. The maximum uncertainty in the air and fuel flow measurements was estimated to be ±17 L min−1 and ±0.8 L min−1, respectively. Temperature measurements showed a maximum uncertainty of ±5 K, considering both thermocouple accuracy (±2 K or 0.25 % of reading, whichever is greater) and instrument uncertainty (±2 K). The uncertainty in sound level measurements was within ±1 dB. For emission measurements, the estimated uncertainty in CO emissions was ±5 % of the recorded value. In the case of NOx emissions, the uncertainty was ±2 ppm within the measurement range of 0–99.9 ppm and ±5 % of the measured value beyond this range.
3.0 Results and discussion
In this section, the temporal stability of the measurements is highlighted. The results are reported as mean values with corresponding error bars representing fluctuations observed during the measurement period. These statistical representations are used in the subsequent sections. Figure 3 presents the continuous temperature and acoustic emission measurements, with thermocouples located at the combustor centre and exit. K20-S20 indicates a case with K20 and 20% of the total air entering through the swirler. In cases K20-S20 and K20-S30, lower internal temperatures were observed due to flame stabilisation outside the combustor. In K20-S40, the flame was partially stabilised inside the burner but extended outside the combustor, resulting in the highest internal temperature. Case K20-S50 exhibited a flame located close to the thermocouple, yielding a moderate internal temperature of approximately 1670 K. In contrast, K20-S60 produced a well-stabilised distributed flame near the swirler, with internal and exit temperatures of 1610 K and 1212 K, respectively. The exit temperatures for K20-S50 and K20-S60 were comparable, indicating stable combustion within the combustor.
Measured (a) temperature and (b) acoustic emissions with time at
 $\phi$
= 0.7.

Figure 3. Long description
Panel A: A line graph shows temperature in Kelvin (K) on the vertical axis and time in seconds (s) on the horizontal axis. The graph includes multiple lines representing different conditions: K20-S20-T1, K20-S20-Te, K20-S30-T1, K20-S30-Te, K20-S40-T1, K20-S40-Te, K20-S50-T1, K20-S50-Te, K20-S60-T1, and K20-S60-Te. The lines indicate the combustor inside temperature (T1) and exhaust temperature (Te) over a period of 200 seconds. Panel B: Another line graph displays sound level in decibels (dB) on the vertical axis and time in seconds (s) on the horizontal axis. This graph includes lines for K20-S20, K20-S30, K20-S40, K20-S50, and K20-S60, showing the acoustic emissions over the same period of 200 seconds.
Acoustic emissions increased with increasing airflow through the swirler, rising from 82 dB in K20-S20 to 89 dB in K20-S60, attributable to enhanced turbulence intensity. Notably, case K20-S60 achieved substantial emission reductions of 64% in CO, 34% in NOx and 37% in NO. Importantly, the measured acoustic levels remained within the typical range reported for flameless combustion, consistent with literature findings [Reference Reddy, Katoch, Roberts and Kumar6, Reference Khidr, Eldrainy and El-Kassaby10].
3.1 Initial observations
The observations made for the operating condition 20.6 kW and
 $\phi$
= 0.7, using different air staging strategies have been presented in this section. Figure 4 illustrates the measured CO, NO and NOx emissions alongside data from Sharma et al. 2020 [Reference Sharma, Chowdhury and Kumar15]. In Sharma et al.’s study, 15% of the total air was supplied through the swirler, achieving the lowest emissions reported. Excitingly, our results reveal that adjusting the percentage of air entering through the swirler significantly influences emission behaviour. Notably, increasing the airflow through the swirler leads to notable reductions in both CO and NOx emissions. Unlike the setup used by Sharma et. al. [Reference Sharma, Chowdhury and Kumar15], where preheated air played a key role, here the evaporation of fuel droplets is primarily driven by the swirling intensity. As the swirler air percentage rises, droplet evaporation accelerates, combustion delay decreases and more stable, well-distributed flames are produced. Conversely, when the air supplied through the swirler is below 50%, the flame shifted downstream of the burner. These observations are further emphasised in the subsequent sections.
Comparison between measured emissions and Sharma et al. 2020 [Reference Sharma, Chowdhury and Kumar15].

3.2 Influence of air staging
Figure 5 presents the measured mean temperatures at the combustor centre and exit for different air staging cases at a thermal input of 20 kW and equivalence ratios (
 $\phi$
) of 0.5, 0.6 and 0.7. The central combustor temperatures are relatively low (<1400 K) for the K20-S20 and K20-S30 cases, primarily due to the flame being located downstream of the combustor. In contrast, the K20-S40 case exhibits the highest central temperatures, indicating the presence of a core flame in the central axial region and a shift of the flame from outside to inside the combustor. Subsequently, the K20-S50 and K20-S60 cases show moderate central temperatures, as illustrated in Fig. 5(a), reflecting more uniform internal temperature distributions and a more distributed and stabilised combustion regime. The trend of central temperature variation changes beyond the K20-S40 case. For K20-S20 to K20-S40, the central temperatures increase with decreasing equivalence ratio due to increased local oxygen availability and limited internal recirculation. Once the flame stabilises within the combustor (K20-S40 onward), the trend is altered, indicating a transition from an initial phase dominated by local equivalence ratio effects and weak recirculation to a second phase characterised by improved internal recirculation and flame stabilisation.
Measured temperatures (a) inside combustor and (b) at exit of the combustor for 20 kW thermal input.

The exit temperature trends show that cases with increased air supply through the swirler (K20-S50 and K20-S60) produce relatively uniform and controlled exit temperatures, whereas earlier staging cases (K20-S20, K20-S30 and K20-S40) exhibit larger variations, indicating flame migration outside the combustor, as shown in Fig. 5(b). The exit temperature trends with equivalence ratio follow similar behaviour to the central temperatures. Overall, these results demonstrate that optimised air staging plays a crucial role in flame stabilisation, internal heat distribution and exit temperature uniformity, which are key indicators of achieving distributed (flameless) combustion behaviour.
Figure 6 presents the measured CO emissions for various air staging cases operating at 20 kW for
 $\phi$
= 0.5, 0.6 and 0.7. CO is a key emission in hydrocarbon fuel combustion. The variation in CO emissions with equivalence ratio (
 $\phi$
) showed a substantial change of 35% when moving from the K20-S20 to K20-S30 case. However, this variation was reduced to less than 10% for higher swirler air cases (K20-S40 and above). Notably, without air preheating, increasing the air through the swirler had a significant impact on both flame temperatures and CO emissions. This effect of air staging is further reflected in the notably low emissions observed in this study. The highest CO emission recorded was 290 ppm, while the lowest was just 3 ppm. Particularly, the K20-S50 and K20-S60 cases achieved CO emissions below 10 ppm across all operating conditions, representing the lowest values reported under these equivalence ratios in the literature. Overall, CO emissions remain low from K20-S40 to K20-S60, demonstrating the effectiveness of increased swirler air in minimising emissions.
Measured CO emissions at exit of the combustor for 20 kW thermal input.

Measured (a) NO and (b) NOx emissions at the exit of the combustor for 20 kW thermal input.

Figure 7 depicts the measured NO and NOx emissions for various air-staging cases operating at 20 kW for equivalence ratios of
 $\phi$
= 0.5, 0.6 and 0.7. The present can combustor operates under air-staged and atmospheric air conditions. As discussed in the previous sections, air temperature variation is a key challenge for enhancing fuel vaporisation and achieving distributed flames. The air passing through the swirler plays a dominant role in promoting recirculation and mixing within the combustor. With increasing swirler air flow, the flame is pulled back towards the base of the combustor. In addition, local equivalence ratio variations significantly influence emission behaviour. Consequently, the combined effects of local equivalence ratio distribution and recirculation intensity result in distinct trends in NO and NOx emissions. However, after the K20-S40 case, where the flame shifts inside the combustor, the emissions and thermal behaviour follow conventional flame trends with respect to equivalence ratio. Nevertheless, the absolute magnitudes of NO and NOx emissions remain substantially lower compared to those produced by conventional flame configurations.
A maximum NOx emission of 28 ppm was observed for the K20-S20 case at an equivalence ratio of
 $\phi$
= 0.7. Similar to the trends observed in the measured temperature and CO emissions, NOx emissions also exhibited a comparable dependence on equivalence ratio with variations in swirler air quantity. The NOx and NO emissions were significantly lower for all tested equivalence ratios in the K20-S50 and K20-S60 cases, remaining within 10 ppm as shown in Fig. 7(b). The lowest NOx and NO emissions of 7 ppm and 6 ppm, respectively, were recorded for all equivalence ratios under the K20-S50 and K20-S60 conditions. Emissions below 10 ppm are classified as ultra-low emissions in the literature and are typically associated with advanced combustion technologies such as flameless combustion. Therefore, based on the combined observations of emission characteristics and temperature behaviour, the flameless operation achieved in the K20-S50 and K20-S60 cases demonstrated emission levels within the ultra-low NOx regime (<10 ppm).
Measured acoustics emissions of the combustor at 20 kW thermal input.

Figure 8 shows the measured acoustic emissions for various air-staging cases operating at 20 kW for equivalence ratios of
 $\phi$
= 0.5, 0.6 and 0.7. A maximum noise level of 96 dB was observed for the K20-S30 case at
 $\phi$
= 0.5. The acoustic emissions decreased continuously with increasing swirler air flow (from K20-S20 to K20-S60), as shown in Fig. 8. Interestingly, this trend was altered for flames operating at
 $\phi$
= 0.6 and 0.7. Acoustic emissions are also considered an important indicator of flameless combustion. Therefore, when the measured acoustic emissions were compared with the reported ranges in the literature, they were found to be consistent with flameless combustion behaviour [Reference Reddy, Katoch, Roberts and Kumar6, Reference Sharma, Chowdhury and Kumar15]. The lower acoustic emissions observed in the flameless combustion regime are mainly attributed to the distributed heat release and the absence of strong localised flame fronts. The enhanced internal recirculation and improved reactant mixing reduce pressure fluctuations and combustion instabilities compared to the conventional flame regime.
Based on the emission and temperature behaviour, it was observed that the K20-S60 flames exhibited a significant reduction in emissions and improved combustion performance. Therefore, further experiments were conducted over a wide range of equivalence ratios (
 $\phi$
= 0.4–1.1) for the K20-S60 configuration. Figure 9 shows the variation of measured emissions, temperature and acoustic emissions for K20-S60 at
 $\phi$
= 0.4–1.1. The CO and NOx emissions were found to be below 30 ppm for all equivalence ratios. However, these emissions remained within 10 ppm up to
 $\phi$
= 0.8, which corresponds to the typical operating range of practical gas turbine applications. The lowest emissions of CO, NOx and NO were recorded as 3 ppm, 4 ppm and 3 ppm, respectively, at
 $\phi$
= 0.4.
The acoustic emissions remained almost within the same range; however, a marginal reduction was observed with increasing equivalence ratio, as shown in Fig. 9. The central temperatures were also nearly constant, with a maximum variation of about 100 K across the tested equivalence ratios. In contrast, the exhaust gas temperature exhibited an increasing trend with increasing equivalence ratio. This behaviour is mainly attributed to the dilution air contribution, since the combustor centre temperatures remained nearly unchanged. These observations confirm that optimised air staging enables stable flameless combustion while maintaining uniform core temperatures and controlling exhaust thermal profiles.
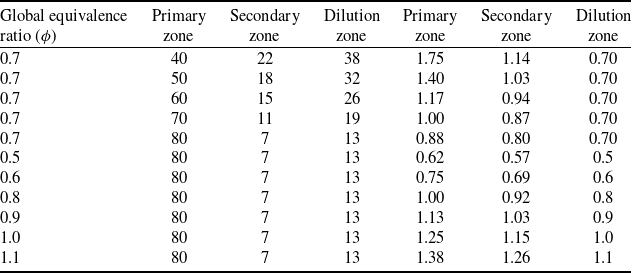
Local equivalence ratios for the various swirl flow condition

Table 4 Long description
The table presents data on local equivalence ratios for different swirl flow conditions. It has 11 rows and 7 columns. The columns are labeled as follows: Global equivalence ratio (φ), Primary zone, Secondary zone, Dilution zone, Primary zone, Secondary zone, and Dilution zone. The rows list specific values for each condition. For example, Row 1: Global equivalence ratio (φ), 0.7; Primary zone, 40; Secondary zone, 22; Dilution zone, 38; Primary zone, 1.75; Secondary zone, 1.14; Dilution zone, 0.70. Row 2: Global equivalence ratio (φ), 0.7; Primary zone, 50; Secondary zone, 18; Dilution zone, 32; Primary zone, 1.40; Secondary zone, 1.03; Dilution zone, 0.70. Row 3: Global equivalence ratio (φ), 0.7; Primary zone, 60; Secondary zone, 15; Dilution zone, 26; Primary zone, 1.17; Secondary zone, 0.94; Dilution zone, 0.70. Row 4: Global equivalence ratio (φ), 0.7; Primary zone, 70; Secondary zone, 11; Dilution zone, 19; Primary zone, 1.00; Secondary zone, 0.87; Dilution zone, 0.70. Row 5: Global equivalence ratio (φ), 0.7; Primary zone, 80; Secondary zone, 7; Dilution zone, 13; Primary zone, 0.88; Secondary zone, 0.80; Dilution zone, 0.70. Row 6: Global equivalence ratio (φ), 0.5; Primary zone, 80; Secondary zone, 7; Dilution zone, 13; Primary zone, 0.62; Secondary zone, 0.57; Dilution zone, 0.5. Row 7: Global equivalence ratio (φ), 0.6; Primary zone, 80; Secondary zone, 7; Dilution zone, 13; Primary zone, 0.75; Secondary zone, 0.69; Dilution zone, 0.6. Row 8: Global equivalence ratio (φ), 0.8; Primary zone, 80; Secondary zone, 7; Dilution zone, 13; Primary zone, 1.00; Secondary zone, 0.92; Dilution zone, 0.8. Row 9: Global equivalence ratio (φ), 0.9; Primary zone, 80; Secondary zone, 7; Dilution zone, 13; Primary zone, 1.13; Secondary zone, 1.03; Dilution zone, 0.9. Row 10: Global equivalence ratio (φ), 1.0; Primary zone, 80; Secondary zone, 7; Dilution zone, 13; Primary zone, 1.25; Secondary zone, 1.15; Dilution zone, 1.0. Row 11: Global equivalence ratio (φ), 1.1; Primary zone, 80; Secondary zone, 7; Dilution zone, 13; Primary zone, 1.38; Secondary zone, 1.26; Dilution zone, 1.1.
Measured acoustics emissions of the combustor.

Figure 9. Long description
A line graph depicting the relationship between equivalence ratio and various emissions and temperatures. The horizontal axis represents the equivalence ratio ranging from 0.35 to 1.15. The left vertical axis represents exhaust emissions in parts per million at 15 percent oxygen and acoustic emissions in decibels, ranging from 1 to 100. The right vertical axis represents temperature in Kelvin, ranging from 1000 to 1600. The graph includes six data lines: CO (black dotted line with diamond markers), NOx (red dashed line with square markers), NO (blue dashed line with circle markers), Acoustic Emissions (purple dashed line with circle markers), Central Temperature (green dashed line with square markers), and Exhaust Temperature (red dashed line with triangle markers). Each line shows how the respective parameter changes with varying equivalence ratios. CO emissions increase and then decrease, peaking around an equivalence ratio of 0.85. NOx and NO emissions follow a similar trend, with peaks around the same equivalence ratio. Acoustic emissions remain relatively constant across the range. Central and exhaust temperatures increase with the equivalence ratio, peaking around 0.85 and then slightly decreasing.
The expected equivalence ratios corresponding to the various swirl flow rates are shown in Table 4. It is observed that the flame behaviour inside the combustion chamber is strongly influenced by the local equivalence ratio distribution. Under lean operating conditions, increasing the airflow through the swirler enhances the swirling intensity and strengthens the internal recirculation zone, which promotes improved fuel–air mixing and enhanced combustion performance. Under rich operating conditions, the increased residence time of the air within the annular region contributes to enhanced preheating and stabilisation of the combustion process, thereby improving combustor performance.
A similar trend is also observed at higher swirl flow rates, where enhanced reactant residence time and improved mixing characteristics contribute to better combustion behaviour. In contrast, supplying higher airflow rates through the dilution zone tends to reduce the residence time of the reactants inside the primary combustion region, which can adversely affect flame stability and combustion efficiency.
Furthermore, higher airflow rates through the swirler promote stronger local mixing between fuel and oxidiser, resulting in locally improved oxygen availability and enhanced combustion characteristics.
3.3 Influence of thermal input on selected air staging
The selected air-staging strategy was further evaluated to assess its robustness under different thermal input conditions. Accordingly, the present section compares the air-staging performance at thermal inputs of 20 kW and 30 kW at an equivalence ratio of
 $\phi$
= 0.7. Figure 10 presents the measured CO, NOx and NO emissions for 20 kW and 30 kW across equivalence ratios ranging from
 $\phi$
= 0.4 to 1.1. Similar emission trends were observed for both thermal input conditions across the various air-staging cases, with emissions increasing up to the K20-S40 configuration and subsequently decreasing with further increases in swirler air flow.
The maximum CO emissions increased from 190 ppm to 290 ppm when the thermal input was increased from K20-S20 to K30-S20. Similarly, the lowest CO emissions increased slightly from 6 ppm to 7 ppm for the same operating conditions. The minimum NO emissions also increased from 7 ppm to 11 ppm when moving from K20-S20 to K30-S20. Overall, a similar trend of reduced emissions was observed for both K20-S50 and K20-S60 cases at 20 kW and 30 kW, indicating that higher swirler air fractions consistently resulted in lower emission levels. This indicates that the selected air-staging strategy maintains consistent emission control behaviour even at elevated thermal loads, demonstrating its robustness for practical combustion applications.
Figure 11 shows the variation of temperature and emissions with equivalence ratio (0.5–1.1) for the K20-S60 and K30-S60 cases. The measured temperatures and emissions for the K30-S60 case followed similar trends to those observed for K20-S60 with changes in equivalence ratio. The CO and NO emissions were found to vary maximum within ±15% in magnitude at a given equivalence ratio. Likewise, the central and exhaust gas temperatures were within ±10% variation for most operating conditions between the K20-S60 and K30-S60 cases. Under lean operating conditions, the K30-S60 case exhibited an improved temperature of approximately 5%, indicating enhanced combustion performance with increased thermal input under the optimised air-staging configuration. The lowest CO and NO emissions of 7 ppm and 5 ppm, respectively, were recorded at a thermal input of 30 kW and
 $\phi$
= 0.5. This confirms that the optimised air-staging strategy maintains stable flameless combustion characteristics even at higher thermal loads, with only marginal changes in emissions and thermal fields. This is further highlighted in the next section.
Measured exhaust gas emissions of the combustor at different air staging cases operating at 20 kW and 30 kW at
 $\phi$
= 0.7.

Measured exhaust gas emissions of the combustor at different air staging cases operating at 20 kW and 30 kW.

Figure 11. Long description
A line graph with the horizontal axis labeled Equivalence Ratio ranging from 0.35 to 1.15 and the left vertical axis labeled Exhaust Emissions PPM at 15 percent O2 ranging from 1 to 100, and the right vertical axis labeled Temperature K ranging from 1000 to 1600. The graph includes multiple data series: K 20 CO, K 30 CO, K 20 NO, K 30 NO, K 20 Central Temperature, K 20 Exhaust Temperature, K 30 Central Temperature, and K 30 Exhaust Temperature. Each series is represented by different symbols and line styles. The K 20 CO and K 30 CO series show an increase in emissions with increasing equivalence ratio. The K 20 NO and K 30 NO series also show an increase in emissions but with different trends. The temperature series show varying trends with central temperatures generally higher than exhaust temperatures.
Direct flame images for different air staging cases operating at 20 kW and 30 kW.

3.4 Direct flame images
In addition to point measurements, direct flame images were captured from the top of the combustion chamber during the experiments. Capturing images from the top of the combustor was challenging because the hot exhaust gases exited the combustion chamber at high velocity. A digital single-lens reflex (DSLR) camera was used to record the flame images. The primary motivation for capturing these images was that the present study focuses on the flameless combustion mode, in which, besides low emissions, the flame should be non-luminous, and the combustor walls should remain visible. Therefore, the direct flame images serve as visual evidence supporting the reported point measurements at the can combustor centre and exit. Such top-view flame imaging of a can-type combustor is rarely reported in the literature, highlighting the novelty of the present work.
Figure 12 shows the direct flame images for different air-staging cases and thermal inputs at various equivalence ratios. The reported images were captured during stable operation of the can combustor. For both S20 and S30 air-staging cases, the flames were located further downstream of the burner under all tested conditions. At an equivalence ratio of
 $\phi$
= 0.5, the K20-S40 case exhibited a well-stabilised flame inside the combustor, which can be attributed to the increased availability of local oxygen and enhanced mixing caused by higher air mass flow rates. However, at
 $\phi$
= 0.6 and 0.7, the K20-S40 case showed the presence of a small flame tip outside the combustor exit. In contrast, the K30-S40 case at
 $\phi$
= 0.7 resulted in a well-established flame within the combustor, indicating that increased thermal input enhanced internal recirculation and promoted improved flame stabilisation. The S50 and S60 air-staging cases resulted in well-distributed flames under all operating conditions. At
 $\phi$
= 0.7, for both 20 kW and 30 kW thermal inputs with S50 air staging, a small flame core region was observed near the burner base. Conversely, at
 $\phi$
= 0.5 and 0.6, distributed flames with no visible flame core and clear visibility of the combustor walls were observed, which is characteristic of flameless combustion. The S60 air-staging case resulted in flameless combustion behaviour for all tested operating conditions in the present can combustor. These visual observations confirm the transition from conventional flame structures to distributed flameless combustion with increasing swirler air fraction and optimised air staging, which aligns with the reported results in the previous sections.
Figure 13 shows the direct flame images for the K20-S60 and K30-S60 cases over equivalence ratios ranging from
 $\phi$
= 0.5 to 1.1. The flames were stable and exhibited a flameless mode of operation for all tested equivalence ratios and thermal inputs. This demonstrates the effectiveness of the optimised air-staging strategy in achieving improved combustion performance while maintaining a flameless/distributed combustion regime. Moreover, no flame hot spots were observed at the combustor exit, which is beneficial for downstream gas turbine operation and component durability. The absence of localised luminous zones further confirms the uniform temperature field and suppressed thermoacoustic instabilities associated with distributed combustion.
Direct flame images for different equivalence ratios operating at 20 kW and 30 kW.

4.0 Conclusions
An experimental study was conducted to investigate the effect of air-staging on flameless combustion in a can-type combustor at thermal inputs of 20 kW and 30 kW over equivalence ratios of
 $\phi$
= 0.4–1.1. Based on these investigations following are observed:
-
• Increasing the swirler air fraction enhanced internal recirculation and mixing, leading to a transition from conventional flames to distributed flameless combustion.
-
• Optimised air-staging configurations (S50 and S60) achieved ultra-low emissions, with CO and NOx levels below 10 ppm for equivalence ratios up to
$\phi$
= 0.8 and minimum emissions of 3–4 ppm. -
• The flameless regime exhibited uniform central temperatures (variation ∼100 K), reduced acoustic emissions and stablised operation across thermal inputs. Comparable emission and temperature trends at 20 kW and 30 kW demonstrated the robustness of the selected air-staging strategy.
-
• Flame visualisation confirmed spatially distributed reaction zones with no flame hot spots at the combustor exit, indicating favourable conditions for downstream turbine operation.

Overall, these results demonstrate the potential of optimised air-staged flameless combustion for low-emission gas turbine and propulsion applications.




 ϕ




 ϕ


 Open access

