Introduction
A famous aphorism about bicameralism in the US Congress holds that the other party is merely the “opposition,” while the other chamber (in most renderings, the Senate) is the “enemy.” Although that sentiment seems outdated in contemporary American politics, it highlights the potential for conflict that arises in bicameral legislatures whose chambers are very different from one another. Yet, although 49 of the 50 states have bicameral legislatures, studies of state legislatures have often downplayed bicameralism as a subject of study per se.
Addressing this deficit requires a small pivot from a literature that has thoroughly catalogued the institutional traits of state legislatures and their constituent chambers. Some crucial institutional traits do not vary across chambers, either by definition or by empirical observation, including salary and session length (Squire Reference Squire2017), powers relative to the governor (Lewis, Schneider, and Jacoby Reference Lewis, Schneider and Jacoby2015), or the presence or nature of direct democracy (Bowler and Donovan Reference Bowler and Donovan2004). Many others, however, do vary across chambers, again including both self-apparent traits (e.g., term length and district size) and those empirically observed through scholarship, such as term limit stringency (Sarbaugh-Thompson Reference Sarbaugh-Thompson2010), majoritarianism (Squire and Hamm Reference Squire and Hamm2005), leadership powers (Mooney Reference Mooney2013), gatekeeping powers (Anzia and Jackman Reference Anzia and Jackman2013), and minority rights (Clark Reference Clark2015). Studying bicameralism, however, requires viewing these traits from a subtly different perspective: treating the differences across chambers within the legislature as the subject of interest.Footnote 1
In this spirit, state legislative bicameralism has received some attention as an independent variable. Although not speaking to institutional traits, studies of legislative productivity have examined how inter-chamber preference differences affect lawmaking: Rogers (Reference Rogers2005a) finds that divided legislatures feature decreased legislative productivity, whereas Hicks (Reference Hicks2015) finds no evidence that differences in chamber medians are associated with lawmaking efficiency. A more institutionally focused approach can be found in several strands of the literature that draw linkages between the relative size of the two chambers and a variety of outcomes. For example, Chen and Malhotra (Reference Chen and Malhotra2007) find that a large seat ratio is associated with less spending, while Rogers (Reference Rogers1998; Reference Rogers2005b) finds that larger ratios result in a greater share of adopted bills originating in the lower chamber.
We have not, however, answered a more basic question about state legislative bicameralism: what are the varieties of bicameralism that exist across states? Perhaps one reason for this inattention is that through the lens of the comparative literature on bicameralism, state legislatures seem, at least at first glance, quite homogeneous. First, all upper chambers have the power to defeat bills and no state systematically advantages the lower chamber (see, e.g., Llanos and Nolte Reference Llanos and Nolte2003 Footnote 2) in policy making. Upper and lower chambers, like the US House and Senate, are “equal partners” (Ryan Reference Ryan2018) in the legislative enterprise, and feature similar policy spaces and organizational complexity (Patterson and Mughan Reference Patterson and Mughan2001). Second, none of the upper chambers represent territories rather than population, a feature that is central to bicameralism in other countries (Russell Reference Russell2001) but is prohibited in the US states by the one person one vote standard. Third, none of the states use indirect elections or appointments to select upper chamber members, nor do any upper chambers incorporate social class or other exclusionary provisions into selection methods.Footnote 3 In the parlance of the comparative literature on bicameralism, then, state legislatures would all be said to be “symmetric” and “congruent.” Yet the implication—that state legislative bicameralism is invariant—is likely to strike state politics scholars as highly unconvincing.
In this article, I argue that there is another important dimension of bicameralism which does vary significantly among state legislatures: whether the second chamber serves as a distinct venue for policy influence or whether it reproduces patterns of influence found in the first chamber. This concept, which I refer to as “distinctiveness,” depends on both the seat ratio found in the legislature—a mostly stable institutional trait—and features of districting and party representation that fluctuate more across decades and elections.
This article proceeds as follows. First, I identify three traits of legislatures that exhibit variation in American legislatures and discuss how these traits can impact the nature of representation and policy influence. Second, I create measures of these three aspects of bicameralism, and use them to create an index of bicameralism in state legislatures. This measure reveals sizable variation across states and a conspicuous geographic pattern, with considerably greater bicameral distinctiveness in the Eastern United States. Finally, I evaluate the construct validity of this index, exploring the degree to which bicameral distinctiveness predicts patterns of bill amendment in upper chambers during the lawmaking process. I conclude by discussing future directions for the study of bicameralism.
Bicameralism in American State Legislatures
In the comparative literature on bicameralism, scholars identify two key dimensions of bicameralism: symmetry and congruence (Lijphart Reference Lijphart1999; Tsebelis Reference Tsebelis2002). Symmetric legislatures have two chambers with similar formal powers while asymmetric legislatures feature an imbalance of formal powers. Congruent legislatures have memberships chosen through similar processes, while incongruent legislatures select members of the second chamber on a different basis from the first chamber. For example, a second chamber may represent minority groups, geographic interests, or hereditary positions, and members may be selected through indirect elections or appointments rather than direct elections. Russell (Reference Russell2013) further argues that structures such as elitist institutions (e.g., the British House of Lords or the pre-1913 US Senate) demand attention to an additional dimension of bicameralism, “legitimacy.”
While the study of bicameralism has focused mainly on national legislatures, the central concepts used to characterize bicameralism can also be applied to subnational legislatures. By the above definitions, American state legislatures feature high levels of congruence and symmetry. Legislatures designed this way are sometimes labeled as “redundant” (Heller Reference Heller2007) or having a “superfluous” second chamber (Fisk Reference Fisk2011), although scholars acknowledge that redundancy can be desirable. Rogers (Reference Rogers2001), for example, offers an information rationale for redundancy, emphasizing that two similar groups can make different decisions. In a similar vein, Tsebelis and Money (Reference Tsebelis and Money1997) argue that “redundant evaluation” reduces legislative errors.
Some scholars have advocated for casting a wider net in terms of traits that distinguish between flavors of bicameralism. Llanos and Nolte (Reference Llanos and Nolte2003) identify several types of cross-chamber differences that do not undermine legitimacy: differences in chamber sizes, term lengths, term staggering, and differentiated districts and electoral formulas. I argue that a specific subset of these traits speaks to an important dimension of bicameralism: the degree to which its two chambers provide distinctive avenues for policy influence. This dimension, which I refer to simply as “distinctiveness” comprises three interrelated factors: the ratio of seats between chambers, the similarity of constituencies across chambers, and bipartisan representation (i.e., whether citizens enjoy representation from members of both parties).
As noted earlier, the seat ratio has received the most scholarly attention of these three traits, but the remaining two have also been the subject of several studies, especially on the subject of cross-chamber collaboration. For example, Chen (Reference Chen2010) finds that constituents obtain more pork when constituency similarity is high. Makse (Reference Makse, Moreno, Gamarra, Murphy and Jolly2020) finds that bipartisan representation is a disproportionately important source of cross-chamber collaboration. Kirkland and Williams (Reference Kirkland and Williams2014) touch on both, finding that legislators are more likely to collaborate across chambers when they share a party or have overlapping constituencies.
Before discussing how these traits form a coherent and novel dimension of bicameralism, it is worth noting that the three traits vary in their stability and their dependence on districting and election outcomes. Seat ratios are extremely stable in contemporary American politics (Squire and Moncrief Reference Squire and Moncrief2015); in the period of this study, New York added a state senate seat between the 2000s and 2010s, but all other states remained the same. Constituency dissimilarity is stable across years within a decade (unless mid-decade redistricting occurs), but can change across decades in response to patterns of population change and the actors in charge of redistricting. Bipartisan representation is the least stable, as it changes each election cycle (albeit within small ranges), and is dependent on the outcomes of specific electoral contests. This mix of traits means that distinctiveness is not a purely institutional measure, but this construction is not unprecedented in the study of bicameralism. In fact, one open question regarding the concept of congruence is whether partisan control of chambers should factor into conceptions or measures of congruence (see, e.g., Russell Reference Russell2013).
Chambers as Distinctive Venues for Policy Influence
For citizens or groups of citizens to have policy influence three requirements must be met (Tyson Reference Tyson2016).Footnote 4 First, citizens and groups must be able to elect candidates of their choice (“electoral influence”). Second, citizens and groups must be able to persuade their elected official to support their policy preferences and priorities (“constituent policy influence”). Third, the elected representative must hold enough sway within the institution to affect policy outcomes (“representative policy influence”).
In assessing how bicameralism shapes policy influence, each of these three requirements can be recast in terms of how the two chambers provide venues for policy influence in tandem. In each case, the legislature’s second chamber can (a) offer policy influence for the same groups who are influential in the first chamber or (b) provide policy influence for groups in different proportions as compared to the first chamber. Legislatures that tend toward the latter can be said to indicate greater bicameralism distinctiveness.
I argue that the three components of policy influence can be translated into the context of bicameralism as follows: First, a legislature exhibits high bicameral distinctiveness when many individuals whose electoral preferences are frustrated in the first chamber succeed in electing a candidate of choice in the second chamber. Second, a bicameral legislature is more distinctive when the influential groups in a citizen’s lower-chamber constituency are substantially different from those which are influential in her upper-chamber constituency. Third, a bicameral legislature is more distinctive when there are many citizens who enjoy little institutional voice in the first chamber but have meaningful voice in the second chamber.
While these quantities are difficult to measure directly, we can capture their essence by asking three questions that can be more straightforwardly measured. First, what is the ratio between the number of seats in the two chambers of the legislature? Second, how many citizens enjoy bipartisan representation, meaning that they have representatives from both major parties, in the legislature? Third, do citizens belong to lower- and upper-chamber constituencies that are meaningfully different in demographic and geographic terms? These three questions are not one-to-one substitutes for the three dimensions of policy influence, but the answers to each of these questions overlap in several ways with the three dimensions of influence described above.
Beginning with the first of these, the ratio of seats between the chambers can be connected to both the question of group representation and the question of voice within the legislature. A higher seat ratio implies two things, relative to a legislature with a similar lower chamber and a lower seat ratio: that upper-chamber constituencies are larger and that the upper chamber has a smaller membership (Crain Reference Crain1979). Larger constituencies tend to have a broader diversity of interests, an understanding dating back to Madison (Federalist 10), and legislators pursue broad agendas to be responsive to more diverse constituency interests (Francis and Kenny Reference Francis and Kenny1996; Madison Reference Madison, Carey and McClellan2001; Victor Reference Victor2011). As such, citizens whose group interests were given insufficient attention in the lower chamber are more likely to receive attention from the upper-chamber representative if the seat ratio is greater, and thus, the upper-chamber constituency is, in expectation, more dissimilar. The small membership of the upper chamber likewise has implications for institutional voice, insofar as smaller chambers provide more influence for each individual member. Thus, a citizen whose representative has little influence in the lower chamber should prefer, all else equal, a higher seat ratio such that their upper-chamber representative has more influence (in absolute terms, if not relative) in that institution.
Turning to the second trait, bipartisan representation, we can seek linkages with both the ability to elect a candidate of choice and the question of voice within the institution. The connection with electing a candidate of choice is straightforward: for citizens whose preferred party lost in the lower chamber, having bipartisan representation indicates that they succeeded in electing a candidate from their preferred party in the second chamber. The connection to influence within the legislature is more indirect, but flows from the empirical regularity that majority party legislators are more effective legislators (Padrói Miquel and Snyder Reference Padrói Miquel and Snyder2006; Volden and Wiseman Reference Volden and Wiseman2014). Except in the cases of a divided legislature,Footnote 5 having bipartisan representation also guarantees that a citizen will be represented by one member of the majority party (even if that legislator is not in the citizen’s preferred party).
Finally, the third trait, constituency dissimilarity, implicates both the influence of group interests and the ability to elect candidates of choice. In both cases, the intuition is similar: the groups one identifies with and demands representation through (Christenson, Lin, and Makse Reference Christenson, Lin and Makse2021) can represent either large or small parts of the constituency. The fact that the two constituencies are dissimilar does not guarantee that small groups in one constituency will be large groups in the other, but is certainly more likely than in the case where the two constituencies are similar. And although large groups are not guaranteed influence with the representative (Bishin Reference Bishin2009; Miler Reference Miler2018), representatives are electorally incentivized to be responsive to larger groups.
The linkage with electing candidates of choice requires slightly more elaboration. While the strength of partisan voting patterns is undeniably high in contemporary American politics, it is useful to recall that the “candidate of choice” legal standard speaks primarily to the preferences of citizens from different racial and ethnic groups,Footnote 6 not partisans. And although that legal standard does not specifically require electing a descriptively representative candidate, it does speak to situations where citizens from a group share cohesive preferences. When citizens live in a second-chamber constituency that does not largely mirror the first-chamber constituency, citizens from groups who could not elect a candidate of choice in the first chamber have, in expectation, a better chance of doing so in the second chamber.
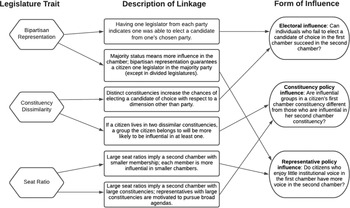
A summary of these linkages can be found in Figure 1. Although there is not a one-to-one linkage between the three aspects of influence and the three identified features of bicameralism, each trait maps onto multiple aspects of influence, and no single trait of bicameralism speaks to all three.
Summary of linkages between bicameral traits and influence concepts.

Measurement
Next, I describe the measurement of these three concepts (seat ratio, bipartisan representation, and constituency dissimilarity), using data from the last two redistricting cycles (2002–17). The seat ratio is measured once per state (except in New York, where it changed by one seat across decades), constituency dissimilarity is measured once per redistricting cycle, and bipartisan representation is measured once per election cycle.
Chamber Seat Ratio
Measuring the ratio of seats between the two chambers is the most straightforward of the three measures. My measure of the chamber seat ratio is simply the number of upper-chamber seats divided by the number of lower-chamber seats, yielding a ratio that ranges from 0.06 (New Hampshire) to 0.60 (New Mexico). Across the 49 bicameral state legislatures, there is substantial variance in the ratio between the number of lower- and upper-chamber members. Twenty-two states exhibit ratios close to 0.5 and 11 cluster near 0.33, with 8 falling in between. The remaining eight states have ratios of 0.25 or lower, of which New Hampshire is a clear outlier. For comparison’s sake, the chamber ratio in Congress is 0.23.
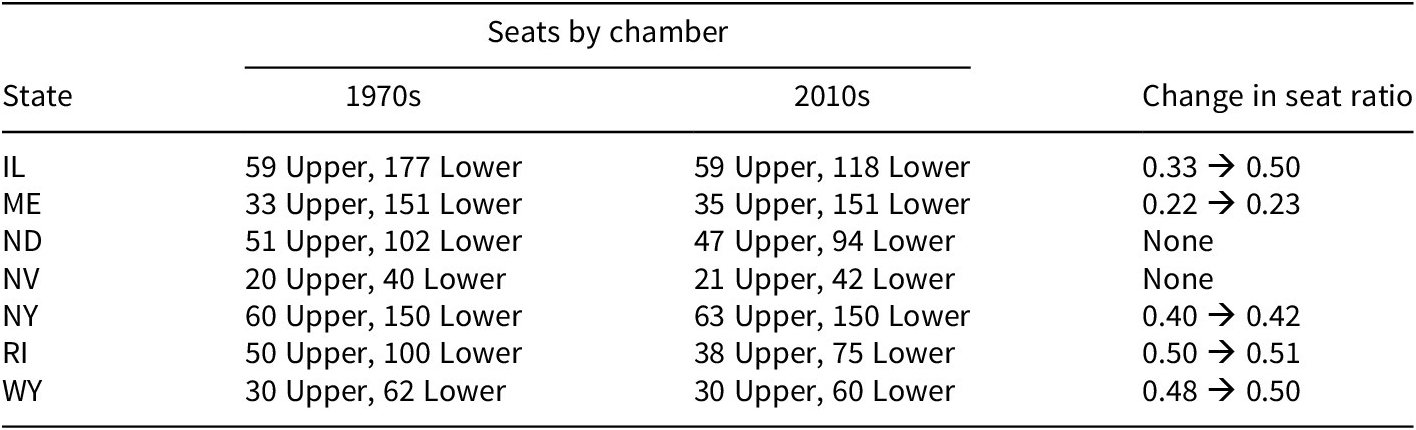
Very few states have changed the number of seats in the legislature since the 1970s,Footnote 7 and those which have (see Table 1) have typically done so without altering the seat ratio much. For example, New York has increased the size of its upper chamber by one seat per decade without changing the lower-chamber size, and Rhode Island downsized its legislature from 150 members (100 and 50) to 113 (75 and 38) with only a trivial change in the seat ratio. Even states which have changed their electoral systems in other ways (e.g., Georgia and North Carolina eliminating multimember districts) have done so without altering the seat ratio.

Bipartisan Representation
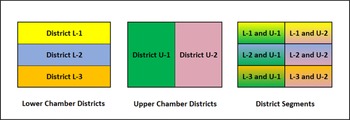
To measure bipartisan representation, I divide each state into “district segments,” where a segment comprises all parts of a lower-chamber district that are in the same upper-chamber district. I do this using the Geographic Correspondence Engine from the Missouri Census Data Center, which overlays two maps’ shapefiles and lists all geometric unions between them. An illustration of the creation of district segments is found in Figure 2.
Identifying district segments from lower- and upper-chamber districts.

After dividing an entire state into district segments, I determine the party affiliation of the lower- and upper-chamber representatives in each segment.Footnote 8 By determining the population of each district segment, I then calculate how many citizens have a representative in the upper chamber whose partisanship differs from their representative in the lower chamber. I assign a 0 if both chambers’ representatives are from the same party and a 1 if the upper chamber provides bipartisan representation that the lower chamber alone would not have provided.Footnote 9
In measuring bipartisan representation, the unit of analysis is the state-session; thus, except for states with unstaggered four-year terms in both chambers (Alabama, Louisiana, Maryland, and Mississippi), I observe a value every two years between 2002 and 2017 (except where mid-decade redistricting occurred; see Table A-1 in the Supplementary Appendix for a list of excluded sessions). Across all states, the mean is 0.20, meaning that 20% of the citizens enjoy bipartisan representation due to bicameralism. By and large, this quantity is stable across biennia within a state: the average standard deviation across years in a state is only 4.1% and in 35 states it is below 5%. The states with the least bipartisan representation are Arizona (1%) and New Jersey (5%), whereas Vermont (52%) and West Virginia (43%) have the highest. In Congress, 52% of citizens had at least one senator of a different party from their House member.Footnote 10
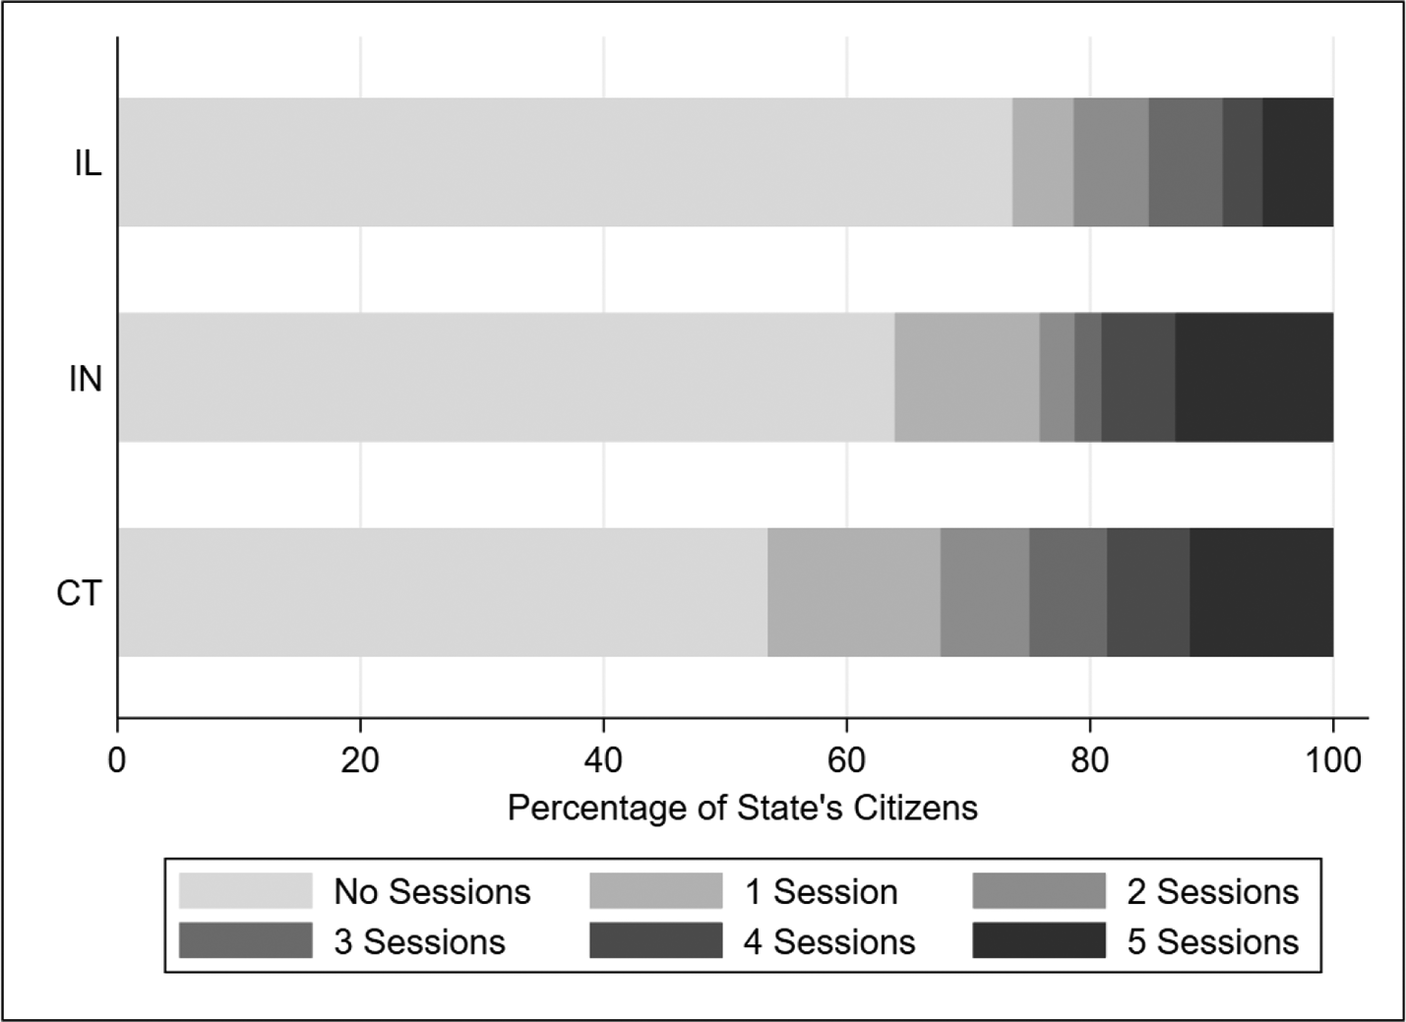
Figure 3 shows how the distribution of bipartisan representation varies in three states that represent the variety in bicameral distinctiveness.Footnote 11 In the five sessions from 2003 to 2012, a majority of citizens in all three states had lower- and upper-chamber representatives from the same party. In Illinois, however, more than three-quarters of residents never experienced bipartisan representation, whereas in Connecticut, nearly half of the state’s residents had bipartisan representation for at least one session while nearly 20% enjoyed it for four or five sessions. Indiana fell somewhere in between, comparable to Connecticut in terms of the number of citizens who frequently enjoyed bipartisan representation, but with a smaller number of persons who ever experienced it.
Frequency of bipartisan representation in selected states, 2003–12.

Constituency Similarity
I measure constituency dissimilarity by creating a measure that compares the lower- and upper-chamber constituencies for each district segment, using five-year averages of demographic traits from the American Community Survey for 2010 (for the 2000s districts) and 2017 (for the 2010s districts). Specifically, I examine eight demographic characteristics: median income, percentage of residents below the poverty line, percentage of African-American and Hispanic residents, percentage of residents with a bachelor’s degree, percentage of residents who are married, and the percentage of the district classified as urban. This set of traits is very similar to those used in other studies of constituency diversity (Aistrup Reference Aistrup2004; Koetzle Reference Koetzle1998).
For each demographic trait, I then calculate the standard deviation in that trait across all lower-chamber districts and create a z-score for the trait by dividing the difference between the lower- and upper-chamber constituencies by the standard deviation. Next, I take the absolute value of each z-score and average across all eight traits. This produces a measure of how different the lower- and upper-chamber constituencies are in each district segment. Finally, I take the population-weighted average of this quantity across all district segments in the state.
Since the unit of analysis for this measure is the state-decade, we have two observations per state. Although each decade’s constituencies are shaped by redistricting (sometimes drawn by different parties or actors in each decade), the correlation between a state’s score for the 2000s and its score for the 2010s is r = 0.97. Although values are unbounded at the high end, the maximum value observed is 0.70. The mean is 0.38, with a standard deviation of 0.16. The highest scores are in Vermont (0.68), Maine, and South Carolina (both 0.53), whereas the noncoterminous states with the lowest values are Maryland (0.18), Minnesota (0.25), and Illinois (0.26). States with coterminous districts for the upper and lower chambers, by definition, have a value of 0.00. Again, as a comparison, the score for Congress is 0.61, although given malapportionment and variation in state size, this is an imperfect comparison.
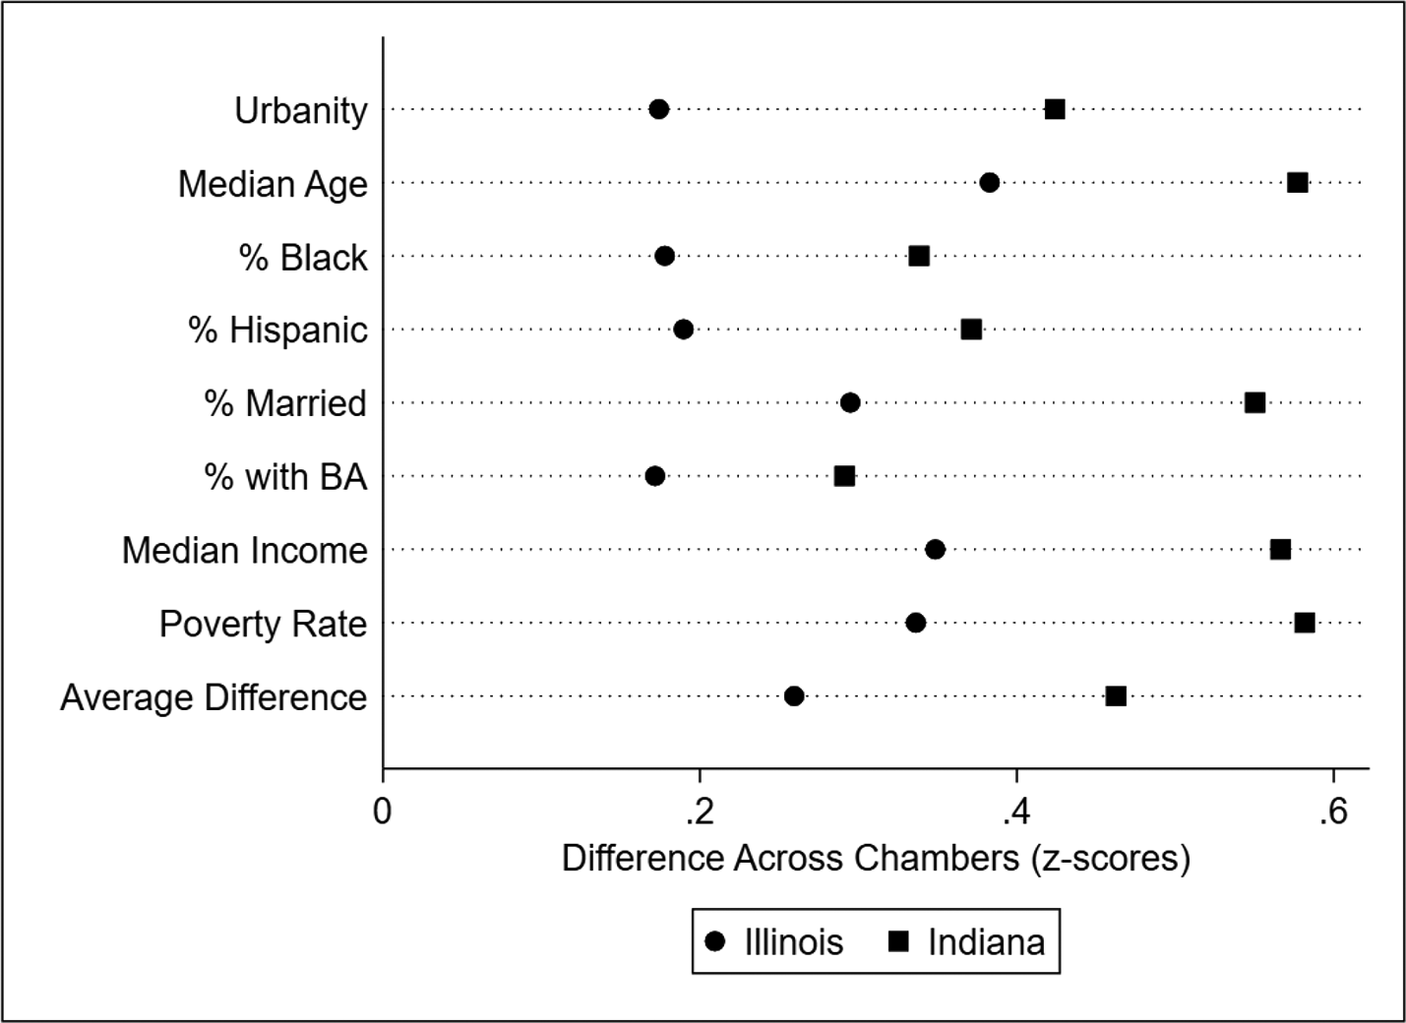
To illustrate what constituency dissimilarity looks like at each end of the spectrum, consider Illinois and Indiana, which despite being neighbors, are at opposite end of the spectrum in terms of constituency similarity. Illinois ranks ninth overall and second highest among states without coterminous districts (although it does have nested districts), while Indiana ranks 39th. Figure 4 illustrates how different, on average, a lower- and upper-chamber constituencies are in each state with respect to the eight demographic traits. In every case, Illinois’ lower- and upper-chamber districts are much more similar.
Constituency similarity in Illinois and Indiana.

The Index of Bicameralism Distinctiveness
To measure bicameral distinctiveness in a legislature, I next combine the three measures described previously. Since two of the measures are observed multiple times per state, I first calculate the mean value per state of each measure, and average the three measures. I also subtract the seat ratio from one, producing a measure where larger values indicate more distinctiveness, as is the case with the other two measures.
As Table 2 illustrates, there are strong correlations between the three index components, especially between bipartisan representation and constituency similarity. These correlations are similar in magnitude to those in Squire’s professionalism index, which in its first iteration had correlations of 0.62, 0.62, and 0.40 between its components (Squire Reference Squire1992, 77).
Correlations between measures of bicameral distinctiveness

Models of bill amending in second chamber

* p < 0.05.
** p < 0.01.
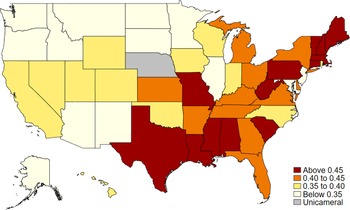
Next, I average the three measures to come up with a single measure of bicameralism, where larger values indicate greater bicameral distinctiveness. A map of the values can be seen in Figure 5, while a list of the numerical values for each state can be found in Table A-2 in the Supplementary Appendix. The legislature with the highest level of bicameral distinctiveness is Vermont (0.67), while Arizona scores the lowest (0.17). The scores are very consistent across the two decades: the correlation between a state’s score for the 2000s and the 2010s is r = 0.97.
Bicameral distinctiveness index scores, by state.

There is also a clear geographic pattern in the data: legislatures with the most distinctive chambers are found in the eastern half of the country, especially in New England and the Deep South. Undoubtedly, this is partially rooted in the historical development of legislatures (see, e.g., Squire and Hamm Reference Squire and Hamm2005), especially with respect to the seat ratio component. However, states east of the Mississippi also have greater bipartisan representation (23% vs. 17%) and constituency dissimilarity scores (0.42 vs. 0.33) than states west of the Mississippi.
Assessing Construct Validity: Second Chamber Amending of Bills
To assess the construct validity of this measure of bicameral distinctiveness, I consider whether bicameral distinctiveness sheds light on the way the two chambers interact in the lawmaking process. We know relatively little about second chamber consideration of bills in state legislatures. Much of the existing scholarship speaks to questions of the order in which the chambers consider bills (Rogers Reference Rogers1998) or the outcomes of conference committees (Gross Reference Gross1980), which themselves vary across states both in terms of use and practice (Squire and Hamm Reference Squire and Hamm2005). More recently, Jenkins (Reference Jenkins2016) notes significant variance across states in the percentage of bills passed by the first chamber which subsequently pass the second chamber.
While passage or nonpassage is one interesting source of variation in second chamber outcomes, the more relevant metric vis-à-vis bicameral distinctiveness may be whether the legislation passes the second chamber “as is” or is amended. While a full accounting of why individual bills are amended would require consideration of factors such as status quo positions, proposer preferences, and inter-chamber bargaining, analyzing the aggregate patterns in a legislature can give us a broad sense of the role the second chamber plays in the legislative process. This outcome is also politically consequential, as it determines whether conference committees (or other forms of inter-chamber bargaining) are necessary. After all, one of the purported benefits of bicameralism is that the second chamber can enhance the quality of bills and that benefit would seem to require that the second chamber be willing to amend problematic provisions in the first chamber’s legislation.
Legislatures, then, can be arrayed along a spectrum: those whose second chamber mostly pass the first chamber’s proposal unamended and those whose second chamber frequently amends the first chamber’s proposals. As I will show, there is enormous variance in this second chamber amendment rate across states, from states which amend very few bills to states which amend nearly all bills. I argue that this metric serves as a suitable outcome for testing the construct validity of my measure of bicameral distinctiveness. In legislatures with less distinctive chambers, deference to the first chamber may be natural because the second chamber might have produced a similar bill had it initiated the legislation. At the least, the first chamber may be less likely to include provisions the second chamber considers objectionable. At the opposite end of the spectrum, legislatures with more distinctive chambers may be more likely to be dissatisfied with the first chamber’s proposals. Even legislators who represent the same geographical areas can belong to different parties, prioritize different subconstituencies, or differently balance broad and particularistic concerns (Gamm and Kousser Reference Gamm and Kousser2010). Each of these dimensions creates potential motivations for legislators to propose amendments that make the bill more appealing to their colleagues. A valid measure of bicameral distinctiveness, then, should be positively associated with second chamber bill amendment rates.
To assess construct validity in this manner, I examine bills in 49 state legislatures (excluding purely symbolic legislation such as resolutions) during the 2013–14 through 2019–20 biennia (one year earlier for states with elections in odd years), narrowing the sample to bills that originated in the lower chamber and received floor consideration in the upper chamber. Using bill histories from Legiscan, I determine whether a bill passed the second chamber, and if so, whether any amendments were applied to the version originating from the first chamber.
The dependent variable in these analyses is the percentage of bills passed with one or more amendments in the second chamber divided by the total number of bills passed in the second chamber.Footnote 12 In the average state, 37% of bills are passed amended, whereas 63% are passed unamended. There is significant variance across state-sessions, however, with a standard deviation of 21%, and a range from 0% (Connecticut in 2019–20) to 97% (Hawai’i in 2017–18 and 2019–20). The raw correlation between the bicameral distinctiveness index and the second chamber bill amendment rate is r = 0.16 (r = 0.29 in the 46 states that do not have joint committees, a point I will return to shortly.)
To further assess this relationship in a multivariate model, I account for several other factors that we would expect to influence how a second chamber treats legislation originated in the first chamber. First, I include dummy variables for whether the legislative session featured divided government or a divided legislature. While few studies of state legislatures have considered second-chamber bill consideration, more general studies of legislative productivity have found evidence that one or both these conditions is an impediment to passing bills, although the relationship may be complex or conditional (Bowling and Ferguson Reference Bowling and Ferguson2001; Hicks Reference Hicks2015; Makse Reference Makse2017). We might likewise expect that these conditions would increase the percentage of bills that undergo amendments, as lawmakers strive to satisfy the demands of multiple veto players. Jenkins (Reference Jenkins2016), however, finds that amendments are less likely to pass under divided government, although her analysis occurs in the originating chamber, not the second chamber. As an alternative to the divided legislature variable, I also calculate a continuous measure of the ideological difference between the median voters in each chamber, as party control of each chamber may be a coarse measure of differences in preferences across chambers. This alternate specification can be found in the Supplementary Appendix (Table A-4).
I also control for several institutional factors that we might expect to influence whether bills are frequently amended in the second chamber. First, since, legislative professionalism gives legislators the resources—both time and staff—that may allow for the consideration of more amendments, I control for Squire’s (Reference Squire2017) professionalism index.Footnote 13 The level of centralization of power in the upper chamber (Clark Reference Clark2015) may be negatively associated with bill amendment, as leaders can either prevent bills from being amended or prevent bills that would require amendment from receiving floor consideration at all. In addition, legislatures which utilize joint committees (Connecticut, Massachusetts, and Maine), a feature that makes legislating more efficient and reduces the need for conference committees (Squire and Moncrief Reference Squire and Moncrief2015), may amend fewer bills, as bills passed through the first chamber will already have had input from members of the second chamber.Footnote 14
In addition, although not specifically speaking to amendments in the second chamber, Jenkins (Reference Jenkins2016) finds a positive association between term limits and the success of amendments, so I control for the presence or absence of term limits. Lastly, I control for state population and income, factors which have been shown to influence various aspects of lawmaking (e.g., Lewis, Schneider, and Jacoby Reference Lewis, Schneider and Jacoby2015). Descriptive statistics for all variables can be found in Table A-2.
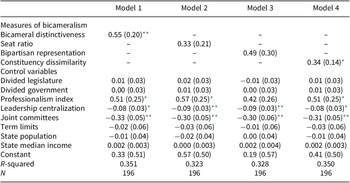
Since each state is observed for four sessions, we have 196 observations. Model 1 presents linear regression results with standard errors clustered by state. The model indicates that the effect of bicameral distinctiveness is statistically significant and substantively very large. Increasing distinctiveness from the 5th percentile (New Jersey; 0.183) to the 95th percentile (New Hampshire; 0.544) of states leads to a predicted increase of 20% in the percentage of bills that are passed with amendment.
Among the control variables, only three variables emerge as significant predictors of bill amendment rates. Highly professional legislatures amend, on average, a higher proportion of bills from the first chamber. The substantive effect of professionalism is also large: a change from the 5th to 95th percentile of professionalism is associated with a 21% increase in amended bills. Second, states with more centralized leadership powers in the second chamber are less likely to pass amended bills. States in the highest category of centralization amended 25% fewer bills than states in the lowest category. Third, states with joint committees have much lower rates of bill amendment; the presence of these committees are associated with a 33% lower bill amendment rate. The remaining control variables are never statistically significant predictors of bill amendment.
To further validate this index, I next consider whether patterns of bill amendment in the second chamber could be explained by any one of the three individual components of the distinctiveness index. In Models 2–4, I reproduce the results from Model 1, but consider the three components of the distinctiveness index one at a time in lieu of the index. Constituency dissimilarity is positively associated with the dependent variable, but the model fit when using only this component of the index is slightly inferior. The coefficients for the seat ratio and bipartisan representation variables are also in the expected positive direction but fall short of statistical significance. The bicameralism index provides the strongest model fit for explaining bill amendment in the second chamber. Moreover, it is not merely the case that the index is capturing the importance of just one of its three components; it is accounting for all three factors in combination that provides the strongest explanation. This substantial association between the index of bicameral distinctiveness and the way the two chambers interact during the lawmaking process is a strong indicator of the measure’s construct validity.Footnote 15
Discussion
In this article, I identify a novel dimension of bicameralism, distinctiveness, which draws on the concept of policy influence and captures meaningful variation across the 49 bicameral American state legislatures. The resulting index, which sorts legislatures according to whether their two chambers provide distinctive avenues for policy influence, complements the extant concepts of symmetry and congruence, neither of which varies across state legislatures.
By describing this systematic bicameral variation in state legislatures, we are in better position to understand possible linkages between the form of bicameralism and politics on the ground. For example, does media coverage of the state legislature treat the legislature more like a single actor, or does it treat the two chambers as two entities with distinct practices and personalities, in the manner that the national media treats Congress? In turn, does bicameralism distinctiveness shape whether the public can distinguish between the two chambers, in terms of approval or blame assignment for stalled or failed legislation? Moreover, insofar as bicameral distinctiveness is rooted in the idea of policy influence, does the behavior of interest groups differ across states, recognizing the need to influence two more dissimilar bodies in states with high bicameral distinctiveness?
Analyzing this dimension of bicameralism may contribute fruitfully to several strands of the state legislative politics literature. A fuller understanding of bicameralism can inspire reconsideration of many key findings regarding state policy making. Just as I found evidence connecting bicameral distinctiveness to amendment patterns in the lawmaking process, the nature of bicameralism may shape lawmaking in several other ways. For example, the study of policy innovation in the states may benefit from considering the nature of bicameralism. In legislatures with more distinctive chambers, innovations embraced in one chamber may be stifled in the second, slowing down or preventing the adoption of innovative policies.
The nature of bicameralism in a state also has implications for legislative networks and patterns of collaboration. Evidence of linkages between the components of the bicameral distinctiveness index and patterns of collaboration is already implied by Kirkland (Reference Kirkland2014), who finds a relationship between the size of chambers and patterns of collaboration among members, and Kirkland and Williams (Reference Kirkland and Williams2014), who find that constituency overlap between upper- and lower-chamber members predicts collaboration on legislation across chamber lines. Future work should continue to explore the interplay of chamber, party, geography, not only in structuring legislative networks, but also in determining their value in the legislative process.
Future surveys of state legislatures can provide insights into whether legislators have different understandings of bicameralism depending on the form of it they experience in their state. Carey et al. (Reference Carey, Niemi, Powell and Moncrief2002), for example, ask legislators about the influence of the other chamber in determining legislative outcomes. Mean responses to that question and the index developed in this article do exhibit some correlation, albeit a weak one (r = −0.19), hinting that legislators in less distinctive legislatures view the two chambers as more intertwined in the legislative process. Questions on future studies might gauge the extent to which legislators perceive the other chamber as partners, rivals, or even “enemies” (as per the aforementioned description of Congress), and whether those attitudes correspond to levels of bicameral distinctiveness.
Finally, these findings offer a reminder that institutional changes have sometimes less than obvious consequences. While changes to the size of legislative chambers have been relatively rare in recent decades, an increasing number of states have instituted or are considering substantial reforms to their redistricting processes. While most of the attention has been given to questions such as reducing partisan bias, promoting competition, and eliminating grotesquely shaped districts, newly designed redistricting commissions may also consider questions such as whether to design nested districts. Nested districts are associated, logically and empirically, with lower levels of bipartisan representation and constituency dissimilarity, and thus, lower bicameral distinctiveness. While such a decision might seem innocuous on its face and might be arrived at for reasons of convenience or esthetics, this article’s findings suggest that such decisions reshape how the two chambers provide representation in tandem, and thus, have serious consequences for the nature of bicameralism in a state.
Supplementary Materials
To view supplementary material for this article, please visit http://doi.org/10.1017/spq.2022.3.
Data Availability Statement
Replication materials are available on SPPQ Dataverse at https://doi.org/10.15139/S3/N2J4JQ (Makse Reference Makse2021).
Acknowledgments
The author thanks Clem Fatovic, Rob McGrath, Lynda Powell, Josh Ryan, and the anonymous reviewers for helpful feedback and assistance on this article.
Funding Statement
The author received no financial support for the research, authorship, and/or publication of this article.
Conflict of Interest
The author declared no potential conflicts of interest with respect to the research, authorship, and/or publication of this article.
Author Biography
Todd Makse is an associate professor in the Department of Politics and International Relations at Florida International University. His research interests include state politics, legislative politics, redistricting, and political behavior, and he is co-author of Politics on Display: Yard Signs and the Politicization of Social Spaces.