Implication
This study reveals moderate heritabilities for osteochondrosis (OC) scored using computed tomography (CT) in pigs. Moreover, the study found moderate unfavourable genetic correlations between rapid growth in early age and the sum of scores of osteochondrosis (OCT) assessed with CT. If a breeding programme focuses on increased growth in early age, the trait OCT could be implemented in the breeding goal to control the development of OCT or even reduce the incidence of OCT. Conversely, a breeding programme could also avoid the increase of OC by reducing the selection for rapid growth in the early life of a pig.
Introduction
According to Annual Statistics from the Norwegian pig industry, leg weakness/lameness is the second most important cause of the culling of sows (In-Gris Annual statistics 2011; Norsvin, 2012), which has also been reported in other countries with a significant pig production (Mote et al., Reference Mote, Mabry, Stalder and Rothschild2009; Segura-Correa et al., Reference Segura-Correa, Ek-Mex, Alzina-López and Segura-Correa2011). Several studies have concluded that osteochondrosis (OC) is an important cause of lameness in pigs (Reiland, Reference Reiland1978; Nakano et al., Reference Nakano, Brennan and Aherne1987). OC was first described by Thomasen (Reference Thomasen1939), and is a disturbance in the process of endochondral ossification, affecting individuals at early growth in several different species (Olsson and Reiland, Reference Olsson and Reiland1978). The disturbance is caused by ischaemia (Ytrehus et al., Reference Ytrehus, Haga, Mellum, Mathisen, Carlson, Ekman, Teige and Reinholt2004c; Olstad et al., Reference Olstad, Ytrehus, Ekman, Carlson and Dolvik2011). Necrosis of the epiphyseal growth cartilage is the first structural changes of OC, and can cause abnormalities of cartilage and thereafter bone lesions. The formation of detached fragments (OC dissecans), fissures or subchondral bone cysts can appear at predilection sites, which are specific to the species and joint in question (Olsson and Reiland, Reference Olsson and Reiland1978; Ytrehus et al., Reference Ytrehus, Carlson and Ekman2007). The condition has traditionally been assessed either by macroscopically scoring the cartilage or by means of sectioning the bone and scoring the slabs from slaughter pigs genetically linked to the breeding candidates (Grøndalen, Reference Grøndalen1974; Ytrehus et al., Reference Ytrehus, Haga, Mellum, Mathisen, Carlson, Ekman, Teige and Reinholt2004c; van Grevenhof et al., Reference van Grevenhof, Ott, Hazeleger, van Weeren, Bijma and Kemp2011). In the slabs, OC is characterized by irregularities of the interface between cartilage and underlying bone (Ytrehus et al., Reference Ytrehus, Haga, Mellum, Mathisen, Carlson, Ekman, Teige and Reinholt2004c). Empel and Sehested (Reference Empel and Sehested1986) used computed tomography (CT) to evaluate osteochondral lesions of pigs post-mortem, concluding that ‘For performance testing purposes, an in vivo diagnosis method is needed. To achieve this, some conformational changes on the CT equipment have to be made.’ The development of the helical CT in the 1990s helped to simplify rapid scans of entire animals (Goldman, Reference Goldman2007). In a study performed by Jørgensen et al. (Reference Jørgensen, Arnbjerg and Aaslyng1995), boars were examined using traditional radiographic examination (X-ray) and gross pathology, with the study demonstrating high correlations between OC scored using the two methods. In a later study, Jørgensen and Andersen (Reference Jørgensen and Andersen2000) radiographed 2042 live, anaesthetized boars and scored them for OC on six anatomical locations. The results from the study showed the highest prevalence of OC in femoral condyles (84% in Danish Landrace breed), and heritabilities of OC in the range from 0.16 to 0.39 were calculated for the different locations. In addition, a heritability of 0.38 for the trait ‘sum of all variables’ was found.
The aim of the study was to examine OC in pigs by use of CT and estimate genetic correlations between OC and growth in different weight intervals. To the best of our knowledge, current literature does not include such estimates.
Material and methods
Animals
The boars in this study were part of the Norsvin genetic programme, and were sampled in the period from April 2008 to January 2012. The pigs were purebred Landrace boars born and raised to ∼25 kg in 37 nucleus herds. All tested boars were part of the Norsvin Landrace breeding population, their genetic kinship varied, though they were all somewhat related. As part of the testing programme, boars were sent to a boar test station when reaching ∼25 kg, and upon entering the test station the boars were tagged with a radio frequency tag (RFID). Groups of 12 boars were selected from the breeding herds transported that particular day, and the boars were grouped so that the boars in a given pen were of as equal BW as possible. The RFID enabled daily weight and feed uptake recordings (FIRE; Osborne Industries Inv., Osborne, KS, USA), and the boars were fed ad libitum on conventional concentrate containing 161 and 136 g digestible protein and 9.68 and 9.50 MJ net energy/kg before and after 50 kg, respectively, with 1 month of mixing the two feeds to facilitate the feed change. Median weights are among the records stored in a database for each day/boar, and any medical treatment during the test period was recorded for the specific boar. Boars suffering from disease (e.g. lame) and not responding to medical treatment were euthanized and not CT scanned. When the boars reached ∼100 kg the test ended, and the boars were scanned using CT. Prior to CT scanning, the boars were sedated using Azaperone, 8 mg/kg live weight (Stresnil Vet®, Janssen-Cilag Ltd, Buckinghamshire, UK) administered intramuscularly. Boars were scanned ∼45 min after injection, as the sedation was given to help facilitate the scanning procedure and improve image quality. All animals were cared for according to the laws and regulations for keeping pigs in Norway (Regulation for the keeping of pigs in Norway 2003-02-18-175, 2003; Animal welfare Act 2009-06-19-97, 2009).
CT images from 1449 of the boars were classified for signs of OC based on the scale described later in this article. To improve the accuracy of the genetic parameters, the boars to be included in the CT study were sampled from a period of ∼4 years. To evade the estimations of a litter effect because of boars being raised in the same litter, the inclusion of full sibs was avoided, otherwise the sampling of boars was random. All of the CT-scanned boars had records for weight gain. To help ease the estimation of genetic parameters, records of weight gain of Landrace boars tested in the same time period were included in the dataset. In our study, animals with erroneous growth and feed intake records were removed from the dataset as described by Wetten et al. (Reference Wetten, Ødegård, Vangen and Meuwissen2012), which included filtering and restrictions on plausible records, for example, if the weight is plausible compared with the age of the animal. In addition, weights from both 5 days ahead and 5 days past are used to check if the weight is reasonable (within a range estimated with a general linear model). After the filtering for the growth-related traits, a total of 5228 boars were available for data analysis.
The pedigree file utilized in the analysis of genetic parameters included all animals with phenotypes and their ancestors >7 generations back, adding up to a total of 13 694 animals in the relationship matrix.
The technology behind CT and the scoring of OC
The technology utilizes the fact that body tissues vary in their ability to attenuate X-rays (Hounsfield, Reference Hounsfield1973). Images are constructed using a reconstruction of the X-ray attenuation profiles, consisting of pixels or voxels (pixel × slice thickness). The data matrixes from the CT images represent the X-ray attenuation of the tissue covered in the voxel. The X-ray attenuation value is presented as a CT number [Hounsfield unit (HU)], in which water has an attenuation value of 0, and air has a HU of −1000. Depending on the density of the bone, the HU value for bone typically ranges from 200 to 1000 HU. When studying the images, a threshold can be set in the software by defining the window level (WL) and window width (WW). When the computer receives an HU above or below the threshold defined by the WL and WW, a black (below) or white (above) density is outlined. The size of the voxel is determined by the resolution of the CT device (Hounsfield, Reference Hounsfield1976). The device used for scanning was a General Electric 32 slice VTC LightSpeed scanner, which is further described by Gjerlaug-Enger et al. (Reference Gjerlaug-Enger, Kongsro, Ødegård, Aass and Vangen2012). Images were compressed and stored on an image server that can be accessed for further image processing. The pixel size of the CT images was 0.93 mm2, whereas the slice thickness was 1.25 mm.
Signs of OC were interpreted as changes in the interface between the joint cartilage and the enchondral bone plate, which were seen as areas of increased radiolucency (Empel and Sehested, Reference Empel and Sehested1986), and are based on the CT images. The eight locations scored were the medial and lateral condyles at the distal end of the humerus and the femur of the right and left leg, and all evaluations were performed by one classifier during a period of ∼6 months (75 separate days). An evaluation of one animal typically takes between 3 and 5 min for a trained classifier, and the assessment was made based on the classification scores suggested by Ytrehus et al. (Reference Ytrehus, Haga, Mellum, Mathisen, Carlson, Ekman, Teige and Reinholt2004c). A score of zero was given to animals that showed no sign of lesion. A score of 1 and 2 was assigned when irregularities/dents were visible, with a score of 1 given to those that had a hint of a cavity, whereas a 2 was assigned to those having an obvious cavity in the bone. A score of 3 were assigned when a considerable lesion was discovered, particularly if a ‘flap’ was formed. When a score of 4 was assigned, a loose bone fragment was visible, while a score of 5, described as a loosening of cartilage/bone fragments over the majority of the bone surface, was not seen in the material. Supplementary Figure S1 shows typical images for lesions on the medial humerus for scores of 0 to 4 found in this study.
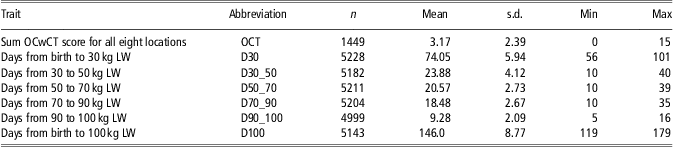
The assessor viewed the anatomical locations utilizing OsiriX software (Rosset et al., Reference Rosset, Spadola and Ratib2004). The orthogonal 2D Multiplanar reconstruction viewer was also utilized, which allowed the user to simultaneously view the animal in the axial, coronal and sagital locations in three viewing ports of the programme window, as shown in Supplementary Figure S2. To help facilitate the scoring, a WL of HU = 400 was set (Ohlerth and Scharf, Reference Ohlerth and Scharf2007). After initial testing, a WW of HU = 400 was chosen, which gave us the best contrast/detail level. Owing to the size of a voxel (3D pixel), the smallest lesion to be discovered was ∼1.16 mm3. After classification of the eight locations, a sum of the scores, OCT, was assigned to each of the boars. All analysed traits and corresponding abbreviations are listed in Table 1. For the weight intervals, the first day that the boar exceeded the lower threshold was counted as the first day of that specific interval.
Number of pigs per trait, mean, s.d., minimum and maximum values
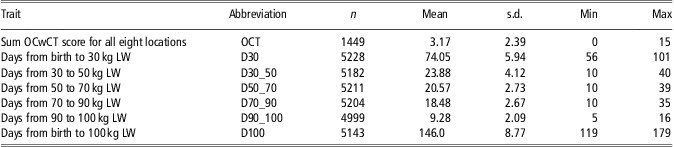
LW = live weight.
For osteochondrosis scored with computed tomography (OCwCT), the medial and lateral condyles at the distal end of the humerus or femur of the right and left leg were assessed. The interval D30 includes first few days of boar test.
The growth traits
Growth from birth to 100 kg were divided into five traits; days from birth to 30 kg (D30), days from 30 to 50 kg (D30_50), days from 50 to 70 kg (D50_70), days from 70 to 90 kg (D70_90), days from 90 to 100 kg (D90_100). The sum of the intervals – days from birth to 100 kg (D100) were also included in the dataset. For the weight intervals, the first day that the boar exceeded the lower threshold was counted as the first day of that specific interval.
Statistical analyses
An estimation of (co)variance components was performed using multivariate animal models, and analysed used restricted maximum likelihood methodology. The DMU 6.7 software package (Madsen and Jensen, Reference Madsen and Jensen2008) with the average information (AI) algorithm was used in the estimation. Asymptotic standard errors of (co)variance components were computed from the inverse AI matrix, and for all of the following models, animal genetic models were used.
The following model was fitted for all the OCwCT traits:
 $${ y = &\,\rm {herd\ and\ year\ of\ birth(HY)}\, \cr &+ \rm {date\ of\ OC\ assessment(OC\ date)} \cr & + \rm {parity\ of\ dam(parity) + pen\ in\ boar{\hbox-}} \rm {test\ station(pen)} \cr &+ \rm {live\ weight\ (kg)\ at\ CT{\hbox-}} \rm {scanning(LW)} \cr & + \rm {{(LW)}^2} + \,animal + error} $$
For OCwCT-related traits (HRM, HRL, HLM, HLL, FRM, FRL, FLM, FLL and OCT) the HY had 97 levels, the OC date had 75 levels and the parity had three levels: first, second and third or a higher parity. The effect of pen had 207 levels.
The following model was fitted for the trait D30:
 $${ D30 = & \rm {HY + parity + number\ of\ live {\hbox-}} born\ littermates\ \cr &\rm (littermates) + \rm {animal + error} $$
The effect HY had132 levels, whereas the parity of dam had three levels. The number of live-born littermates born was treated as a covariate.
The models for growth on test-related traits were:
 $$ {y = &\rm {HY + parity + pen + littermates} \cr &+ \rm {animal + error}{\rm{,}} $$
where the y's are D30_50, D50_70, D70_90, D90_100 and D100. The HY associated with each animal has 132 levels, parity has three levels and pen has 507 levels. The number of littermates was treated as a covariate.
The growth-related traits are linearly depended, that is, D30 + D30_50 + D50_70 + D70_90 + D90_100 = D100. Owing to this, D100 is not included in an analysis apart from the correlation to OCT. Co-linearity are also found between OCwCT traits where HRM + HRL + HLM + HLL + FRM +FRL + FLM + FLL = OCT. Because of the co-linearity, the analyses had to be divided to help facilitate the estimation of the genetic correlations of interest. Bivariate analyses were performed for the following traits: D30_50 and D70_90, D30_50 and D90_100, D50_70 and D70_90, D50_70 and D90_100 as were also the case for the traits OCT, HRM, HRL, HLM, HLL, FRM, FRL, FLM, FLL (e.g. OCT and HRM in one analysis, HRM and HRL in the next and so forth). The traits OCT, D30, D30_50, D50_70 were analysed as multitraits (one analysis), and the same was the case for OCT, D30, D70_90 and D90_100.
Results
The prevalence of OCwCT and OCT
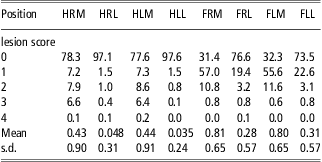
Supplementary Figure S3 presents a histoplot of the sum of the scores over the eight anatomical locations (OCT). The minimum score of OCT was zero, whereas the maximum was 15, and if an animal had scored a 5 on all eight locations the highest possible score would have been 40. In our material, <150 (10%) of the boars assessed for OCwCT were completely free of lesions when summing up over all locations (OCT equal to 0) (Supplementary Figure S3). Nonetheless, it is important to observe location level prevalence; very few of the animals had serious lesions, with the vast majority receiving a score of 1 and 2; only 0.1% to 0.2% scored a 4 (Table 2), and none scored a 5. The frequency of lesions were highest in the medial femur (FRM and FLM), in which ∼70% of the animals had changes associated with OC (Table 2). Tables 1 and 2 show descriptive statistics for the traits analysed.
Percentage, mean and s.d. of pigs appearing in each osteochondrosis lesion score category and anatomical location
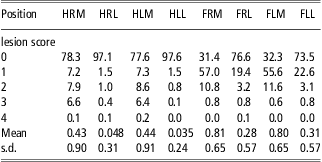
Anatomical abbreviations: First letter position: H = Humerus, F = Femur, second letter position: R = right, L = left. Third letter position: M = medial, L = lateral. For example, HRM = humerus right medial.
All scores are based on computed tomography. Number of pigs assessed is 1449.
Heritabilities and genetic correlations of OCwCT for the eight anatomical locations and for OCT
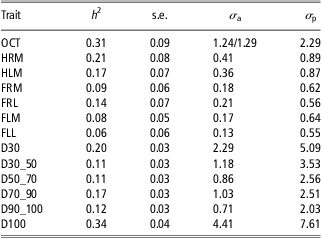
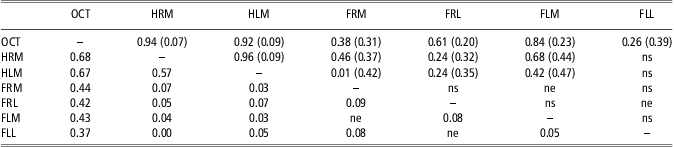
The heritability and variance components estimated in the analyses are presented in Table 3, with the heritability estimates originating from the bi- and multivariate analyses in DMU. When two or more estimates of the same trait heritability were available, the average heritability was calculated from the available estimates. Owing to very low frequencies (see Table 2), none of the analyses, including the traits HRL and HLL, reached the convergence criteria set in DMU, and hence the traits are excluded from further analysis. The estimated heritability for OCT was medium high (h 2 = 0.31, s.e. = 0.09). For the individual anatomical locations, the estimate for HRM was largest with an estimated heritability of 0.21 (s.e. 0.08), while the lowest heritability was estimated for FLL with an estimate of 0.06 (s.e. 0.06). Genetic correlations between OCT and OCwCT locations were generally high and positive (Table 4), whereas standard errors of estimates were moderate to high.
Estimates of heritabilities and variance components for the analysed traits
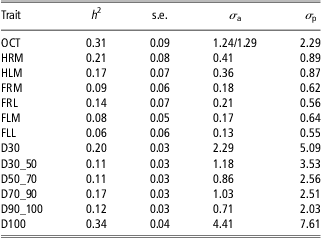
OCT = Sum OCwCT score for all eight locations, HRM = humerus right medial, HLM = humerus left medial, FRM = femur right medial, FRL = femur right lateral, FLM = femur left medial, FLL = femur left lateral, D30 = Days from birth to 30 kg LW, D30_50 = Days from 30 kg to 50 kg LW, D50_70 = Days from 50 kg to 70 kg LW, D70_90 = Days from 70 kg to 90 kg LW, D90_100 = Days from 90 kg to 100 kg LW, D100 = Days from birth to 100 kg LW.
Estimates of phenotypic – (below diagonal) and genetic (above diagonal) correlations
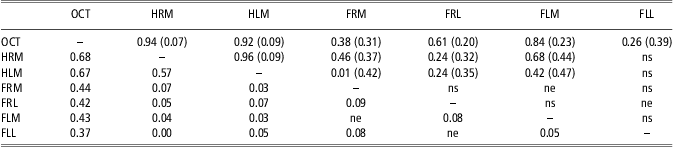
Anatomical abbreviations: First letter position: H = Humerus, F = Femur, second letter position: R = right, L = left. Third letter position: M = medial, L = lateral. For example, HRM = humerus right medial.
Standard errors of estimates in brackets. Not estimable correlations denoted ne. Genetic correlations with standard error exceeding 0.5 are denoted ns.
Heritabilities and correlations for growth-related traits
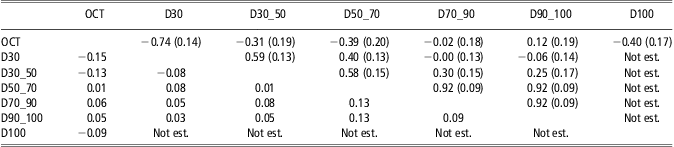
For the growth-related traits, the heritability for D30 and D100 was by far the largest, with heritabilities of 0.2 (s.e. = 0.03) and 0.34 (s.e. = 0.04), respectively. Estimates for the narrower weight intervals were lower, and phenotypic and genetic correlations are presented in Table 5. Genetic correlations between growth-related traits were very high for some traits (r g D70_90,D90_100 equals 0.92), but generally exhibited a decrease when traits are biologically further apart, and can even become negative (e.g. r g D30,D90_100 = −0.06). Standard errors were generally moderate to high, leaving the majority of estimates not significantly different from zero.
Estimates of phenotypic – (below diagonal) and genetic (above diagonal) correlations
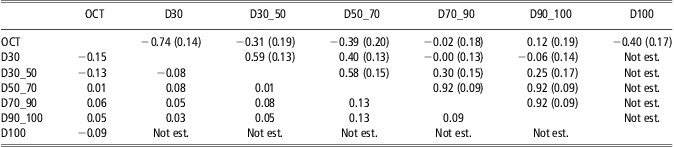
OCT = Sum OCwCT score for all eight, D30 = Days from birth to 30 kg LW, D30_50 = Days from 30 kg to 50 kg LW, D50_70 = Days from 50 kg to 70 kg LW, D70_90 = Days from 70 kg to 90 kg LW, D90_100 = Days from 90 kg to 100 kg LW, D100 = Days from birth to 100 kg LW.
Standard errors of estimates in brackets. Owing to multiple analyses, not all genetic correlations were estimated. These are denoted ‘Not est.’
Phenotypic and genetic correlation between OCT and growth-related traits
Our study suggest a high and unfavourable genetic relationship between early growth (D30) and OCT (r g OCT,D30 = −0.74, s.e. = 0.14), as presented in Table 5. This genetic relationship decreases as the boar ages and gain weight (r g OCT,D90_100 =0.12, s.e. = 0.19). Phenotypic correlations between OCT and growth traits generally revealed low correlations.
Discussion
This study suggests that OC can be scored by help of CT information. The traits are medium heritable and the genetic correlation between growth before 30 kg are substantial and unfavourable for breeding programmes selecting for increased growth.
Heritabilities of OCwCT for the eight anatomical locations
The heritability for OC at each of the eight anatomical locations varied, with the lowest being 0.06 at FLL to the highest being 0.21 at HRM. The fact that the analysis for HRL and HLL did not meet the convergence criteria set in DMU could be because of the low frequency of lesions on those locations (Table 2). A lesion score = 0 was assigned to a total of 1407 animals for position HRL and a lesion score = 0 was assigned to 1414 animals for position HLL. Most likely, this leaves too little of a phenotypic variance to estimate genetic parameters. Overall, the estimated heritabilities are lower than those reported for Danish Landrace by Jørgensen and Andersen (Reference Jørgensen and Andersen2000), but are in accordance with heritabilities published by Kadarmideen et al. (Reference Kadarmideen, Schwörer, Ilahi and Hofer2004). However, for both studies, the heritabilities presented are for the sum of the lateral and medial side of condyles, whereas our study presents heritabilities on a more detailed location level. In addition, for the heritabilities presented by Jørgensen and Andersen (Reference Jørgensen and Andersen2000), the estimates differ for the two breeds (Yorkshire and Landrace breed), thus indicating that there could be breed differences. In contrast, Yazdi et al. (Reference Yazdi, Lundeheim, Rydhmer, Ringmar-Cederberg and Johansson2000) found similar heritabilities (h 2 = 0.21) for OC in both their Yorkshire and Landrace breeds, and were also in the same range for both elbow and knee joints. In their study, OC were based on sectioning the elbow and knee joint in slabs and scoring them from 0 to 5 for signs of OC. Kadarmideen et al. (Reference Kadarmideen, Schwörer, Ilahi and Hofer2004) did not calculate heritabilities for each of his five lines in the material; instead they used a fixed effect in the model to correct for breed differences. Consequently, a direct comparison to their results is difficult.
Heritabilities for OCT and genetic correlations between the OCwCT traits and OCT
The fact that OCT displayed the highest heritability (Table 3) could be because of this trait showing the most phenotypic variance (since this is the sum of the other). A greater phenotypic variation does not automatically lead to a higher heritability, but if the increase in variation comes because of a more precise detection of OC, this could also lead to better estimates of additive genetic variance. When genetic correlations are as high as those presented in Table 4, at least three of the eight anatomical locations can be interpreted as being repeated measures of OCT, thereby leading to a higher heritability for OCT. Moreover, compared with scores of the individual eight locations, OCT fits more into a normal distribution than the other OCwCT traits do. Normal distribution would be an advantage since linear models assumes that data are normal distributed. Other studies have investigated the usage of statistical models with an ability to account for other distributions of phenotypes than those normally distributed (Kadarmideen et al., Reference Kadarmideen, Schwörer, Ilahi and Hofer2004; Ødegård et al. Reference Ødegård, Olesen, Gjerde and Klemetsdal2007). Although these methods could be feasible for detecting additive genetic variance, implementation in an operative breeding programme might not be feasible. In addition, a Log-transformation of phenotypes was performed, but this did not help to yield better estimates.
Genetic relationships between lesion scores at the anatomical locations seem to vary, which is also found by Kadarmideen et al. (Reference Kadarmideen, Schwörer, Ilahi and Hofer2004) and Jørgensen and Andersen (Reference Jørgensen and Andersen2000). The estimates also have large standard errors; some of them may be because of low frequencies and a lack of normality in the data. In addition, the low number of observations would also contribute to high standard errors. Nevertheless, the study reveals medium-to-high favourable genetic correlations (r g = 0.26 to r g = 0.94) between individual anatomical locations and OCT. Consequently, a selection for reduced OCT would, in a breeding goal, be most effective because the higher heritability of OCT compared with any of the others, in addition to OCT being medium-to-high favourable correlated to the other traits. This is not the case for OCwCT at all of the other anatomical locations.
Information from CT as a diagnostic tool for OC
The method this study used, OC diagnostics based on CT images, is a newly developed tool, and we wanted to be sure that the diagnosis was not results from changes in the growth cartilage other than OC. Therefore, another investigation had been performed, in which 19 pigs were scanned over time and slaughtered in the end and examined both macroscopically (coronal slabs) and histologically. When examining the femur condyle, we found that 98% (medial) of the changes seen macroscopically were detected with the help of CT, while 100% of the lateral lesions of femur were detected (unpublished data).
Relationship between OCT and growth in different weight intervals
In the present study, a boar is not CT-scanned if it does not stand and walk on all four legs; still, we found sizeably large lesions. Yazdi et al. (Reference Yazdi, Lundeheim, Rydhmer, Ringmar-Cederberg and Johansson2000) state that ‘OC itself is probably clinically silent until it has developed into OC dissecans or has caused bone deformation or epiphysiolysis.’ Further studies are needed to investigate the relationship between lameness and OC.
In our study, there are high, unfavourable genetic correlations between OCT and early growth (D30), meaning that a rapid growth (less days spent growing up to 30 kg) corresponds to a higher incidence of OC. In contrast, Kadarmideen et al. (Reference Kadarmideen, Schwörer, Ilahi and Hofer2004) did not find any significant genetic relationship between OC and daily weight gain (average gain from 30 to 103 kg), while Jørgensen and Andersen (Reference Jørgensen and Andersen2000) found low unfavourable correlations between daily gain and sum OC scores in their study. The study of Busch and Wachmann (Reference Busch and Wachmann2011), in which the authors found an increased risk of OC in the elbow joint when an animal had a high average daily gain during the weaning period supports both our finding and those of Jørgensen and Andersen (Reference Jørgensen and Andersen2000). Van Grevenhof et al. (Reference van Grevenhof, Ott, Hazeleger, van Weeren, Bijma and Kemp2011) also found a higher risk of OC in the joints of pigs growing fast, but this was after day 42. Both the studies of Busch and Wachmann (Reference Busch and Wachmann2011) and van Grevenhof et al. (Reference van Grevenhof, Ott, Hazeleger, van Weeren, Bijma and Kemp2011) focussed on the phenotypic relationship between OC and average daily gain. Our results suggest that the genetic correlations between OCT and growth intervals decline towards the end of the test period and even seem to change to a favourable correlation at the end (D90_100). This could be because of the fact that animals that are growing more rapidly at an early age put more of a weight load on an immature bone structure, hence developing lesions. This is also supported by the findings of Weiler et al. (Reference Weiler, Salloum and Claus2006) and van Grevenhof et al. (Reference van Grevenhof, Ott, Hazeleger, van Weeren, Bijma and Kemp2011). Nakano et al. (Reference Nakano, Brennan and Aherne1987) are among those discussing if rapid growth rate/increased muscle mass may result in increased mechanical overloading of an immature skeleton. Since OC is a disease developing from the growth cartilage and the blood supply to the growth cartilage only is present though early phase of growth, the disease can only be initiated during this phase (Ytrehus et al., Reference Ytrehus, Carlson, Lundheim, Mathisen, Reinholt, Teige and Ekman2004b). Therefore, there is a finite age/weight threshold beyond which the blood supply has regressed completely from the growth cartilage and lesions can no longer be initiated. This is the reason why OC and growth rate only can be related until a certain age/weight. According to Ytrehus et al. (Reference Ytrehus, Grindflek, Teige, Stubsjøen, Grøndalen, Carlson and Ekman2004a) the growth cartilage of femur sustains a near total loss of vascular supply between the age of 56 and 105 days. In our study, this coincides with boar reaching 30 kg at an average age of 74 days, with a minimum of 56 days and a maximum of 101 days. Increased weight load on a thick and vulnerable growth cartilage and the formations of OC lesions could be the result of a rapid growth in early age.
Conclusion
The results in this study indicate that breeding programmes selected for rapid growth at a young age should include OCT as a trait for selection. Given that OC is a major cause of lameness, a selection against OCT in a breeding goal could reduce the incidence of the culling of sows and consequently such trait is particularly important in maternal lines where longevity of sows is essential. In addition, if the trait OCT was implemented in the breeding goal of a terminal line, a decrease of OCT would potentially reduce the incidence of finishing pigs developing lameness.
Acknowledgements
This study is a part of a project funded by the Research Council of Norway and Norsvin (Norwegian Pig Breeders Association).