Implications
Improvement of economically important traits by artificial selection requires knowledge of their genetic parameters. This paper investigates such parameters in a collection of economically important meat quality traits. It is hoped that the results discussed here will assist in the design of successful breeding programmes, possibly via marker-assisted selection, which, in turn, will result in an increase in meat quality.
Introduction
Beef production is the largest single sector of the Scottish agricultural economy, contributing 23% of the total agricultural output in 2007 (QMS, 2007). The most important factor in a consumer’s enjoyment of meat is palatability, primarily influenced by the sensory traits, tenderness and juiciness (Tarrant, Reference Tarrant1998). Thus, meat quality is of great interest to cattle breeders as an improvement in trait quality and consistency may lead to an increase in the consumption of beef.
Genetic parameters for meat quality traits provide a basis for designing effective breeding programmes; however, few well-defined parameters exist for such traits measured in commercial beef cattle. Estimation of these parameters requires reliable trait measurement, but sensory traits are inherently difficult to measure. Although mechanical and chemical measurements exist for some sensory-related traits, evaluating the human response to eating meat primarily relies on subjective human assessment as currently there are no objective means of measuring the full range of interacting characteristics contributing to eating quality (Warriss, Reference Warriss2000). Panels of human assessors are subject to variability, both within- and between-individuals. They are also prone to bias due to order-presentation or peer influence (O’Mahony, Reference O’Mahony1988). These effects may also influence the accuracy of estimated genetic parameters. However, it is possible to evaluate the quality of data gathered by such panels using consistency statistics such as repeatability and reproducibility, which indicate the ability of a panel of assessors to score traits accurately and consistently.
The present study is focused on the commercial animals from the Aberdeen Angus (AA) breed, which is widely perceived to produce high-quality meat with desirable tenderness and marbling characteristics. Whilst using commercial animals may limit observed variation in meat quality, it is important to note that trait improvement in the population studied is economically relevant. The study had three objectives: (i) to assess the quality of taste panel assessment of sensory beef quality traits, (ii) to estimate genetic parameters for these sensory meat quality traits and (iii) to estimate correlations between carcass and meat quality traits.
Material and methods
Sample collection
Commercial crossbred beef cattle (n = 443 animals) with purebred AA sires were sourced through the Scotbeef abattoir (Bridge of Allan, Scotland). Cattle originated from 14 breeder–finisher farms (i.e. farms where animals are bred and finished on the same farm) and were selected to be representative of British commercial cattle slaughtered for beef production, being a mix of heifers and bullocks of varying ages (between 408 and 912 days old at kill, with age differences being largely a function of farm).
Cattle were stunned by captive bolt before being slaughtered by exsanguination and dressed using standard commercial specifications. During exsanguination, 100 ml blood was collected and frozen for later DNA extraction. The final taste panel session was 38 months after the first animal was slaughtered.
Carcass trait measurement
At slaughter, hot carcass weight was recorded and carcasses were graded by a Meat Hygiene Service assessor for muscle composition and carcass fatness according to the standard European Union beef carcass classification scale (EUROP) (Hickey et al., Reference Hickey, Keane, Kenny, Cromie and Veerkamp2007). Conformation and fat class scores were transformed into a 7-point numerical scale (Kempster et al., Reference Kempster, Cook and Grantley-Smith1986). Twenty-four hours after slaughter, pH and temperature were recorded in the sirloin muscle with the TESTO 205 pH meter (TESTO, Hampshire, UK) and the ETI FPT thermometer (ETI Ltd, Worthing, UK), respectively.
At deboning, weight of the hindquarter and striploin were recorded and used to calculate meat yield as a percentage of hot carcass weight. Sirloins were vacuum-packed and stored below 4°C for 21 to 30 days to mature, then removed from the vacuum pack, patted dry to remove excess moisture and weighed. Three steaks were cut from the centre of the sirloin as follows: for tenderometer testing, 3 to 4 cm thick; for sirloin measurements, 1 to 2 cm thick; and for sensory testing, 2 cm thick.
For tenderometer testing, steaks were trimmed to 200 to 220 g of eye muscle and placed in a water bath at 100°C until the centre of the sample reached 82°C. Samples were left to cool until they reached 7°C, then weighed and tested using a MIRINZ Tenderometer machine (AgResearch, Hamilton, New Zealand). The cook loss trait was measured as the difference in weight before and after cooking in the water bath.
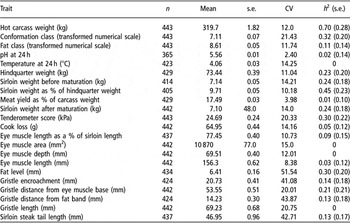
A full list of analysed traits can be seen in Table 1.
General descriptive statistics, heritabilities and standard errors for carcass traits

Taste panel selection and assessments
Taste panel members were chosen among workers at the Scotbeef meat processing plant in East Kilbride, Scotland. Members of staff (n = 38) were tested using the Triangle and Matching tests (BSI-BS7667, 1993). Those who scored less than 50% in the two tests were discarded (10 people). Taste panels comprised six members and an average of nine samples were tested per sitting with the addition of one randomly chosen blind repeat steak per panel. Participants were instructed to rinse their mouths with water before tasting began as well as between samples. They were also instructed not to eat or drink for 1 h prior to the test.
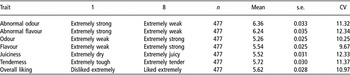
Prior to assessment, sirloin steaks were cooked using a Lincat Lynx 400 electric griddle (Lincat Ltd, Lincoln, UK) until a thermometer placed in the centre of the steak reached 74°C. The six panellists then scored the steaks on a 1 to 8 scale for abnormal odour, abnormal flavour, steak odour, steak flavour, juiciness, tenderness and overall liking (8 = extremely weak, extremely weak, extremely strong, extremely strong, extremely juicy, extremely tender, like extremely; 1 = extremely strong, extremely strong, extremely weak, extremely weak, extremely dry, extremely tough, dislike extremely for these characteristics, respectively). In total, there were 49 taste panel sittings and during each sitting the order of steak presentation was different for each panellist. Taste panel members participated in between one and 37 panels with an average of eight sittings per panellist.
Data analysis
Taste panel consistency statistics
Three consistency statistics were defined: (i) repeatability, i.e. how similar the scores were for an individual panel member scoring the same trait on repeated samples from the same animal; (ii) reproducibility, i.e. the extent to which taste panel members agreed with each other when scoring a trait; and (iii) panel-member consistency, i.e. the extent to which an individual panel member varied in their scoring over the period of the experiment.
The statistics and their standard errors were estimated using ASReml (Gilmour et al., Reference Gilmour, Cullis, Welham and Thompson2000), using the individual taste-panel member scores rather than the animal average. The fixed model for each statistic consisted of panel date. For repeatability and reproducibility, the random model included animal ID and the panel-date × panel-member interaction. The random model for panel-member consistency included panel member, animal ID and the panel-date × panel-member interaction.
Individual statistics were calculated as follows:
(i) Repeatability = Panel-member × panel-date variance/(panel-member × panel-date variance + residual variance).
(ii) Reproducibility = (Residual variance + animal variance)/(residual variance + animal variance + panel-member × panel-date variance).
(iii) Panel-member consistency = Panel-member variance/(panel-member variance + panel-member × panel-date variance).
Paternity determination
Due to the possibility of multiple sire mating and discrepancies between the recorded and the true sire, paternity was determined using genetic markers. Details are described in full in Appendix 1. Briefly, genotypes were obtained for each sample for a panel of 15 unlinked microsatellite markers. Genotypes for each offspring and all possible sires were analysed with the program Cervus (Marshall et al., Reference Marshall, Slate, Kruuk and Pemberton1998) that assigns paternity using a likelihood method. There were 69 offspring whose sires could not be determined; therefore, the sire was set to ‘unknown’ in the pedigree, although the phenotypes of these samples were retained in the analyses.
Genetic parameter estimation
Heritabilities were calculated using ASReml (Gilmour et al., Reference Gilmour, Cullis, Welham and Thompson2000). Fixed effects for heritability analysis included farm (14 levels), sex, percentage of AA genetic background (based on dam breed – each animal was assigned one of three levels: 100% (if the dam was AA), 75% (if the dam was AA-cross) or 50% (if the dam was neither) and finally, either slaughter date (45 levels) or taste panel date (49 levels) for carcass trait analysis and sensory data analysis, respectively. The random effect of an animal was also included in the model, fitting all assigned pedigree relationships. For the taste panel traits, the average score for each animal was analysed.
From the initial analysis, it was apparent that the dataset was too small for a robust estimation of genetic correlations. Therefore, only residual correlations between traits were estimated. These were calculated between each trait pair after fitting farm and sex in the fixed model as well as farm, sire, date and sex interactions in the random model. Therefore, the residual (co)variances comprise the environmental (co)variance plus three-quarters of the genetic (co)variance, and hence are close to phenotypic (co)variances.
Results
Taste panel descriptive statistics
A total of 443 animals were assessed by taste panel, although 34 repeat steaks were included to assess the consistency of the data, resulting in 477 taste panel results (Table 2). Abnormal flavour and odour traits had the highest mean scores of the taste panel traits, where high values indicate favourable scores. This is reflected in the distributions of these two traits which are negatively skewed compared to the fairly symmetric distributions of the six other taste panel traits (data not shown).
Descriptive statistics for the sensory traits as measured by the taste panel

Taste panel consistency statistics
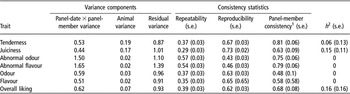
Repeatability values, which measured the similarity of scores from the same panellist for two steaks from the same animal, were moderate (Table 3). The abnormal flavour and odour traits had the highest repeatability values, indicating that these are the traits that individual panel members scored most similarly for the two steaks, whilst juiciness had the lowest repeatability.
Variance components, repeatability, reproducibility, panel-member consistency statistics and heritability and standard error estimates for taste panel-assessed traits

1Panel-member consistency was calculated using the panel member variance component not shown here.
Reproducibility values give an indication of the extent to which panel members agreed in the scoring of a trait. Abnormal odour and flavour had the lowest values for this statistic whilst juiciness and tenderness had the highest, in contrast to the repeatability statistic. In other words, there was more discrepancy among panel members for the abnormal flavour and odour traits and greater agreement for juiciness and tenderness.
The consistency of each panel member measured the scoring trend of individual panellists over the course of the experiment (several months). Values were moderately high for all traits, with odour having the lowest and tenderness the highest consistency overall. In general, all panel members were fairly consistent over time in the scores they assigned for the sensory meat quality attributes.
Taste panel heritabilities
Overall, the heritabilities for taste panel-assessed sensory traits were low (Table 3). Overall liking had the highest estimated heritability, with the normal and abnormal flavour and odour traits having estimates of zero. Generally, the standard errors were large in comparison with the heritability estimates, reflecting the relatively small dataset and the limited information on relationships other than offspring–sire.
Heritabilities were also estimated allowing for differing stringencies of paternity assignment to incorporate as many individuals as possible in the analyses. Allowing zero, one, two or three mismatches, the analyses included 344, 372, 388 or 416 sire–offspring pairs respectively. Although individual heritabilities altered, there was no discernable pattern of change in the heritability estimates as the stringency was relaxed (data not shown).
Residual correlations between traits
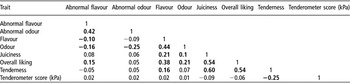
Significant positive correlations (P < 0.05) exist between many of the meat quality traits (Table 4), most of which are expected. For example, abnormal flavour and odour were highly correlated, suggesting that the two traits are strongly associated. Juiciness, tenderness and overall liking were also highly correlated. Average tenderometer score values were significantly negatively correlated with taste panel tenderness (Table 4), i.e. in the expected direction, but the correlation coefficient itself was only moderate.
Taste panel residual correlations

Figures in bold are significantly different from zero (P < 0.05).
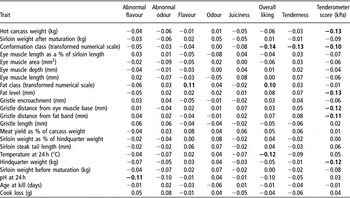
There were a limited number of significant correlations between the meat quality traits and the carcass quality measurements (Table 5). Out of 168 trait comparisons only 12 correlations were significantly different from zero, and these correlations were all weak, indicating that there are limited relationships between the carcass and meat quality traits. Hot carcass weight, conformation class, fat level and two of the gristle measurements were significantly negatively correlated with tenderometer score.
Residual correlations between taste panel-assessed traits and carcass traits

Figures in bold are significantly different from zero (P < 0.05).
There were also significant correlations between various weight-related traits (data not shown), e.g. hot carcass weight and sirloin weight were strongly correlated (r = 0.65). The sirloin steak measurements were also significantly positively correlated with each other, e.g. eye muscle area with eye muscle length (r = 0.53). These correlations are not surprising as an increase in sirloin weight tends to be associated with an increase in overall body weight. Similarly, an increase in eye muscle length results in an increase in eye muscle area.
Carcass trait statistics
Carcass quality data were recorded for a total of 443 animals for most traits (Table 1). The smallest dataset was for pH after 24 h where data were only available for 365 animals. There was considerable variation in fat- and gristle-related traits. Fat level had the highest relative variation whilst pH at 24 h had the lowest value of coefficient of variation.
Heritability values for carcass traits tended to be higher than those of the taste panel traits (Table 1). Hot carcass weight had the highest value whilst eye muscle area, eye muscle depth, gristle length and temperature at 24 h had zero heritability. Again, many of the standard errors were large in comparison with the heritability estimates.
Discussion
Calculating repeatability, reproducibility and panel-member consistency statistics has allowed us to evaluate the quality of the sensory data collected in this study. Based on panel-member consistency values, it appears that the subjective scoring of the panel members tended to vary little over time thus giving us confidence in pooling data derived at different times during the study.
Repeatability measurements, assessed by comparisons of two steaks from the same carcass, were generally moderately high. The highest values, for abnormal odour and flavour (0.57 and 0.54 respectively), indicate that these traits are the most consistently scored measurements by individual taste panel members. However, they could also be a reflection of the slightly skewed distribution due to low abnormal flavour and odour scoring, reflecting that few steaks were scored in the highly abnormal range. Thus, the high repeatability values may be due to the perhaps more qualitatively obvious abnormal odour and flavour traits; but, as described below, agreement between panellists was also lowest for these two traits. Repeatability of tenderness measurements, known to be the most important predictor of meat palatability, was 0.37, somewhat lower than the previous estimates of 0.6 in beef (Shackelford et al., Reference Shackelford, Wheeler and Koohmaraie1997) and 0.53 in pork (Hovenier et al., Reference Hovenier, Kanis and Verhoeven1993). The discrepancies between the value measured here and those from previous studies may lie in differences between the cooking method, species or breed of cattle. For example, there may be less variation in our study population than in the experimental cross involving multiple breeds studied by Shackelford (1997) – an increase in variation may enable panellists to more accurately assess samples, resulting in higher repeatability values. Additionally, differences in experimental procedure may be responsible for the differences observed. In the present study, two steaks from one animal were used whilst previous reports have utilised different samples from the same steak. With the latter approach, the scores should vary less than with samples from separate steaks and hence it should result in higher repeatability values. It should be noted that the repeatability and heritability values cannot be directly compared, as the repeatabilities were estimated on individual taste panel assessor values whereas heritabilities were estimated using mean taste panel values.
Reproducibility, the comparison of between-panellist variation and total variation, gives an assessment of panel-member agreement. The values for reproducibility were moderately high, particularly so for juiciness and tenderness (0.73 and 0.67 respectively). This indicates that the panellists tended to agree regarding the scoring of these traits, with the result that much of the variation in scoring can be attributed to between-animal differences or residual variance. The relatively high reproducibility scores for these traits suggest that they will be least affected by changes in taste panel membership, and hence the taste panel assessment is possibly more likely to be representative of the responses of consumers as a whole. In contrast, the abnormal odour and flavour traits had the lowest reproducibility values, indicating that variation in these traits is due, to a greater extent, to the differences between panellists and their perceptions of abnormal flavour and odour, rather than objective differences between samples.
In general, the heritability estimates for the taste panel traits were low and several converged to zero. Experimental noise and a small sample size may have contributed to this result through increased residual variance. However, in addition to these factors, low heritabilities also reflect the limited true variation among the animals used in the study, evidenced by the low between-animal variance components from the consistency statistic analyses (Table 3). Traits for which there were greater heritability values, i.e. tenderness, juiciness and overall liking, had much higher between-animal variance components (Table 3). As heritability estimates from the literature have wide ranges (e.g. 0 to 0.46 for juiciness; Splan et al., Reference Splan, Cundiff and Van Vleck1998; Dikeman et al., Reference Dikeman, Pollak, Zhang, Moser, Gill and Dressler2005), it is difficult to meaningfully compare our values to those of other published studies.
High positive, significant correlations were observed between tenderness, juiciness and overall liking (0.54 to 0.60), suggesting that overall liking is strongly influenced by tenderness and juiciness, which has been previously reported (Villarroel et al., Reference Villarroel, María, Sañudo, Olleta and Gebresenbet2003). A low but significant correlation was also observed between tenderness and flavour. This effect could be due to the ‘halo effect’, when an attribute is enhanced by other characteristics of the product (Meilgaard et al., Reference Meilgaard, Civille and Carr1999). When a panellist experiences a tender piece of meat, he/she is more likely to assign a higher score for other, seemingly unrelated traits, such as flavour, even if this high score is undeserved.
A moderate, significant negative correlation was also observed between taste panel tenderness and the tenderometer measure of tenderness (−0.25). This value, whilst in the predicted direction, is lower than expected. This is most likely because the human interpretation of tenderness is not simply related to the force required to shear meat, but includes factors such as the rate at which fibres are broken down. Thus, a simple physical measurement of shear force cannot incorporate all the features of a human-based evaluation (Warriss, Reference Warriss2000). The correlation is also lower than that from experiments involving the Warner Bratzler (WB) measure of shear force, a similar mechanical measure of tenderness (for review see Marshall (Reference Marshall1994)) where published correlation coefficients between taste panel and WB shear force tended to be somewhat stronger (approximately −0.70) than in the present study. This discrepancy may be due, in part, to the small sample size or may be a reflection of the untrained taste panel used here.
Positive, highly significant, correlations were detected between both normal and abnormal odour, and their flavour counterparts, whilst negative correlations were present between abnormal flavour and odour, and their normal counterparts. This may be the result of real relationships between these aspects of meat, resulting from fat-dependent mechanisms of flavour and aroma development (Mottram, Reference Mottram1998; Warriss, Reference Warriss2000; Calkins and Hodgen, Reference Calkins and Hodgen2007), or it could be due to the closely associated mechanisms of aroma and flavour detection in humans (Shepherd, Reference Shepherd2006).
Very few correlations that were significantly different from zero were observed between meat quality and carcass traits, and those that were significant were weak indicating that there are no obvious relationships between carcass and meat quality traits. A positive correlation was found between fat class and flavour (0.12), which is in agreement with previous work in both cattle and pigs (Van Vleck et al., Reference Van Vleck, Hakim, Cundiff, Koch, Crouse and Boldman1992; Blanchard et al., Reference Blanchard, Willis, Warkup and Ellis2000; Riley et al., Reference Riley, Chase, Hammond, West, Johnson, Olson and Coleman2003) suggesting that fat levels positively influence flavour. The degradation of fats during cooking is known to give the species-specific flavour components that determine the differences between beef, lamb and pork (Mottram, Reference Mottram1998).
A significant negative correlation (−0.13) was found between tenderometer score and fat level, particularly the amount of fat surrounding the sirloin muscle. A positive, although non-significant, correlation was also found between fat level and the taste panel-assessed tenderness trait. This suggests an increase in tenderness with an increase in fatness, which is consistent with published correlation coefficients between shear force and various fat-related traits (Marshall, Reference Marshall1994; Blanchard et al., Reference Blanchard, Willis, Warkup and Ellis2000; Riley et al., Reference Riley, Chase, Hammond, West, Johnson, Olson and Coleman2003).
In conclusion, the low heritabilities estimated for the meat quality traits, and the obvious difficulty involved in measuring these phenotypes, limits the effectiveness of traditional quantitative breeding (Dekkers and Hospital, Reference Dekkers and Hospital2002). Making progress with these traits using direct measurement is likely to be time-consuming and costly. For these reasons, we believe that the next step in the improvement of such traits is to investigate whether associations exist between meat quality traits and genetic loci, possibly starting from candidate genes. If significant associations can be found, then marker-assisted selection could be implemented. This process has the added advantage of being able to assign breeding values to live animals, so that post-slaughter scoring is not necessary. Whilst many of the heritability estimates are low, we believe that for some traits this is partly due to high levels of residual variance resulting from various factors. This can be overcome if strong marker–trait associations are found. In fact, examples exist of quantitative trait loci being identified for traits with relatively low heritabilities. For example, Karamichou et al. (Reference Karamichou, Richardson, Nute, Gibson and Bishop2006) identified a quantitative trait locus in sheep on chromosome 21 for the levels of linoleic acid in meat, the heritability of which was estimated at only 0.10.
Acknowledgements
This work was funded by the BBSRC (who provided a studentship for J. L. Gill), Scotbeef and Genesis Faraday. The authors would like to acknowledge Suzie England (Scotbeef) for her contribution to the project as well as Geoff Nute (University of Bristol) for his assistance with the design of taste panel protocols. Contributions by O. Matika, P. Wiener and S. C. Bishop were supported by a BBSRC Institute Strategic Programme Grant. Additionally, we would like to thank two anonymous referees who suggested improvements to the structure of the manuscript.
Appendix 1
Paternity determination
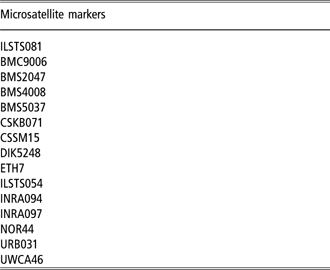
Due to the possibility of multiple sire mating and discrepancies between the sire stated by the farmer and the true sire, it was necessary to determine paternity through the use of genetic markers. Genomic DNA was extracted from previously frozen whole blood (taken at the time of slaughter) for the offspring and from a 9 ml sample of blood obtained from on-farm sires. DNA extraction involved an initial cell lysis process using 0.75% Triton-X-100 (Sigma Aldrich, UK) and 10 mM Tris HCl, followed by deproteinisation with sodium perchlorate (Sigma Aldrich, UK), extraction with chloroform and precipitation with ethanol. A DNA profile was obtained for each sample by testing with a panel of 15 unlinked microsatellite markers (see Table A1). Resulting genetic data for each offspring and all possible sires were analysed with the program Cervus (Marshall et al., Reference Marshall, Slate, Kruuk and Pemberton1998), which assigns paternity using a likelihood method. In some cases, the sire suggested by the farmer had been culled before a DNA sample could be taken, so that these sires could not be included in the paternity assignment. For analysis involving these offspring (91), the sire was set to that suggested by the farmer, unless an alternative sire from the same farm was found to match the offspring at all 15 loci.
Microsatellite marker panel used for paternity determination
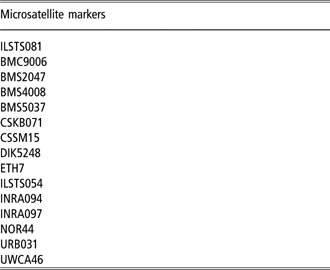
Following paternity assignment, there were 97 samples for which there was one or more genotype inconsistency between the offspring and the designated sire. As there was no means of quantifying the genotyping error rate, we used the exclusion probabilities to determine the cut-off for an allowable level of inconsistencies (Dodds et al., Reference Dodds, Tate, McEwan and Crawford1996; McRae et al., Reference McRae, Bishop, Walling, Wilson and Visscher2005). The probability of an incorrectly assigned parent–offspring pair having inconsistent genotypes at a marker locus, l, was calculated as:

where St = ∑pi t and pi is the frequency of Ai the ith allele.
The distribution of the number of inconsistent genotypes expected for an incorrectly assigned parent–offspring pair was approximated using a binomial distribution with n = 15 (i.e. the number of informative markers) and probability Q = 0.2609, the average of Ql over all loci l. From this approximation, 93.25% of all incorrect parent–offspring pairs will have two or more inconsistencies or mismatches. As the probability of 0 or 1 mismatches between an incorrectly assigned sire and offspring pair was low (0.07 = 1 − 0.93), a single mismatch between the sire and offspring was allowed. This enabled the inclusion of further 28 parent–offspring pairs. Offspring with two or more inconsistencies with their sire had their sire set to ‘unknown’ in the pedigree. This comprised 69 animals. In total, the dataset comprised 42 allocated sires.