INTRODUCTION
Since the development and popularization of matrix population models in the past 20 y, a great deal of information has been produced on the demography of tropical tree species (Álvarez-Buylla & Martínez-Ramos Reference ÁLVAREZ-BUYLLA and MARTÍNEZ-RAMOS1992, Hartshorn Reference HARTSHORN1972, Hernández-Apolinar et al. Reference HERNÁNDEZ-APOLINAR, VALVERDE and PURATA2006, Jiménez-Lobato & Valverde Reference JIMÉNEZ-LOBATO and VALVERDE2006, Martínez-Ramos et al. Reference MARTÍNEZ-RAMOS, SARUKHÁN, PIÑERO, Davy, Hutchings and Watkinson1988, Olmsted & Álvarez-Buylla Reference OLMSTED and ÁLVAREZ-BUYLLA1995, Peters Reference PETERS, Gómez-Pompa, Whitmore and Hadley1991, Piñero et al. Reference PIÑERO, MARTÍNEZ-RAMOS and SARUKHÁN1984, Sarukhán Reference SARUKHÁN, Tomlinson and Zimmermann1976, Zagt & Boot Reference ZAGT, BOOT and Zagt1997), which has significantly contributed to our understanding of the population dynamics of plants in nature.
The use of population projection matrices in plant demography has several advantages, including its relative simplicity, flexibility to accommodate to different types of life cycles and life-history traits (Caswell Reference CASWELL2001, Caswell et al. Reference CASWELL, NISBEL, DE ROOS, TULJAPURKAR, Tulkapuljar and Caswell1997), and its ability to evaluate the relative importance of particular life-cycle stages or demographic processes for population dynamics (Caswell Reference CASWELL2001, de Kroon et al. Reference DE KROON, PLAISIER, VAN GROENENDAEL and CASWELL1986, Silvertown et al. Reference SILVERTOWN, FRANCO, PISANTY and MENDOZA1993). This last feature has traditionally been addressed through sensitivity and elasticity analyses (i.e. prospective perturbation analyses), which give a measure of the absolute or relative sensitivity of population growth rate (λ) to potential changes in matrix entries (de Kroon et al. Reference DE KROON, PLAISIER, VAN GROENENDAEL and CASWELL1986). Although elasticity analysis has proved immensely useful and led to valuable insights (Silvertown et al. Reference SILVERTOWN, FRANCO, PISANTY and MENDOZA1993), it has also been criticized for its limited realism (de Kroon et al. Reference DE KROON, VAN GROENENDAEL and EHRLÉN2000), since it frequently identifies matrix entries which, if affected, would potentially contribute to large changes in population growth rate, but which turn out to be almost invariant in time and space (de Kroon et al. Reference DE KROON, VAN GROENENDAEL and EHRLÉN2000).
Nevertheless, it is well known that the λ of most populations varies in space and time. This variation is clearly due to changes in matrix entries, and a great deal of research has been directed towards understanding how changes in particular matrix entries are reflected in variations in λ. Thus, in addition to prospective perturbation analyses, retrospective analyses (frequently referred to as Life Table Response Experiments, LTRE) are now being used to understand the way in which actual variation in matrix entries translates into variation in λ (de Kroon et al. Reference DE KROON, VAN GROENENDAEL and EHRLÉN2000, Ehrlén & van Groenendael Reference EHRLÉN and VAN GROENENDAEL1998, Horvitz et al. Reference HORVITZ, SCHEMSKE, CASWELL, Tuljapulkar and Caswell1997, Pulido et al. Reference PULIDO, VALVERDE and CABALLERO2007, Tuljapurkar Reference TULJAPURKAR, Tulkapuljar and Caswell1997, Wisdom & Mills Reference WISDOM and MILLS1997). LTREs can help us explore and understand in greater detail the demographic patterns of populations in nature. The only limitation of LTREs is that one must first sample the actual variation in matrix entries by obtaining several projection matrices, i.e. in different sites and/or years. The reliability of a LTRE will therefore depend on how accurately the observed matrices reflect the actual variation in the demographic behaviour of the population.
Zuidema & Franco (Reference ZUIDEMA and FRANCO2001) recently proposed a perturbation analysis that overcomes some of the disadvantages mentioned above. Their method, called variance-standardized perturbation analysis (VSPA), calculates the coefficient of variation of λ resulting from the coefficient of variation of the different vital rates involved in the estimation of matrix entries (calculated, in turn, according to the observed variation among individuals in the case of fecundity, and according to the binomial distribution of probability values for other vital rates). This analysis has several advantages over other perturbation analyses: (1) it may be applied to a single population projection matrix; (2) it identifies matrix entries with an actual potential for variation; and (3) it evaluates the contribution of this variation to the coefficient of variation of λ.
In this paper we address the population dynamics of a tropical tree species, Manilkara zapota (L.) Royen through the use of population projection matrices. Particularly, we explore the consequences of using two different forms of perturbation analysis: ordinary elasticity analysis, and VSPA, in order to identify matrix entries (or vital rates) that have the potential to translate into variation in λ between years and/or sites. This species possesses several features that make it an interesting subject for population studies. First, it lacks a buried seed bank in the soil, and since its seeds are short-lived, they either germinate or die within a few weeks after dispersal. Instead of a seed bank, M. zapota relies on densely packed seedling and sapling carpets which dominate the understorey of extensive forest areas. From these, a few individuals grow to produce juveniles and eventually reproductive adults (apparently triggered by gaps opening in the canopy) (Cruz-Rodríguez & López-Mata Reference CRUZ-RODRÍGUEZ and LÓPEZ-MATA2004). The occurrence of this kind of seedling bank is a common feature among late-successional tropical trees and has been recognized as an important ecological aspect of their life cycle that enables populations to persist within the shifting mosaic of tropical forest conditions (Bongers et al. Reference BONGERS, POPMA and IRIARTE-VIVAR1988, Canham Reference CANHAM1988, De Steven Reference DE STEVEN1994, Lieberman Reference LIEBERMAN and Swaine1996, Sasaki & Mori Reference SASAKI and MORI1981, Swaine Reference SWAINE and Swaine1996, Uhl et al. Reference UHL, CLARK, DEZZEO and MAQUIRINO1988). Secondly, M. zapota is an important component and a valuable resource for inhabitants of the tropical forests of Mesoamerica. Its fruits are highly prized and its sap is the main source of the latex gum known as ‘chicle’. Populations of this tree therefore represent an important subject for ecological studies, as their results may be used to guide appropriate management of the species.
METHODS
Species studied: Manilkara zapota
This tree belongs to the family Sapotaceae. In its adult stage, it may reach 45 m in height and 125 cm dbh. It is a slow-growing tree that bears simple leaves with variable morphology. Its distribution range spans from the Mexican states of San Luis Potosi and Veracruz, to Panama in the south, at elevations from 0 to 800 m. In Mexico, it occurs on well-drained soils in tropical evergreen and subtropical forests in the coastal plains along the Gulf and Pacific coasts (Pennington & Sarukhán Reference PENNINGTON and SARUKHÁN1998).
Manilkara zapota is pollinated by insects. It flowers almost all year long, from February to October, although it has two yearly periods of maximum flower production, one in March–June, and the other in September–October. Fruits ripen and fall to the ground, where they are secondarily dispersed by small mammals. The season of maximum fruit production is from December to March (Pennington & Sarukhán Reference PENNINGTON and SARUKHÁN1998).
Study site
This study was carried out on a 1-ha long-term research plot in a tropical semi-evergreen forest located in Santa Gertrudis, municipality of Vega de Alatorre, in central Veracruz state, Mexico (19°49′37″−19°51′50″N, 96°32′37″−96°37′39″ W; 300–900 m asl). This forest is a private property of about 925 ha which has not been logged for more than a century, although non-timber forest products are extracted frequently, but non-intensively. The vegetation is a mosaic of patches of tropical semi-evergreen forest (‘selva mediana subperennifolia’ – sensu Miranda & Hernández-X Reference MIRANDA and HERNÁNDEZ-X1963) in different successional stages, resulting from the incidence of natural disturbances and, to a lesser extent, from human intervention. Of the 925 ha of this private property, only 40 ha are pastureland used for cattle ranching, and c. 25 ha are coffee plantations; the rest of the property is unaltered forest.
The climate of the area, according to the nearest meteorological station (Misantla, located c. 25 km away), is subtropical and seasonal, with an average annual rainfall of 2217 mm and a mean annual temperature of 20.2°C. The rainy season lasts from June to November and contributes 70% of the total annual rainfall. In the dry season, from December–April, c. 40% of trees lose their leaves (Godínez-Ibarra & López-Mata Reference GODÍNEZ-IBARRA and LÓPEZ-MATA2002, Gómez-Pompa Reference GÓMEZ-POMPA1977). Most of the soils at the site are derived from calcareous rock, with small portions from volcanic rock.
Field methods
Manilkara zapota individuals were classified into nine categories defined according to several size and stage variables (i.e. presence of cotyledons, plant height, length of the largest leaf, diameter at breast height (dbh), and presence of reproductive structures, Table 1). All M. zapota individuals with a dbh > 1 cm (i.e. Juveniles 3 and 4, and Adults, n = 91) established within the 1-ha study plot were marked and their dbh and height were measured. Their demographic fate was evaluated once per year from October 1998 to October 2000. Individuals of less than 1 cm dbh were followed by one of two different procedures according to their height: (1) those less than 35 cm in height (seedlings, and saplings 1, 2 and 3; n = 635) were selected in eight 10-m2 subplots chosen randomly within the 1-ha plot; (2) individuals of 35–200 cm in height (Juveniles 1 and 2; n = 57) were selected in 13 subplots of 40 m2. The densities of individuals in each of these categories are given in Table 1.
Categories used to analyse the demography of Manilkara zapota at Santa Gertrudis, in the Mexican state of Veracruz. Note that both size and stage features were used to define categories. L = Length of the largest leaf (cm); H = plant height (cm); dbh = diameter at breast height (cm). Densities are given in different area units, depending on the areas sampled at Santa Gertrudis for each plant category.

Transition matrices were constructed using the data of the demographic fates of individuals in each category (Table 1). Only the Adult stage (determined according to the size of the smallest reproductive individuals observed) may contribute to the seedling category. No seed category was included due to the fact that this stage of the life cycle is short-lived in this species (Vázquez-Yanes et al. unpubl. data). Matrix entries were calculated from the survival and growth of these individuals, as detailed below. Fruit and seed production were evaluated over two reproductive periods by placing 5–8 0.5-m2 circular litter traps directly beneath the crowns of each of 11 adult trees (dbh ≥ 30 cm), which were periodically checked to record the number of fruits produced per tree. To estimate the number of fruits produced per adult tree, the number of fruits per trap was extrapolated to the total crown area of each tree. Crown area (C) was calculated as an ellipse, C = π × (D1/2) × (D2/2), where D1 and D2 are the longest crown diameter and the longest diameter perpendicular to it, respectively. The average number of fruits per tree was used to estimate the average number of seeds per tree, by multiplying it by 1.78 (i.e. the average number of seeds per fruit, n = 225). Finally, to estimate fecundity in terms of the number of seedlings produced per tree, the average number of seeds was multiplied by 0.75, since 75% of the seeds of M. zapota germinate in natural conditions to produce seedlings (Vázquez-Yanes et al. unpubl. data).
Construction of population projection matrices
To build population projection matrices for each year-long period, we used category-specific individual growth and mortality rates, as well as fecundity data. The four types of matrix elements that were derived from these data were: stasis (Pij), the size-specific probability of surviving and remaining in the same category; growth (Gij), the probability of surviving and progressing to the next larger size category; retrogression (Rij), the probability of surviving and decreasing in size, thus moving to a smaller category; and fecundity (Fij), the average number of seedlings produced per adult tree. Note that several lower-level demographic parameters underlie the calculation of these matrix elements. For instance, Pij combines both survival (σj) and growth (γij, positive growth; and ρij, negative growth); Pij = σj (1 – ∑γij – ∑ρij). Similarly, Gij = σj γij; Rij = σj ρij and Fj = σj fj). In summary, the lower-level demographic parameters are: size-specific survival (σj = number of individuals in category j surviving to t + 1/number of individuals in j present at time t), positive growth (γij = number of individuals moving from j to i in t + 1/number of individuals in j present at time t, where j < i), negative growth (ρij = number of individuals moving from j to i in t + 1/number of individuals in j present at time t, where j > i), and reproduction (fS j = the contribution of individuals in category j to the seedling category (S) between t and t + 1). These lower-level demographic parameters represent the basic demographic processes underlying matrix elements (Franco & Silvertown Reference FRANCO and SILVERTOWN2004, Zagt & Boot Reference ZAGT, BOOT and Zagt1997, Zuidema & Franco Reference ZUIDEMA and FRANCO2001), and will be analysed in more detail in the following sections.
The matrix elements corresponding to all the seedling categories, as well as those for Juveniles 1 and 2, were calculated from the observed frequency of death and transition to the different categories from one year to the next. However, the entries corresponding to Juveniles 3 and 4 and Adults were estimated from their growth rate, since no transitions were observed in the field due to the high longevity and slow growth rate of the individuals of this species. Thus the probability of moving to the following size class was calculated in these cases from the mean residence time in each category (T), calculated according to diameter growth rate. The transition probabilities (G) were calculated as σ /T. Adult mortality was estimated assuming that individuals reach a maximum size of 120 cm dbh (which corresponds to the largest dbh recorded at this site) and then die, from which their T value was derived.
Matrix analysis
Two annual matrices were constructed: 1998–1999 and 1999–2000. For each matrix we used the power method to calculate the dominant eigenvalue and the left and right eigenvectors, which are interpreted as the finite rate of population growth (λ), stable size distribution (w), and size-specific reproductive values (v), respectively. In addition, sensitivity and elasticity matrices were calculated to evaluate the potential effect on λ of small absolute and relative changes in matrix elements (Caswell Reference CASWELL2001). These basic matrix analyses were carried out using RAMAS-Stage Matrix (Ferson Reference FERSON1990).
Variance-standardized perturbation analysis (VSPA)
The variance-standardized perturbation analysis uses the elasticity of the lower-level demographic parameters that underlie matrix elements (i.e. σi, γi, ρi and fi) to estimate the coefficient of variation of λ (CV λ) that emerges from expected variation between individuals, or from the uncertainty in the estimation of such parameters (Zuidema & Franco Reference ZUIDEMA and FRANCO2001). The coefficient of variation of λ associated with variation (or uncertainty) in the lower-level demographic parameter x ij is given by CV λij = CV (xij) × eij, where CV (xij) is the coefficient of variation of the demographic parameter x, and eij is its elasticity value. The coefficient of variation of demographic parameters associated with Seedlings and Juveniles 1 and 2 were obtained from the binomial frequency distribution, since they represent probabilities (Zuidema & Franco Reference ZUIDEMA and FRANCO2001). For Juveniles 3 and 4, and Adults, the coefficient of variation of demographic parameters were calculated assuming a normal distribution, since their values were estimated from individual growth rates (Zuidema & Franco Reference ZUIDEMA and FRANCO2001). The elasticity of lower-level demographic parameters was calculated following the equations developed by Caswell (Reference CASWELL2001) and Zuidema & Franco (Reference ZUIDEMA and FRANCO2001).
RESULTS
Matrix analysis
The two matrices projected different λ values (Tables 2 and 3). During the first period (1998–1999) population growth rate was slightly below 1 (λ = 0.987), while in the second (1999–2000) it was clearly greater than 1 (λ = 1.038). The main difference between the two matrices was that in the first year seed production was low, resulting in an average fecundity of 17.7 seedlings per tree (Table 2), whereas the second period corresponded to a reproductive year during which reproductive trees produced large numbers of seeds, resulting in an average seedling production of 2048 seedlings per tree (Table 3). In general, survival of M. zapota individuals was high, with over 80% of individuals in categories Sapling 2 and larger surviving from one year to the next. In the two smallest categories (Seedlings and Saplings 1) mortality was substantially higher, from 22% to 58%. Seedling mortality was highest during the period in which reproduction was limited, which also accounted for the low λ value observed for this period. The value of matrix entries representing stasis was always higher than that of growth entries, which is a reflection of the relatively slow growth rate of M. zapota trees.
Population projection matrix for the Manilkara zapota population studied at Santa Gertrudis, corresponding to the period 1998–1999. λ = 0.987. Categories as defined in Table 1. SSD = stable size distribution; RV = size-specific reproductive values; qx = mortality rate; N = sample size per category.

Population projection matrix for the Manilkara zapota population studied at Santa Gertrudis, corresponding to the period 1999–2000. λ = 1.038. Categories as defined in Table 1. SSD = stable size distribution; RV = size-specific reproductive values; qx = mortality rate; N = sample size per category.

In a few cases, particularly in the second year, young individuals (Saplings 2, Saplings 3 and Juveniles 1) retrogressed to smaller size categories, sometimes decreasing in size so much as to move back two or three categories. This was due to the consumption of leaf tissue by herbivores, which in some cases resulted in complete defoliation. Following herbivory, plants generally produced smaller leaves (note that leaf size was an important criterion for assigning category in small plants; Table 1). Additionally, in other cases, branch loss produced damage in young individuals, returning them to smaller categories.
The stable size distribution obtained for the 1998–1999 matrix was characterized by a high proportion of small individuals. The first three categories (Seedlings, Saplings 1 and Saplings 2) together accounted for 97% of the projected population at stability, while Adult individuals would correspond to less than 2% (Table 2). In the second matrix, the projected population structure at equilibrium would be made up of 98.6% Seedlings, Saplings 1 and Saplings 2, while the Adult category would represent just over 0.01% (Table 3). In both cases, the intermediate size categories (Saplings 3, Juveniles 1, 2, 3 and 4) represent a small proportion of the projected population structure (Tables 2 and 3). The observed population structure (estimated from the densities per category given in Table 1) is composed of 5.9% Seedlings, 16% Saplings 1, 66.2% Saplings 2, 5.3% Saplings 3 and 6.4% for all remaining categories. It does not resemble either of the two stable population structures obtained; however, the high proportion of Saplings 2 is a feature common to both the observed and the stable population structure of the 1999–2000 matrix (Table 3).
As expected, the size-specific reproductive values (i.e. the left eigen-vectors) showed the highest values in the Adult category (53.6% in 1998–99, and 51.4% in 1999–2000; Tables 2 and 3). In the non-reproductive year, the categories Juveniles 3 and Juveniles 4 had most of the remaining reproductive value (43.7%), whereas in the reproductive year these two categories accounted for only 38.4%, and the smaller juvenile categories (Juveniles 1 and 2) had 10.2% of the total reproductive value (Tables 2 and 3).
Perturbation analysis
We calculated sensitivity and elasticity matrices (prospective perturbation analysis) for the two year-long periods (Tables 4 and 5). For the period with a low λ value (i.e. 1998–1999, in which reproduction was negligible), the entry with the highest sensitivity and elasticity was the persistence of Adults in their category (Table 4). The rest of the matrix elements showed very low sensitivity and elasticity values, with reproductive entries having the lowest values observed. In contrast, in the second year, when reproduction was massive and λ reached a value of 1.038 the sensitivity and elasticity pattern was quite different (Table 5). Relatively high values were still seen in the persistence of Adults, but other matrix entries contributed significantly to population dynamics. In the case of the elasticity matrix, the persistence of J3 and J4 individuals in their category showed high values (Table 5). In the sensitivity matrix these two entries were also important, but the growth of Saplings 2 and Saplings 3 to the following categories had surprisingly high sensitivity values, as did the growth of Juvenile 3 and Juvenile 4 individuals (Table 5). As discussed below, these high sensitivity entries have important consequences for the results of the VSPA.
Sensitivity (sij), and elasticity (eij) matrices for the Manilkara zapota population, corresponding to the 1998–1999 period. Categories as defined in Table 1. Only the sensitivities of positive projection matrix entries are shown.

Sensitivity (sij), and elasticity (eij) matrices for the Manilkara zapota population, corresponding to the 1999–2000 period. Categories as defined in Table 1. Only the sensitivity matrix entries that differ from zero are shown.

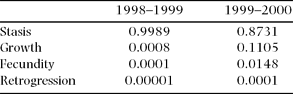
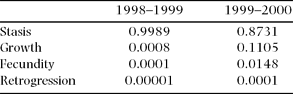
When analysed by demographic process (i.e. growth, stasis, reproduction and retrogression, sensu Silvertown et al. Reference SILVERTOWN, FRANCO, PISANTY and MENDOZA1993), the elasticities show that in both years the demographic process with the highest contribution to λ was stasis (Table 6). Nevertheless, the difference between the two years is notable, with a much higher contribution of growth and fecundity in the second year, in which λ was above unity (Table 6).
Summed elasticity values per demographic process corresponding to the 1998–1999 and the 1999–2000 population projection matrices of the Manilkara zapota population studied.
Variance-standardized perturbation analysis (VSPA)
According to our results, in 1998–1999 the only lower-level demographic parameter that resulted in a very high CV(λ) was the survival of adults (σA) (Table 7), which coincided with its high elasticity value (i.e. 0.999). On the other hand, in 1999–2000, the lower-level demographic parameters that resulted in the highest CV(λ) were the positive growth of saplings (γSa3 Sa2 and γJ1 Sa3); other lower-level demographic parameters that resulted in a relatively high CV (λ) in this matrix were the positive growth of juveniles 3 (γJ4 J3), the survival of juveniles 1 (σJ1), the positive growth of juveniles 4 (γJ4 A) and juveniles 1 (γJ2 J1), and adult fecundity (fA). It is worth noting that this second matrix gave, in general, much higher CV(λ) than the first one (i.e. from 0.049% to 14.0% in 1999–2000; compared with 0.004% to 8.29% in 1998–1999). This was due to the higher elasticity values obtained for lower-level demographic parameters in the second year compared with the first year, in which almost all the elasticity was concentrated in a single value (σA). The coefficient of variation of these individual parameters (CV(xij)) was similar for both years (Table 7).
Results of variance-standardized perturbation analysis (VSPA) for the two population matrices obtained in the Manilkara zapota population at Santa Gertrudis, Veracruz. The values of lower-level demographic parameters, DP (survival, σj; positive growth, γij; negative growth, ρij; and fecundity, fS j) along with their coefficient of variation (CV(xij)) are given for each matrix. The eij in this table represent the elasticity of each lower-level demographic parameter, which was calculated as detailed in Zuidema & Franco (Reference ZUIDEMA and FRANCO2001). CV(λ) is the coefficient of variation of λ due to potential variation in the lower-level demographic parameters.

When contrasting the results of the elasticity analysis with those obtained using VSPA, we observed that the ranking of vital rates changed substantially depending on the analysis used. For example, in the first year, although both analyses showed that survival of adults (σA) was the most important demographic process (Figure 1), the ranking of other demographic parameters changed, in particular those corresponding to juvenile survival. For instance, σJ3 ranked fourth in elasticity but 12th in its contribution to CV(λ); σJ4 ranked third in elasticity and eighth in its contribution to CV(λ). On the other hand, positive growth of saplings (γJ1 Sa3) moved from 12th to fourth place, and positive growth of juveniles (γJ3 J2) moved from 13th to fifth place (Figure 1).
Hierarchy of vital rates derived from the demographic analysis of Manilkara zapota, according to their contribution to changes in λ. Results from two perturbation methods are presented: elasticity of the vital rate, e, and variance-standardized perturbation measured as CV(λ), respectively. Survival (σ) (a, b); positive growth (γ) (c, d); negative growth (ρ) (e, f) and fecundity (fi) (g, h).

In 1999–2000, the differences between the two analyses were clearer, given that both the elasticity values and the contributions to CV(λ) were not as concentrated in a single vital rate (Table 7). Here it is worth noting that adult survival (σA) moved from first place in the elasticity analysis to ninth place in its contribution to CV(λ) (Figure 1). Similarly, the survival of the large juveniles (σJ4) moved from third to 20th place. As was the case for the previous period, in this year the relative importance of positive growth was also higher than when it was evaluated through elasticity. For instance, the positive growth of small saplings (γSa3 Sa2) moved from 10th place to second place, while the positive growth of larger saplings (γJ1 Sa3) moved from 11th to first place (Figure 1).
In general, the ranking of fecundity and negative growth remained the same in both analysis and for both years, the only exception being the negative growth of small juveniles (ρSa2 J1), which took 21st place in the elasticity analysis and moved to 13th place in the VSPA (Figure 1).
DISCUSSION
In this paper we used the demographic data of a population of Manilkara zapota to compare the results of two different analytical techniques designed to evaluate the potential contribution of demographic processes to changes in population growth rate (λ). The relevance of these type of perturbation analyses has been widely discussed in the ecological literature (Caswell Reference CASWELL2001, de Kroon et al. Reference DE KROON, PLAISIER, VAN GROENENDAEL and CASWELL1986, Reference DE KROON, VAN GROENENDAEL and EHRLÉN2000). But the best way to arrrive at a robust, realistic and straightforward assesment of the relative importance of demographic processes is still in question (de Kroon et al. Reference DE KROON, VAN GROENENDAEL and EHRLÉN2000, Zuidema & Franco Reference ZUIDEMA and FRANCO2001). Thus, we made use of a system from which we have considerable empirical knowledge (i.e. the Manilkara zapota population at Santa Gertrudis; Cruz-Rodríguez Reference CRUZ-RODRÍGUEZ2007, Cruz-Rodríguez & López-Mata Reference CRUZ-RODRÍGUEZ and LÓPEZ-MATA2004), and we analysed it both through an elasticity analysis and a VSPA. We explored how each of these analytical tools supported our idea that the population of Manilkara zapota relies on sporadic reproductive pulses, from which a seedling bank is created, and from which adult individuals eventually emerge (Cruz-Rodríguez & López-Mata Reference CRUZ-RODRÍGUEZ and LÓPEZ-MATA2004).
Elasticity analysis has been criticized on the basis that the entries that generally have high elasticity values are precisely those with a low potential for variation, thus limiting the usefulness of these analyses for deepening our understanding of demographic patterns in nature, as well as restricting their utility for conservation and management (de Kroon et al. Reference DE KROON, VAN GROENENDAEL and EHRLÉN2000). On the other hand, VSPA concentrates on demographic processes that have an actual potential for variation. Thus, we tested whether VSPA identified similar or different demographic processes as important to population dynamics compared with those identified by elasticity analysis alone.
The elasticity pattern of the first matrix (λ < 1, low reproduction), showed that the stasis of adults accounted for 99.3% of total elasticity. The λ value of this matrix was 0.987, which is almost identical with the survival rate of adults. This implies that in a decreasing population with no recruitment, the rate at which the population decreases is the same as the rate at which adults die (Valverde et al. Reference VALVERDE, QUIJAS, LÓPEZ-VILLAVICENCIO and CASTILLO2004). The whole of the λ value may thus be explained by the PA,A entry alone, which is why the elasticity value of this matrix entry is almost the whole of total elasticity. For this non-reproductive year, the results of the VSPA coincided with those of the elasticity analysis in the sense that it identified the survival of adults as the demographic process which most heavily influenced the population growth rate.
In the second year, when λ > 1, the elasticity pattern differed significantly from the one found the previous year. Although the PA,A entry still had the highest elasticity value, with 37.3% of total elasticity, the elasticity corresponding to the persistence of juveniles 3 and 4 together accounted for 34% of the λ value. This suggests that these life-cycle stages are important for the growth of the M. zapota population. However, the VSPA gave a different picture than the elasticity analysis in this second year: the growth of Saplings 2 and 3 were the most important parameters potentially affecting the variation in λ. In fact, the relative importance of the growth of all the small-size categories (in order of decreasing importance; Saplings 3, Saplings 2, Juveniles 3, Juveniles 4 and Juveniles 1) was higher according to the VSPA than to the elasticity analysis (Figure 1). This indicates that variation in these demographic parameters has the potential to substantially affect λ, not only because these parameters have a strong absolute influence on λ (i.e. sensitivity), but also because they have a high coefficient of variation. The importance of this result is that a high proportion of the Manilkara zapota population is currently in these size categories, since they comprise the seedling bank referred to above. From these categories emerge the future reproductive individuals, which, triggered by the opening of a canopy gap, may eventually reach the canopy and start contributing to future generations. Thus the size categories that are intuitively important and upon which the maintenance of the population rests were clearly identified by the VSPA as such, while the elasticity analysis failed to spot them.
Regarding the contribution of our study to the knowledge of the population ecology of tropical trees, we may confirm that the λ value of the M. zapota population for the second period (λ = 1.038) was high compared with other shade-tolerant tropical trees. For instance Hartshorn (Reference HARTSHORN1972) obtained λ = 1.002 for Pentaclethra macroloba, and Zagt (Reference ZAGT1997) obtained λ values between 0.998 and 1.028 for Chlorocardium rodiei, Dicymbe altsonii and Duguetia neglecta. However, in 1998–1999 the M. zapota population showed a λ = 0.987, which appears to describe a declining population. The high yearly variation in λ that we observed in M. zapota seems to be common among other tropical trees (Álvarez-Buylla Reference ÁLVAREZ-BUYLLA1994, Álvarez-Buylla et al. Reference ÁLVAREZ-BUYLLA, GARCÍA-BARRIOS, LARA-MORENO and MARTÍNEZ-RAMOS1996, Enright & Ogden Reference ENRIGHT and OGDEN1979). This pattern, along with the high longevity of these species, implies that short-term studies will inevitably be limited in their scope and ability to throw light on their long term demographic patterns. However, sometimes researchers must comply with short-term demographic analyses due to limitations in financial and/or logistic matters. In such cases, a numerical tool able to offer some insight into the potential variability (or uncertainty) of vital rates may become a very valuable instrument. We believe such an instrument may indeed be the VSPA (Zuidema & Franco Reference ZUIDEMA and FRANCO2001) which, as far as we know, has not received as much attention as it deserves.
Apart from the difference in the λ value of the two study years, variability in the demographic behaviour of the M. zapota population may be discerned in its population structure, which consists of a large number of young individuals (Saplings 1 and 2), and very few large trees. Such a structure is a common result of temporal variability in reproductive success, i.e. years of abundant recruitment resulting in the formation of a seedling bank, followed by years with almost no recruitment (Janzen Reference JANZEN, Tomlinson and Zimmermann1976). From this seedling bank only few individuals achieve maturity. This colonization strategy is common among late-successional, shade-tolerant tree species with short-lived seeds that do not form persistent seed banks in the soil (e.g. Brosimum alicastrum, Chlorocardium rodiei, Chrysophyllum sp. nov. and Pentaclethra macroloba; Connell & Green Reference CONNELL and GREEN2000, Hartshorn Reference HARTSHORN1972, Peters Reference PETERS, Gómez-Pompa, Whitmore and Hadley1991, Zagt & Boot Reference ZAGT, BOOT and Zagt1997). The periodicity of reproductive events also determines the temporal variability in demographic behaviour. In Manilkara zapota, for instance, seed production occurs through mast-seeding events that apparently take place every 4–6 y (pers. obs.). In fact, one of our study periods (i.e. 1999–2000) corresponded to a mast-seeding event. In this year, seedling recruitment was more than 100 times higher than in the previous one, which resulted in a λ value of 1.038, compared with 0.987 in the previous year. Interestingly, only four adult individuals (out of the 12 in our sample) were responsible for the high seed production observed between February and October 2000. During this year, seedling mortality was lower than in the previous year, which also contributed to the high λ obtained in 1999–2000.
The contrast between the two λ values obtained suggests that the persistence mechanism of M. zapota consists of seedling establishment pulses followed by periods in which the overall population appears to be decreasing in size (exemplified by the 1998–1999 matrix). The occurrence of years with positive population growth followed by long periods of decreasing population numbers may be common among long-lived plants. Here we have shown that VSPA has the potential to actually identify the vital rates that determine this contrast in their demographic behaviour. In addition, it would be interesting to apply a comparative elasticity vs. VSPA analysis to other plant species in order to truly appreciate the potential of VSPA for future demographic studies. In particular, it would be necessary to empirically confirm whether vital rates with high estimated coeficients of variation are indeed as variable in space and time as predicted by the uncertainty associated to their estimation, according to their binomial distribution (in the case of probabilities). This type of empirical confirmation would be more plausible for species for which demographic information is available for a large number of years, e.g. Arisaema triphyllum (Bierzychudek Reference BIERZYCHUDEK1999), or Calathea ovandensis (Horvitz & Schemske Reference HORVITZ and SCHEMSKE1995).
The results of this study have important consequences, since elasticity analysis has commonly been used as a tool for decision-making in conservation and management (Contreras & Valverde Reference CONTRERAS and VALVERDE2002, Hernández-Apolinar et al. Reference HERNÁNDEZ-APOLINAR, VALVERDE and PURATA2006, Menges Reference MENGES2000, Olmsted & Álvarez-Buylla Reference OLMSTED and ÁLVAREZ-BUYLLA1995, Valverde et al. Reference VALVERDE, HERNÁNDEZ-APOLINAR and MENDOZA-AMARO2006, Zuidema Reference ZUIDEMA2000). However, as previously suggested by other authors (de Kroon et al. Reference DE KROON, VAN GROENENDAEL and EHRLÉN2000) it may not be the most suitable tool for identifying the actual life-cycle stages and vital rates that may cause important variation in λ. Although alternative methods have been used to address this issue (e.g. retrospective perturbation analysis; Martínez-Ballesté et al. Reference MARTÍNEZ-BALLESTÉ, MARTORELL, MARTÍNEZ-RAMOS and CABALLERO2005, Pulido et al. Reference PULIDO, VALVERDE and CABALLERO2007), they are based on several matrices corresponding to several sites and/or years. It is certainly desirable to sample the actual demographic variation if we are to understand the population biology of a plant species in greater depth. However, the time needed for such analyses and the costs involved are frequently unfeasible. Consequently, VSPA has the potential to be a very useful tool to deal with this type of situation. In the case of the M. zapota population, conservation and management efforts should focus on the sapling and juvenile life-cycle stages. To fully understand the demography of this population, it would be important to clarify what ecological processes (e.g. climatic variation, disturbances, cattle ranching, among others) cause variation in the survival and growth of these stages.
ACKNOWLEDGEMENTS
This research was funded by a Consejo Nacional de Ciencia y Tecnología (CONACYT) grant to L. López-Mata (CP-CONACYT 0443P-N). The first author thanks CONACYT for supporting his doctoral program with a 3-y scholarship. L. López-Mata acknowledges CONACYT support for the one-year sabbatical leave which made it possible to finish this paper. We are grateful to Mrs Esther Hernández Ochoa and Bernardo Vega Hernández, owners of the Santa Gertrudis land, for their facilities given while conducting this research. We thank Oliva Godinez-Ibarra, Tomás Carmona and Segundo Zarate for their help during field work and data collection. We also thank two anonymous reviewers whose corrections and constructive comments provided important insights to improve this manuscript. The Comisión Nacional del Agua provided the updated rainfall data.