NOMENCLATURE
- ABP
Achieve-by-Point
- AEM
Arrival Expedition Margin
- AP
Action Point
- APC
Preselected Action Point Set
- APD
Action Point Distance
- APM
Action Point Modification Set
- ASPA
Airborne Spacing
- ASTAR
Airborne Spacing for Terminal Arrival Routes
- BADA
Base of Aircraft Data
- CAS
Calibrated Airspeed
- CCS
Constant CAS Segment
- DTG
Distance-To-Go
- ETA
Estimated Time of Arrival
- FIM
Flight-deck Interval Management
- ft
Feet
- GUI
Graphical User Interface
- HITL
Human-in-the-Loop
- IM
Interval Management
- kt
Knots
- MOPS
Minimal Operation Performance Standards
- NM
Nautical Miles
- RPD
Reference Profile Deviation
- RSE, e()*
Remaining Spacing Error
- RTA
Required Time of Arrival
- SD
Standard Deviation
- SP
Speed Planning
- TBO
Trajectory Based Operation
- TGT
Target
- TTF
Traffic-To-Follow
- TTG
Time-To-Go
- TTR
Time-To-React
- A
Amplification Factor
- c x
Constants
- d x
Distances
- D(t)
Damping Function
- e(t)
Spacing Error
- e x
Error Thresholds
- i
Modification Intervals
- q x
Weight Factors
- r
Modification Ranges
- s x
Individual Score
- S x
Final Score
1.0 INTRODUCTION
Continuously growing demand in air travel(1) is creating new challenges for aircraft operators, airports and air navigation service providers worldwide. In order to overcome these challenges, international(2) and local initiatives such as NextGEN (USA)(3), SESAR (Europe)(4) or CARATS (Japan)(5) have been created, and they call for sophisticated solutions to improve air travel efficiency.
One common working task targets the improvement of Airborne Spacing Interval Management (ASPA-IM) to optimise the spacing between aircraft. Historically, air traffic controllers have been responsible for ensuring that aircraft flying under instrument flight rules maintain sufficient spacing to meet or exceed separation requirements. While tools like a Traffic Management Advisor(Reference Baxley, Johnson, Scardina and Shay6) can support air traffic controllers to improve spacing accuracy between aircraft, communication latency and other delaying factors limit the capability of ground-based Interval Management systems. Therefore, the concept of managing the spacing between the aircraft via air-to-air communication, called Flight-deck Interval Management (FIM), emerged to improve aircraft spacing(Reference Bone and Mendolia7).
Leading research on FIM has been conducted by the National Aeronautics and Space Administration (NASA), who invented Airborne Spacing for Terminal Arrival Routes (ASTAR)(Reference Abbott8,Reference Abbott9) , the most commonly known logic for FIM, which also influenced the development of the Minimal Operation Performance Standard (MOPS) for FIM(10,11) . Further research, partially based on ASTAR, was conducted by the MITRE Corporation(Reference Weitz and Swieringa12,Reference Bai and Weitz13) , the Netherlands Aerospace Centre (NLR)(Reference Bussink, van der Laan and de Jong14,Reference de Gelder, Bussink, Knapen and ‘t Veld15) and the Electronic Navigation Research Institute (ENRI) in Japan(Reference Itoh and Uejima16–Reference Riedel22).
NASA’s research on ASTAR was concluded in early 2017 with a final flight test(Reference Swieringa, Wilson, Baxley, Roper, Abbott, Levitt and Scharl23–Reference Baxley, Swieringa, Roper, Hubbs, Goess and Shay25). While sophisticated spacing capability of FIM could be confirmed, pilots’ comments highlighted the operational difficulties such as ‘too many IM speed changes, or the rate of the speed changes is too high’(Reference Baxley, Swieringa, Wilson, Roper, Hubbs, Goess and Shay24), and the crew had ‘no fore-knowledge of when or what the next IM speed would be’ and ‘could only be reactive’. In its ‘Recommended changes to Interval Management to Achieve Operational Implementation’(Reference Baxley, Swieringa, Roper, Hubbs, Goess and Shay25), NASA concludes that ‘improvements to the IM commanded speed behaviour is needed before implementation’ and further recommends to ‘explore alternative control law techniques to allow for trade-offs between spacing error and IM speed change behaviour to reduce the rate of speed changes and speed reversals’ (i.e. a speed increase after a deceleration).
In this paper, an original speed-planning control concept, which modifies the aircraft’s speed schedule instead of issuing instant speed commands, is introduced. The complexity of this method does not originate from only finding an error or speed command optimised profile but a suitable one from a pool of many under operational aspects and with consideration for future upcoming changes. A two-stepped rule-based selection method was developed based on the results of the flight tests. The method was benchmarked against ASTAR and expected to improve speed commands and crew awareness, while providing adequate spacing performance.
The remainder of this paper is structured as follows: First, an overview of the proposed concepts and the working mechanism in contrast to ASTAR are presented, followed by a description of the simulation environment and settings used to evaluate the system’s behaviour. Next, the simulation results are presented to compare the behaviour of ASTAR to the new concept, and the results are discussed in detail. Finally, an overview of future tasks and objectives recommended for follow-up research on FIM and the proposed logic are presented, and the paper is concluded.
2.0 SYSTEM DESCRIPTION
2.1 ASTAR
ASTAR corrects a potential spacing error by issuing speed advisories to change the current calibrated airspeed (CAS) based on a feedforward logic. In its latest (seventh) revision(Reference Abbott8), ASTAR offers two operational modes: a trajectory-based operation (TBO) mode for traffic on merging paths and a constant time delay mode for traffic on the same path. The TBO logic, which is examined in this study, consists of a spacing error-based term and a ground speed compensation portion. Gain parameters for the logic include the FIM aircraft’s (‘ownship’, OWN) and leading aircraft’s (‘traffic-to-follow’, TTF) remaining flight time (time-to-go, TTG) and distance (distance-to-go, DTG) to a set point, called the achieve-by-point (ABP). The ground speed compensation also includes the TTF’s ground speed. A complete description of the control block and additional functions can be found in Ref. (Reference Abbott8).
Using the ownship’s and TTF’s TTG at time t and nominal spacing time Δ, the spacing error e(t) can be calculated as:
 \begin{equation} e(t)={TTG}_{{\rm OWN}}(t)-({TTG}_{{\rm TTF}}(t)\,{+}\Delta )\end{equation}
By adding the current time, the spacing error can also be expressed by the estimated time of arrival (ETA):
 \begin{gather} ETA(t)=TTG(t)+Current\ Time(t)\end{gather}
 \begin{gather} e(t)={ETA}_{OWN}(t)-({ETA}_{TTF}(t)\,{+}\Delta )\end{gather}
Further, the TTF’s ETA and the nominal spacing time can be combined into the required time of arrival (RTA),
 \begin{equation} RTA(t)={ETA}_{TTF}(t)\,{+}\Delta\end{equation}
so that the error term can be simplified to the following:
 \begin{equation} e(t)={ETA}_{OWN}(t)-RTA(t).\end{equation}
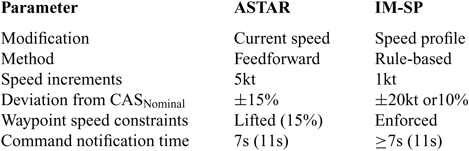
A positive spacing error indicates a late arrival, with the need to expedite, and a negative spacing indicates the opposite. Based on the spacing error, ASTAR issues a speed command, limited to within 15% of the ownship’s nominal speed, i.e., the planned speed as stored in the flight management system. While the original design of ASTAR was aimed for full interconnection with the autopilot and autothrottle, the design changed to a manually operated, federated system, which requires pilots to input the recommended speed into the autopilot’s mode control panel. Therefore, speed commands are issued in 5kt or 10kt intervals to avoid constant manipulation. Speed commands are expected to take effect within 11seconds of being issued (‘7seconds for Flight Crew delay […], 3seconds for aircraft response […], and 1second for latency’)(10) and require the crew to react to a speed change on a short notice.
2.2 Working principle of the proposed concept
The proposed concept, given the interim name of Interval Management-Speed Planning (IM-SP), analyses the entire remaining speed profile to modify mostly the planned speed changes. By considering the entire remaining profile, the IM-SP concept is designed to not increase the number of speed changes the flight crew receives, thereby not increasing their workload as was observed in the flight test using the ASTAR algorithm. Furthermore, the likelihood of speed reversals should be reduced. This IM-SP concept, however, requires new strategies to calculate the effect of speed plan modifications and take appropriate action. For a better understanding of this concept, some modification principles are explained before presenting the algorithm.
2.3 Action points
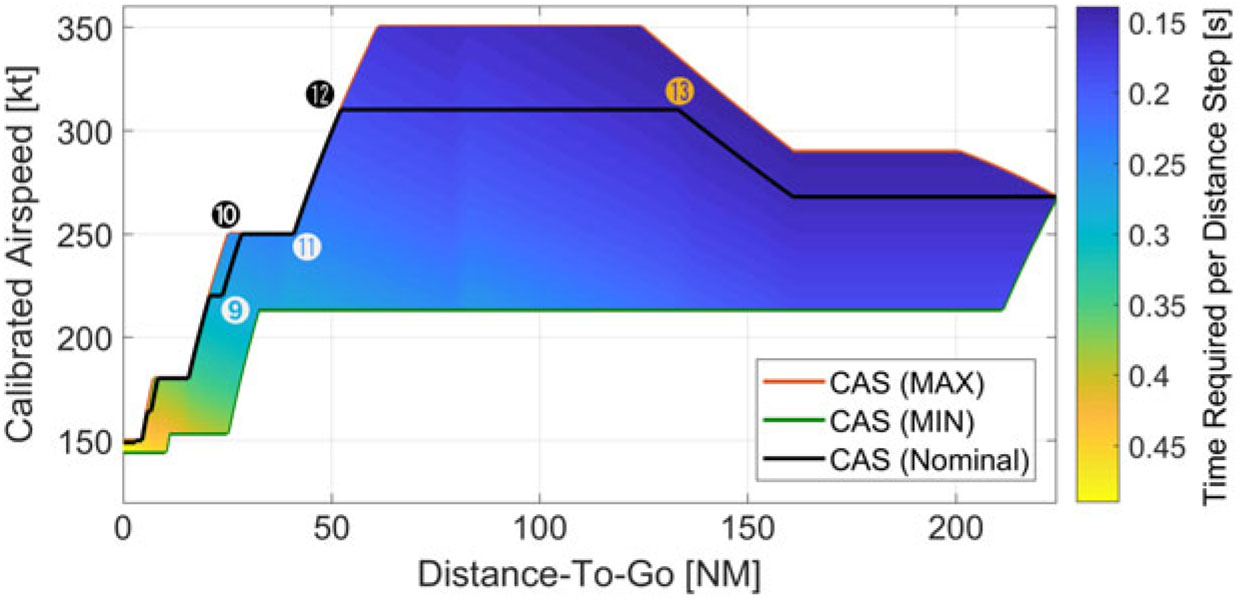
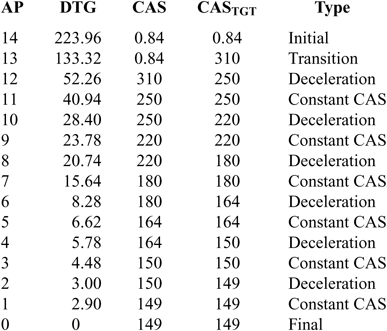
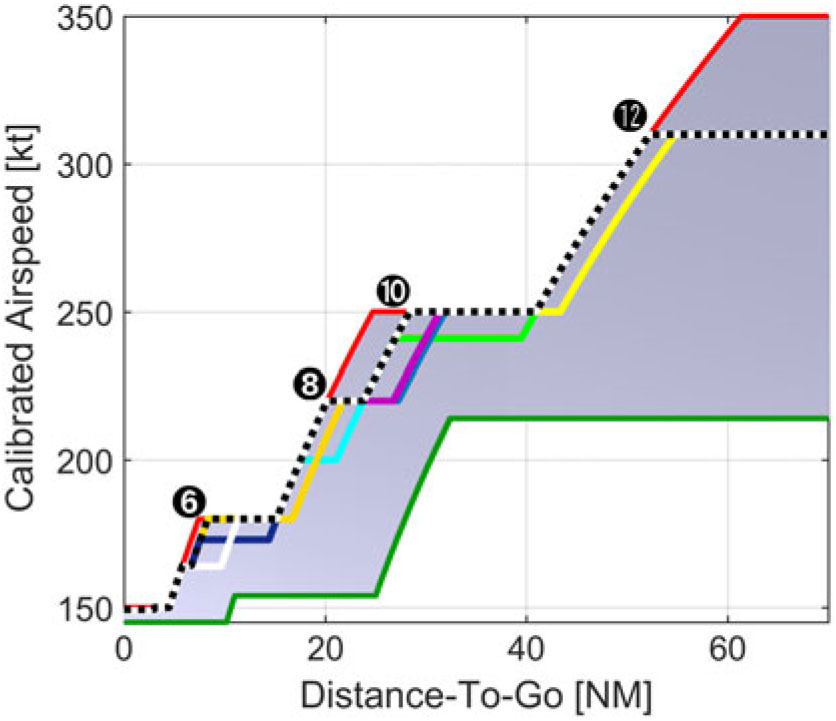
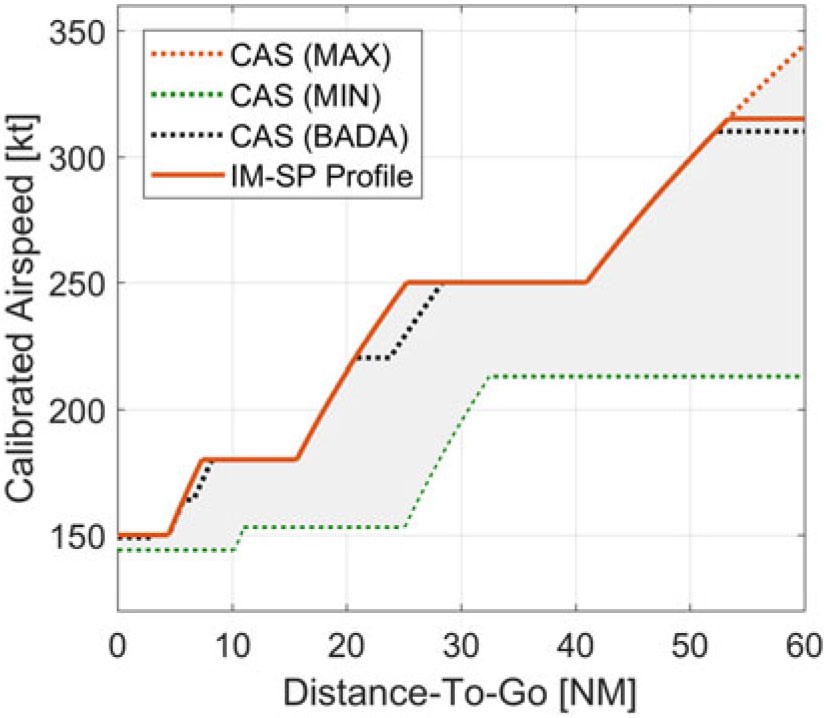
Every point significant to the aircraft’s speed profile is referred to as an Action Point (AP). These points mark the beginning or the end of a speed change, or conversely, the end or the beginning of a constant CAS segment (CCS), the Mach/CAS transition and the initial and final speed. APs are defined by their DTG, CAS, target CAS (CASTGT) and type. Figure 1 shows the reference speed profile with some APs marked for illustration. The corresponding list of all APs is presented in Table 1. The APs concisely describe the aircraft’s speed profile and its modifications. Individual APs are identified by a superscript (e.g. the eighth AP is written as AP8) and modifications are identified by a subscript (e.g. a CASTGT decreased by 10kt is written as APCAS-10).
BADA reference profile and speed envelope for a Boeing 787-8. The colour (shading) of the speed envelope indicates the time required t req per distance step d Step of 0.02NM in seconds.

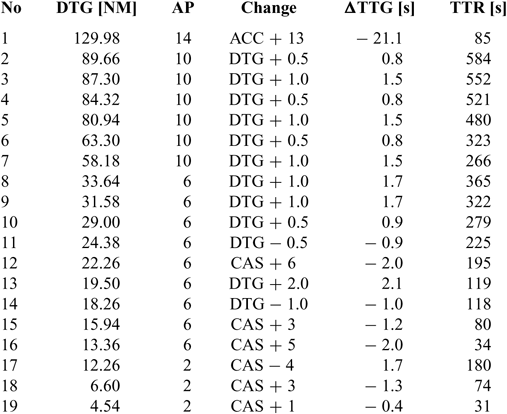
List of all action points for the reference profile

2.4 Planned speed changes
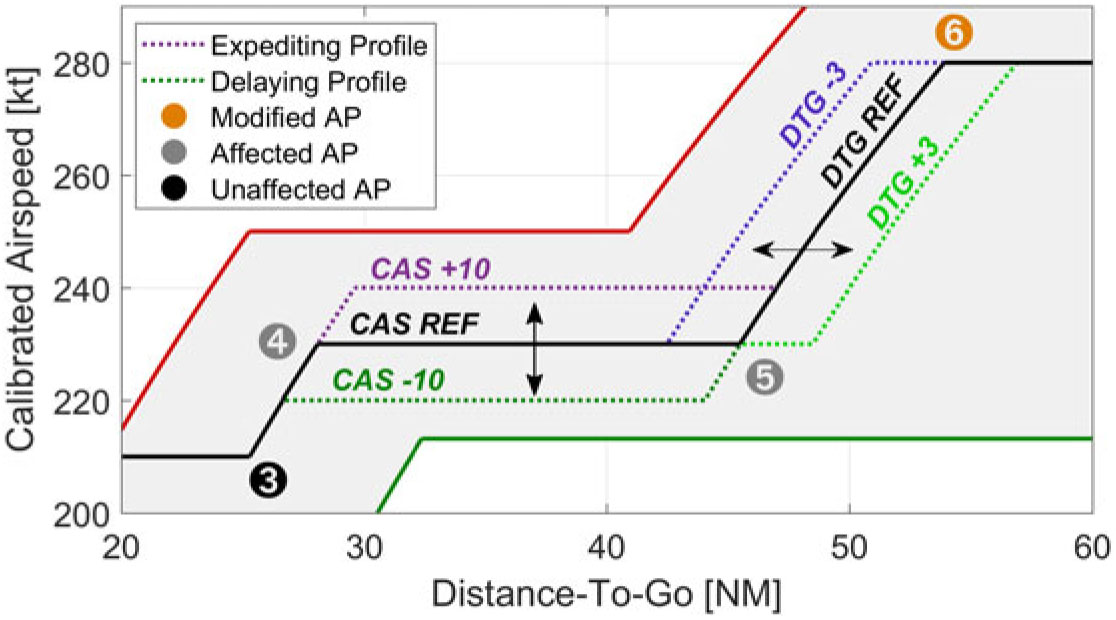
Figure 2 shows the basic principle of the modifications made to the planned speed changes or existing APs. CASTGT modifications alter the target speed, i.e., the speed of the next segment after deceleration, and are calculated in the interval of i CAS (here: 1kt) within the range r CAS (20kt) but not outside the envelope. For example, a CASTGT of 160kt and minimum CAS of 153.4kt would allow a modification down to 154kt. Further, the new CASTGT cannot assume speeds higher than the previous or lower than the following CCS.
Basic principle for modifications made to planned speed changes (existing APs). Here, AP6 is modified, thus affecting AP5 for a DTG change, or both AP5 and AP4 for a CASTGT change.

DTG modifications change the initiation point of a speed change in the range r DTG (5nautical miles, NM) and interval i DTG (0.5NM). If a speed constraint requires a deceleration to commence within r DTG, in addition to all distances in the interval i DTG, the latest possible deceleration is also considered. For example, if a deceleration can be delayed by a maximum of 0.8NM, delays of 0.5NM and 0.8NM are both considered.
2.5 Additional speed changes
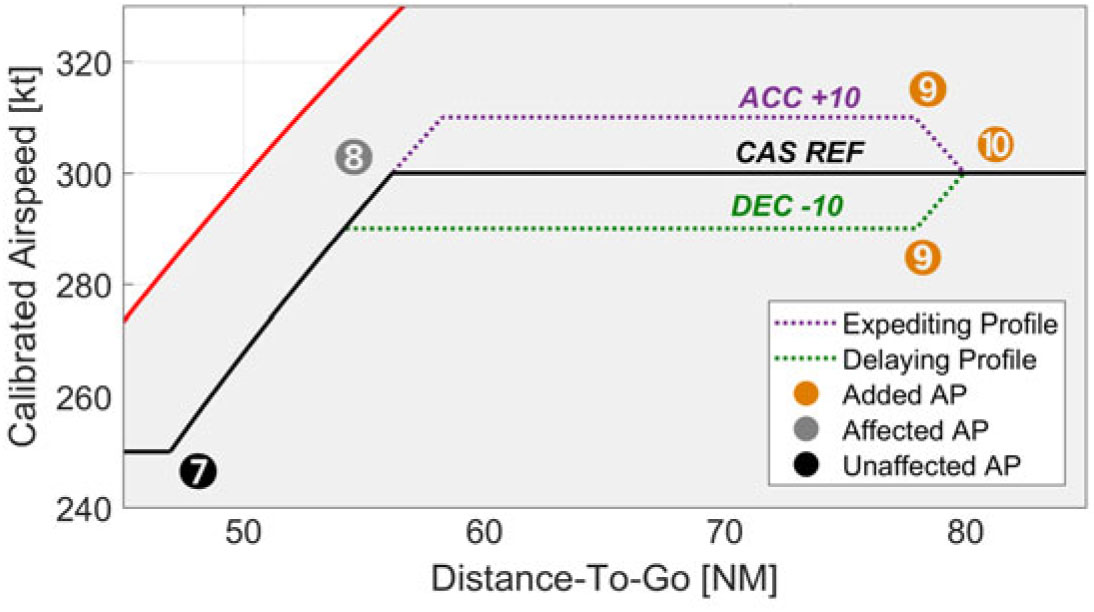
Figure 3 shows the principle of unplanned (additional) speed changes, which modify the speed segment the airplane is on or approaching to (if currently executing a speed change). Depending on the spacing error’s sign, the change can either be an acceleration or deceleration. In both cases, the target speed of the inserted speed change is maintained until the next planned speed change, or until a constraint requires leaving the new speed. Accelerations are calculated up to +10% of the current reference speed and are only considered if the new target speed can be maintained for approximately 60s (5NM) or longer, consistent with the recommendations of Refs. (Reference Swieringa, Wilson, Baxley, Roper, Abbott, Levitt and Scharl23–Reference Baxley, Swieringa, Roper, Hubbs, Goess and Shay25).
Basic principle for unplanned speed changes (added APs). These changes always continue into the next deceleration stage; thus, here, AP10 and AP9 are added and AP8 is affected.

2.6 Time required map
To estimate the effect of a speed schedule modification on the ETA, a time required map is calculated based on the aircraft’s selected route and vertical profile, covering the aircraft’s speed envelope and extending from the point of initiation to the ABP. The map contains the required travel time for a set uniform distance (d Step, here: 0.02NM) at each achievable airspeed in the interval of CAS Step (1kt). The envelope borders are given by a combination of aircraft type-dependent limitations, waypoint constraints and legal limitations (e.g. 250kt below 10,000ft). The travel time (t req) for a single distance step is determined from the ground speed, which is calculated from wind (forecast) data and the true airspeed (TAS), defined in terms of the CAS corrected for (standard) atmospheric conditions This map serves as a look-up table for the calculation of alternative speed profiles.
2.7 Multiple solutions
Based on the functional principle of IM-SP, multiple solutions can exist for a given error. Figure 4 shows an example for an error of −5s and all alternative profiles that result in a new spacing error of less than ±0.5s. Therefore, these profiles must be analysed for attributes other than time to determine the most appropriate modification.
Multiple solution problem for a spacing error of −5s. Each (coloured) line indicates a different speed profile that can reduce the spacing error to ±0.5s.

3.0 SELECTION ALGORITHM
IM-SP selects profile modifications in a multistep rule-based process, which includes a time-based preselection and an attribute-based cost function. The basic flow of its algorithm is shown in Fig. 5. The corresponding pseudo-code is also shown below.
Selection stages and flow of IM-SP.

The proposed selection algorithm

3.1 Time-based preselection
In the first step, all profile modifications that are achievable at the time of the calculation are computed, and the resulting ETA for each modification, revealing the remaining spacing error (Equation 6) for the current RTA, is computed and stored in the Action Point Modification (APM) dataset.
 \begin{align} {e({AP}^{j}_{Chg},t)}^{{\rm *}}=ETA({AP}^{j}_{Chg},t)-RTA(t)\end{align}
For the preselection, all modifications for which
 ${e({AP}^{j}_{Chg},t)}^*\ $
is smaller than the error threshold (e Thres) are copied to a second dataset, the Preselected Action Point Set (APC).
 \begin{align} APC=\left\{AP\in APM\mathrel{\left|\vphantom{AP\in APM \left|{e({AP}^{j}_{Chg},t)}^{{\rm *}}\right|\le {\rm \ }e_{Thres}}\right.}\left|{e({AP}^{j}_{Chg},t)}^{{\rm *}}\right|\le {\rm \ }e_{Thres}\right\}\end{align}
If APC has no elements, because no modification can reduce the error term to e Thres or below, APC is extended to include the modification with the lowest remaining error (APmin,t) term and all candidates with an ETA within e Thres of APmin.
 \begin{align} APC=\Big\{AP\in APM\mathrel{\Big|\vphantom{AP\in APM \Big|\Big[{e({AP}^{j}_{Chg},t)}^{{\rm *}}-{e({AP}_{min},t)}^{{\rm *}}\Big]\Big|\le {\rm \ }e_{Thres}}\Big.}\Big|\Big[{e({AP}^{j}_{Chg},t)}^{{\rm *}}-{e({AP}_{min},t)}^{{\rm *}}\Big]\Big|\le {\rm \ }e_{Thres}\Big\}{\rm \ }\end{align}
All elements of APC are then processed to the cost function.
3.2 Cost function
The cost function is composed of a normalised scoring portion and an additional penalty portion. In this study, two scoring attributes and three penalty attributes, influenced by the results of Refs. (Reference Swieringa, Wilson, Baxley, Roper, Abbott, Levitt and Scharl23–Reference Baxley, Swieringa, Roper, Hubbs, Goess and Shay25), were employed. The final score (S) is determined from the sum of all individual scores (s k) multiplied by an optional corresponding weight factor (q k).
 \begin{equation} S\big({AP}^{j}_{Chg}\big)=\sum\nolimits_{k=0}^n{s_k\cdot q_k}\end{equation}
Then, the candidate with the lowest score, min(S(
 ${AP}^{j}_{Chg}$
)), is selected. All individual scores are normalised such that 0 expresses the best, and 1 refers to the worst score. Due to the penalty portion, the final score S can be higher than 1.
3.3 Attributes
3.3.1 Arrival Expedition Margin s AEM
The Arrival Expedition Margin (AEM) is introduced to indicate how much additional (positive) error the system is able to cope with, i.e. how much earlier the aircraft could potentially arrive, after a modification was made. Conversely it expresses how close the aircraft must fly to the maximum allowable speed to meet the assigned spacing interval.
The closer the required speed is to the maximum speed, the greater the likelihood of unexpected events or sources of error causing the aircraft to exceed the allowed spacing goal is this term is used to imply the probability of failure to meet the spacing goal.
Its absolute value is calculated by comparing the TTG of the fastest profile with that of the actual speed profile at the point of modification:
 \begin{equation}{AEM}_{{\rm ABS}}\big({AP}^{j}_{Chg}\big)={TTG}_{{\rm Fastest}}\big({AP}^{j}_{Chg}\big)-TTG\big({AP}^{j}_{Chg}\big)\end{equation}
If the current profile is already the fastest profile, the AEM will be 0, meaning no further positive error can be compensated; otherwise, the AEM will be negative.
As earlier changes naturally allow for a higher AEM, the relative value is expressed in relation to the DTG.
 \begin{equation} {AEM}_{{\rm DTG}}\big({AP}^{j}_{Chg}\big)=\frac{{AEM}_{{\rm ABS}}\big({AP}^{j}_{Chg}\big)}{DTG\big({AP}^{j}_{Chg}\big)}\end{equation}
The AEM score (s AEM) is determined by normalising it over all preselected candidates.
 \begin{equation} s_{{\rm AEM}}\big({AP}^{j}_{Chg}\big)=\frac{{AEM}_{{\rm DTG}}\big({AP}^{j}_{Chg}\big)-{AEM}_{{\rm DTG,min}}}{{AEM}_{{\rm DTG,max}}-{AEM}_{{\rm DTG,min}}}\end{equation}
3.3.2 Time-to-Go (s TTG)
The second evaluation parameter is the TTG at which the modified AP is executed. In general, a later TTG allows for more time between the time the modification is determined and the time it becomes effective. Particularly at the early stages of FIM operation, i.e., high TTG and DTG, higher variations in the spacing error are expected, reducing the need for (possibly counterproductive) immediate actions. In ASTAR, a DTG-dependent gain parameter (g1) was employed to suppress the system response at high DTGs.
In IM-SP, later modifications with a high lead time are linearly rewarded to a predefined TTG before the ABP (TTG TGT):
 \begin{equation} s_{{\rm TTG}}\big({AP}^{j}_{Chg}\big)=\left\{ \begin{array}{c}\frac{TTG\big({AP}^{j}_{Chg}\big)-{TTG}_{{\rm TGT}}}{TTG(Current{\rm \ }Position)}{\rm ,\ \ }TTG\big({AP}^{j}_{Chg}\big)\ge {TTG}_{{\rm TGT}} \\ \frac{{TTG}_{{\rm TGT}}-TTG\big({AP}^{j}_{Chg}\big)}{{TTG}_{{\rm TGT}}}{\rm ,\ \ }else \end{array}\right.\end{equation}
A change that occurs at TTG TGT would therefore take a value of 0, and an immediate change would take a value close to 1. Here, TTG TGT was set to 60s to inhibit the speed changes close to the ABP and give the crew sufficient time between the last command and the FIM mode change or termination.
3.3.3 Time-to-React (s TTR)
The Time-to-React (TTR) is a penalty, which is similar to s TTG, to avoid modifications with short notification times and to overcome the lack of ‘fore-knowledge’, as mentioned in Refs. (Reference Baxley, Swieringa, Wilson, Roper, Hubbs, Goess and Shay24) and (Reference Baxley, Swieringa, Roper, Hubbs, Goess and Shay25). In IM-SP, the 11s period used in ASTAR and MOPS-FIM is the lowest acceptable time for a speed change. On the contrary, a desired notification time TTR TGT of 60s is defined. Excluding the 1s latency, profile modifications with a TTR smaller than TTR TGT are penalised as follows:
 \begin{equation} s_{{\rm TTR}}\big({AP}^{j}_{Chg}\big)=\left\{ \begin{array}{c}\frac{{TTR}_{{\rm TGT}}-TTR\big({AP}^{j}_{Chg}\big)}{{TTR}_{{\rm TGT}}- {\rm 10s}}{\rm ,\ \ }10~s \lt TTR\big({AP}^{j}_{Chg}\big)<{TTR}_{{\rm TGT}} \\ {\rm 0,\ \ }TTR\big({AP}^{j}_{Chg}\big)\ge {TTR}_{{\rm TGT}} \end{array}\right.\end{equation}
Hence, an immediate speed change would have a score of 1, and a speed change that occurs after TTRTGT would have a score of 0.
3.3.4 AP Distance (s APD)
With respect to the comment that ‘FIM speed commands are too frequent’(Reference Baxley, Swieringa, Wilson, Roper, Hubbs, Goess and Shay24), a modification that would put two speed changes closer than the predefined threshold d APThres (here, 5NM) also receives a penalty. Otherwise, no penalty is enforced. The penalty increases with proximity to the next or previous AP; whichever is closer.
 \begin{equation}s_{{\rm APD}}\big({AP}^{j}_{Chg}\big)=\frac{d_{{\rm APThres}}-{\min \left(d_{{\rm NextAP}}\big({AP}^{j}_{Chg}\big),d_{{\rm PrevAP}}\big({AP}^{j}_{Chg}\big)\right)\ }}{d_{{\rm APThres}}}\end{equation}
3.3.5 AP Type (s Type)
The modification type is also imposed with a score to benefit the modifications made to the existing speed changes and reduce the amount of additional commands or acceleration. Modifications that add an additional deceleration have a score of 0.5. Additional accelerations have a score of 1. All other changes, including those that modify previously added APs, have a score of 0.
3.4 Additional profile improvement functions
After modification, the profile is analysed for consecutive or neighbouring speed changes. If two APs, one marking the end of a speed change and one the beginning of another, have the same DTG and CAS values, they are combined into one consecutive speed change. A similar procedure is applied to neighbouring changes; i.e., two changes for which the time between the end of the first speed change and the beginning of the next is very small (here, < 5s). In this case, one single speed change is sought and used to replace the two changes, provided that the combination does not change the error by more than 0.5s.
3.5 System initiation and continuous operation
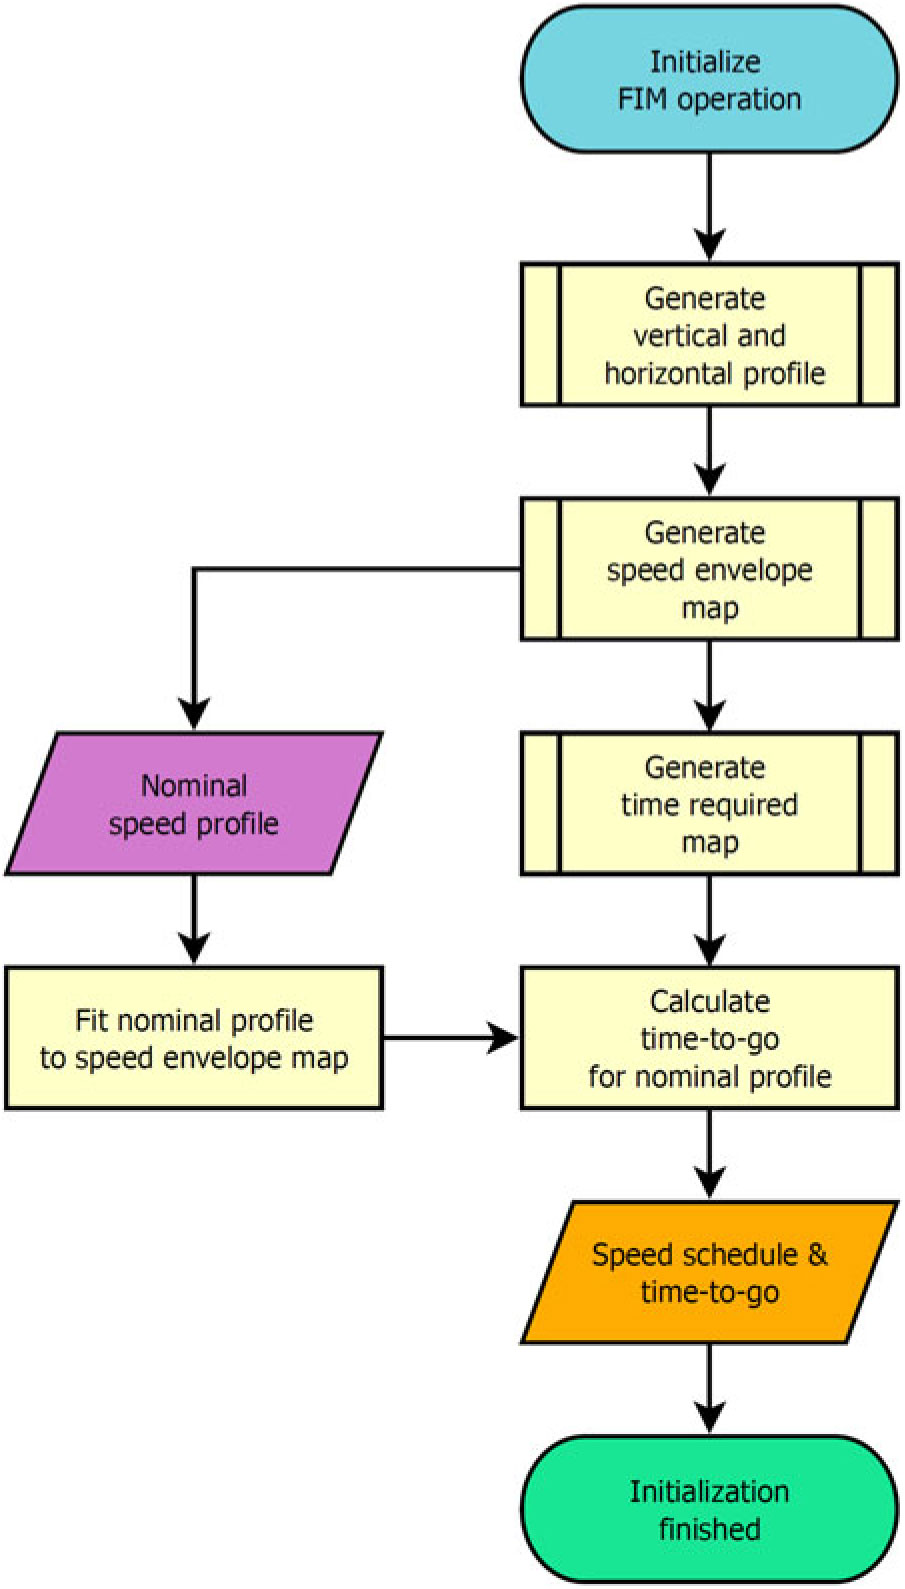
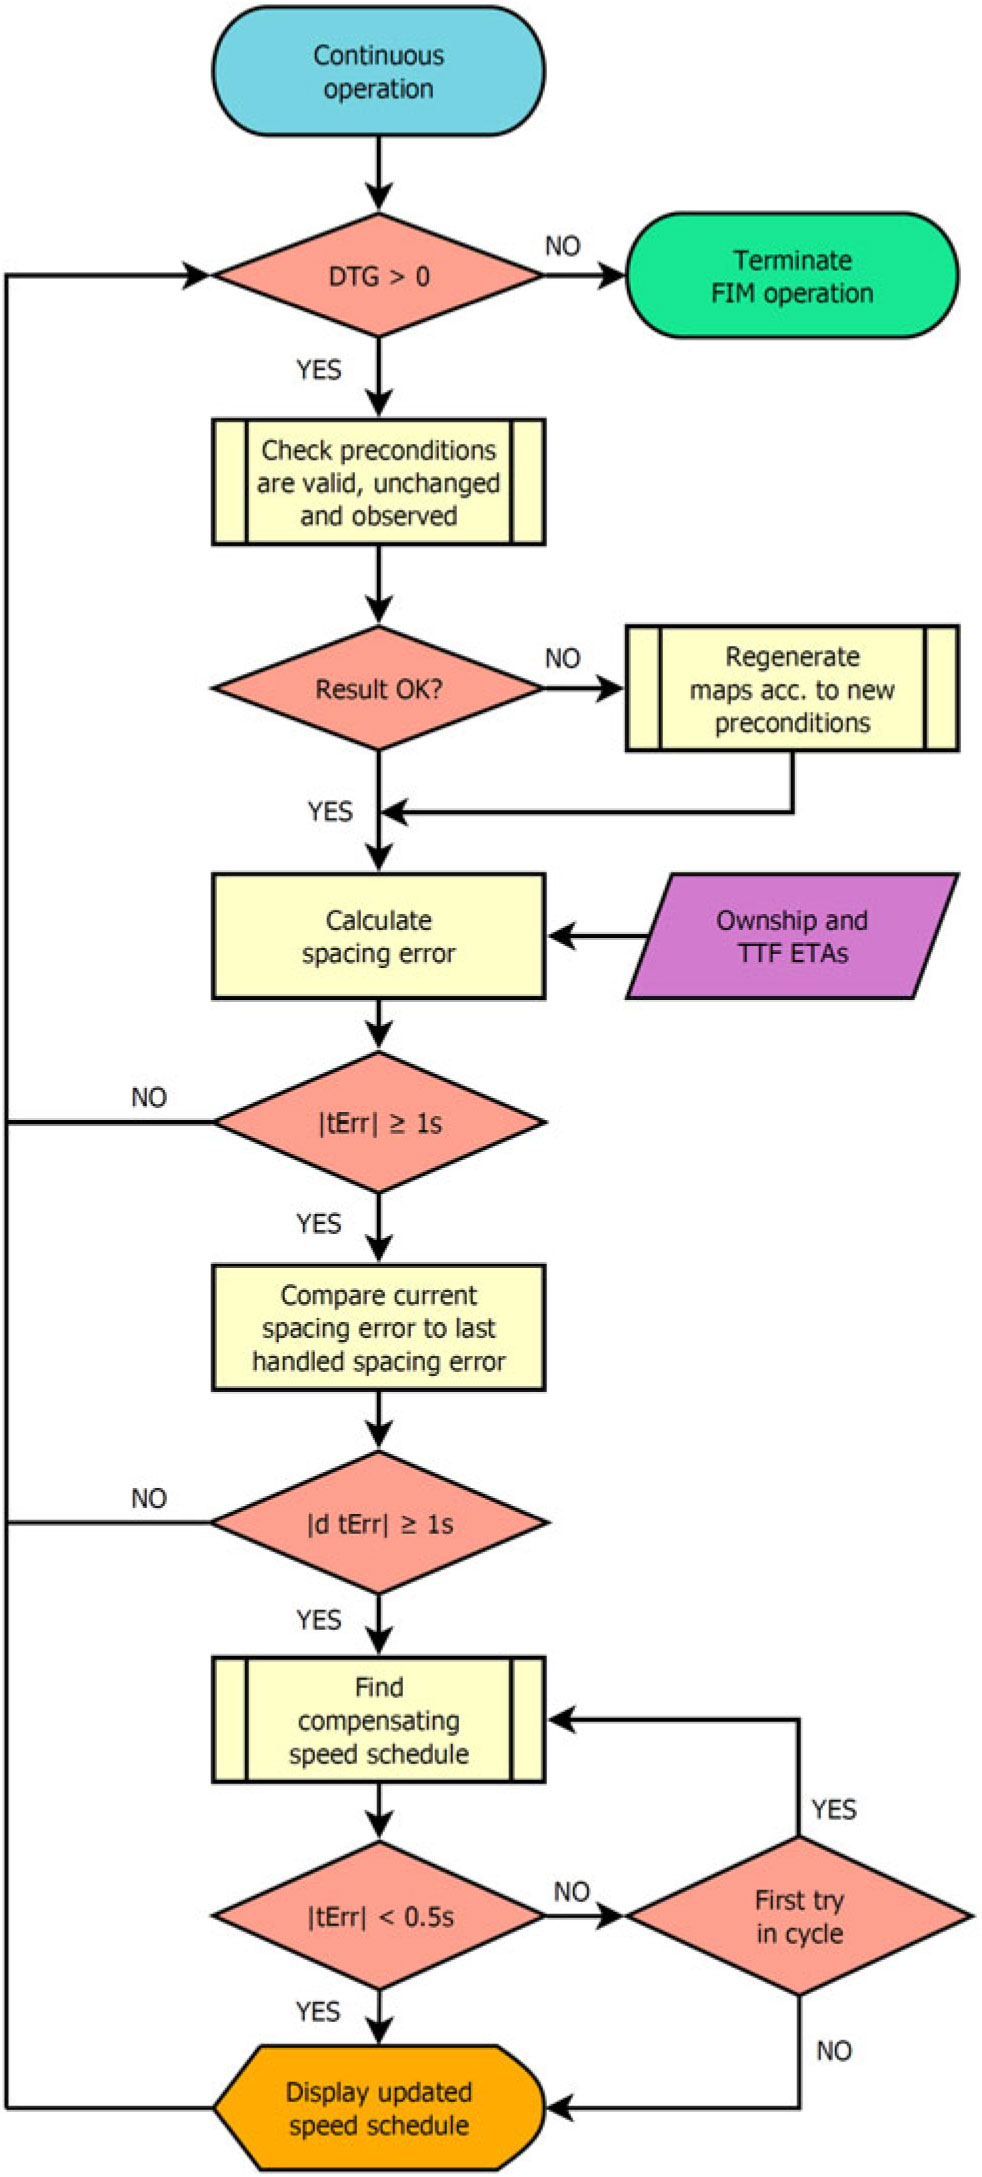
Upon activation, the time required map and APs for the current speed profile are calculated, and the continuous operation mode is entered. Flow diagrams are shown in Figs. 6 and 7. During continuous operation, the spacing error is constantly monitored. If the absolute error is greater than the modification threshold e Modify of 1s and has changed by more than 1s since last managed, the modification process is started, and the speed profile is re-planned. The latter condition is implemented to prevent the system from permanent activation, in case the error can no longer be reduced below e Modify.
Flowchart for IM-SP initiation procedures.

Flowchart for IM-SP continuous operation mode.

In one cycle, a single modification is expected to reduce the absolute error below 0.5s, identical to e Thres for APC. If this value is higher, i.e., e Thres was extended, the modification algorithm is evoked one more time within the same cycle including the previous modification. Finally, the new speed profile is displayed to the pilots.
4.0 SIMULATION SETUP
4.1 Calculation model
All aircraft model-related calculations in this study were performed based on the EUROCONTROL BADA Model, Version 3.12(26). The aircraft was regarded as a point mass. Further calculations were calculated based on MOPS-FIM(10). For calculations involving the thrust, the BADA Total Energy Model was used. The Energy Share Factor was not used. For acceleration, the CAS acceleration rate a CAS is assumed to be either the actual available acceleration, derived from the total energy model, or a value of 0.5kt/s, according to MOPS-FIM; whichever is lower. For deceleration, a constant deceleration factor of -0.5kt/s was set. When idle thrust does not provide sufficient drag, the use of speed brakes for the minimum time required to achieve the desired deceleration rate is assumed.
4.2 Horizontal path
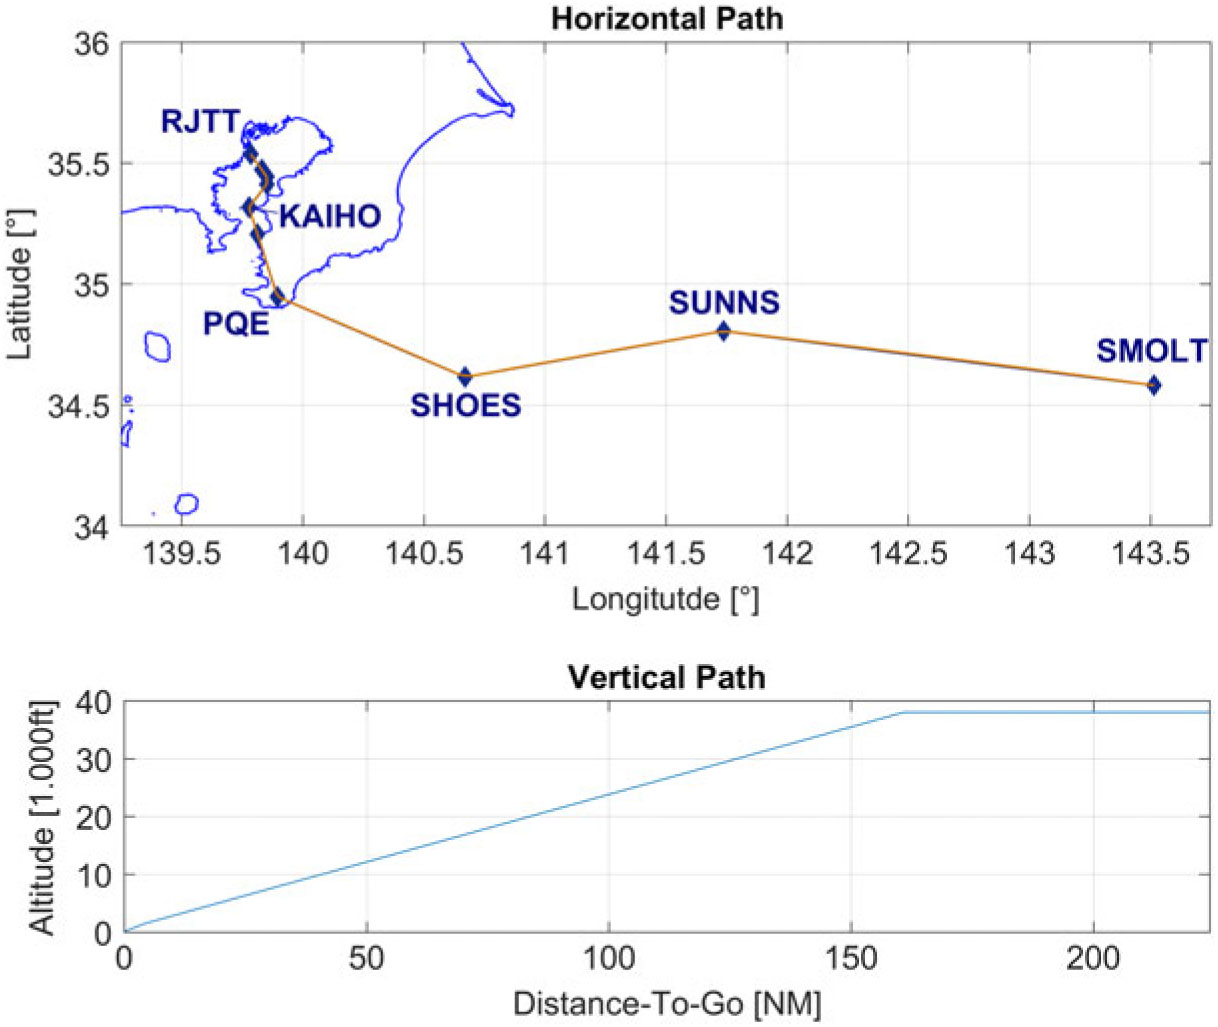
The route starts at Waypoint SMOLT and continues via SUNNS, SHOES, PQE, UMUKI and KAIHO to the ILS X(27) arrival towards runway 34L of Tokyo International Airport (RJTT) (Fig. 8). The total route has a length of 224NM. Speed constraints are applied at PQE (250kt), KAIHO (180kt) and from the final approach fix, AZURE (150kt).
Ownship horizontal and vertical routing.

4.3 Vertical profile
The vertical profile for all runs is initialised at 38,000ft (FL380). From top of descent until capturing the −3.0-degree glideslope, a continuous descent approach with a fixed geometrical flight path angle of −2.2degrees(Reference Itoh, Fukushima, Hirabayashi, Wickramasinghe and Toratani18,Reference Itoh, Wickramasinghe, Hirabayashi and Fukushima28) was used, as shown in Fig. 8. The altitudes defined by this geometrical flight path were used in lieu of the published waypoint crossing altitudes.
4.4 Aircraft
The aircraft used to define the ownship’s and TTF’s speed profile (see Fig. 1), deceleration rate, fuel consumption and wake category was a Boeing 787-8 aircraft at reference mass. This generated a nominal speed profile with 6 planned speed changes, 2,146.8s (35min 46.8s) of flight time, 393.3s (6min 33.3s) of speed brakes required, 1,600.4kg of fuel consumed and 100s nominal spacing (equivalent to 4NM at runway threshold(29)).
4.5 Wind
In this simulation, actual wind data, taken on 15 September 2013 at 12:00 UTC, were used and standard atmospheric conditions were assumed.
4.6 ASTAR
The ASTAR TBO logic was implemented in its latest version (13), as described in Ref. (Reference Abbott8), including the ground speed compensation. Speed commands become active 11s after the announcement with the speed quantisation fixed at 5kt. The roll-in logic was not used.
As the reference profile in Fig. 1 operates close to the upper speed limit and partially prohibits ASTAR from issuing higher speed commands, two versions were calculated for a better comparison: a standard version, which increases waypoint or altitude given speed constraints, here including the 250kt below 10,000ft rule, by 15% (to allow for the intended speed tolerance of ASTAR), and a limited version, which strictly enforces all speed constraints (as they apply to IM-SP).
4.7 IM-SP
Weight factors for IM-SP are set as in Table 1. Scoring parameter weights q AEM and q TTG are both set to 0.5 to achieve normalisation. The penalty factors are set similar to each other; only q Type, due to its fixed score, is reduced to avoid the inhibition of accelerations by default. The functional differences of IM-SP and ASTAR are again highlighted in Table 3.
Weight factor settings

Overview of significant logic differences

4.8 Spacing error
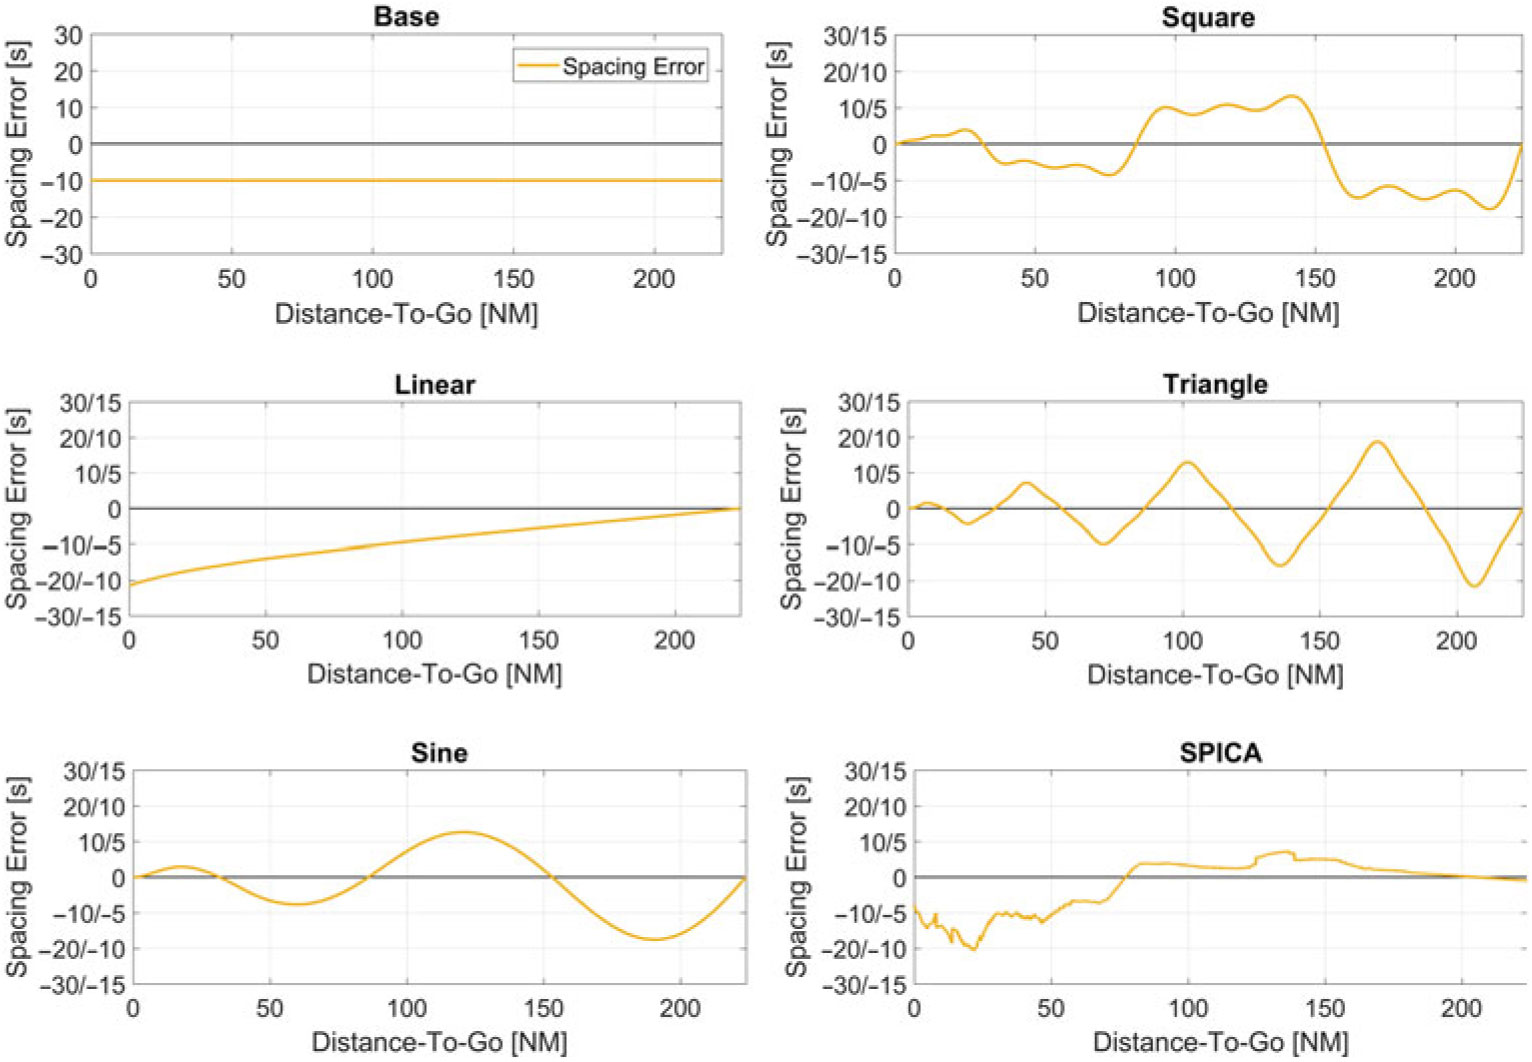
In total, six different error patterns were simulated (Fig. 9). The error patterns were chosen to reflect the characteristics of the spacing error progressions shown in Refs. (Reference Swieringa, Wilson, Baxley, Roper, Abbott, Levitt and Scharl23–Reference Baxley, Swieringa, Roper, Hubbs, Goess and Shay25) and to simulate different types of disturbances. In addition to the artificial patterns, an error pattern taken from the SPICA simulator(Reference Itoh and Uejima16,Reference Itoh, Uejima, Kakichi and Suzuki17,Reference Riedel, Itoh and Takahashi19,Reference Riedel, Itoh, Tatsukawa and Takahashi20) was evaluated. Each pattern was tested with a low and high (double) amplification and an inverted signal of both (four in total).
Induced spacing error patterns.

The base pattern represents a constant, i.e., initial spacing error of −30, −20, −10, 0, 10, 20, 30s. An initial error of 0 would put the aircraft at exactly the nominal spacing (here, 100s) apart. Variations in reference flight time due to different operation characteristics of each logic (e.g. speed increments) were considered at the beginning of the simulation. The seven initial (base) errors were also applied to all other five patterns and their four variations, resulting in 147 cases. The induced spacing error is applied to the TTF, altering its ETA and and consequently the ownship’s RTA, which has to react accordingly. The ownship’s ETA is changed by the behaviour of each logic.
The equations for each induced error are stated below:
 \begin{align} e_{{\rm Base}}(t)=c_0,\end{align}
 \begin{align} e_{{\rm Linear}}(t)=A\cdot c_{{\rm Lin}}\cdot t+c_0,\end{align}
 \begin{align} e_{{\rm Sine}}(t)=A\cdot D(t)\cdot c_{{\rm 1}}\cdot {\sin \left({{\frac{{\rm 4}\pi }{T}}}\cdot t\right)\ }+c_0,\end{align}
 \begin{align} e_{{\rm Square}}(t)=A\cdot D(t)\cdot c_{{\rm 1}}\cdot \sum\nolimits^{2}_{k=0}{\left[{{{\frac{{\rm 1}}{2k+ {\rm 1}}}}\sin \left(\left(2k+ {\rm 1}\right)\cdot {{\frac{{\rm 4}\pi }{T}}}\cdot t\right)\ }\right]}+c_0,\end{align}
 \begin{align} e_{{\rm Triangle}}(t)=A\cdot D(t)\cdot c_{{\rm 1}}\cdot \sum\nolimits^{2}_{k=0}{\left[{{\frac{{\rm 1}}{{\left(2k+ {\rm 1}\right)}^{2}}. }}\cdot {\left(- {\rm 1}\right)}^k\cdot {\sin \left(\left(2k+ {\rm 1}\right)\cdot {{\frac{{\rm 8}\pi }{T}}}\cdot t\right)\ }\right]}+c_0,\end{align}
 \begin{align} e_{{\rm SPICA}}(t)=A\cdot e_{{\rm Data}}(t)+c_0,\end{align}
 \begin{align} {\rm with\ \ \ \ }c_0=\left[- {\rm 30,-20,-10,\ \ 0,\ \ 10,\ \ 20,\ \ 30}\right]\left[s\right]{\rm ,\ }{{\rm \ }c}_{{\rm Lin}}= {\rm 1/200,\ \ }c_{{\rm 1}}= {\rm 10}~{\rm s}\end{align}
 \begin{align} {\rm and\ }A=\left[- {\rm 2,-1,\ \ 1,\ \ 2}\right]{\rm ,\ \ }D(t)=\frac{T-t}{T},T= {\rm 2146\ s}\end{align}
4.9 FIM operation
In this simulation, FIM operation was initiated at a DTG of 130NM and continued until 3NM before the runway threshold where the final approach speed is assumed. The final spacing error was measured at the runway threshold. Approximately 95% of all operations are expected to be within 10s of the RTA(10,Reference de Gelder, Bussink, Knapen and ‘t Veld15) , and the standard deviation (SD) is expected to be less than 5s(Reference Bone and Mendolia7). In this simulation, FIM operations were only deemed successful if the results are within 5s of the RTA.
4.10 Evaluated parameters
Besides the final spacing error, which indicates the ability of each logic to fulfil the IM task and requirements, the total number of speed commands, i.e., all speed changes after FIM initiation and accelerations, was measured. Furthermore, the fuel flow and burn, as a function of thrust, and the speed brake use time, as an indication for the economy and required crew interaction, were compared. Finally, a new metric, the reference profile deviation (RPD), was measured. The RPD represents the speed deviation from the reference profile times the distance flown and can easily be identified as the area between the modified and the reference profile in the CAS/DTG chart.
5.0 RESULTS
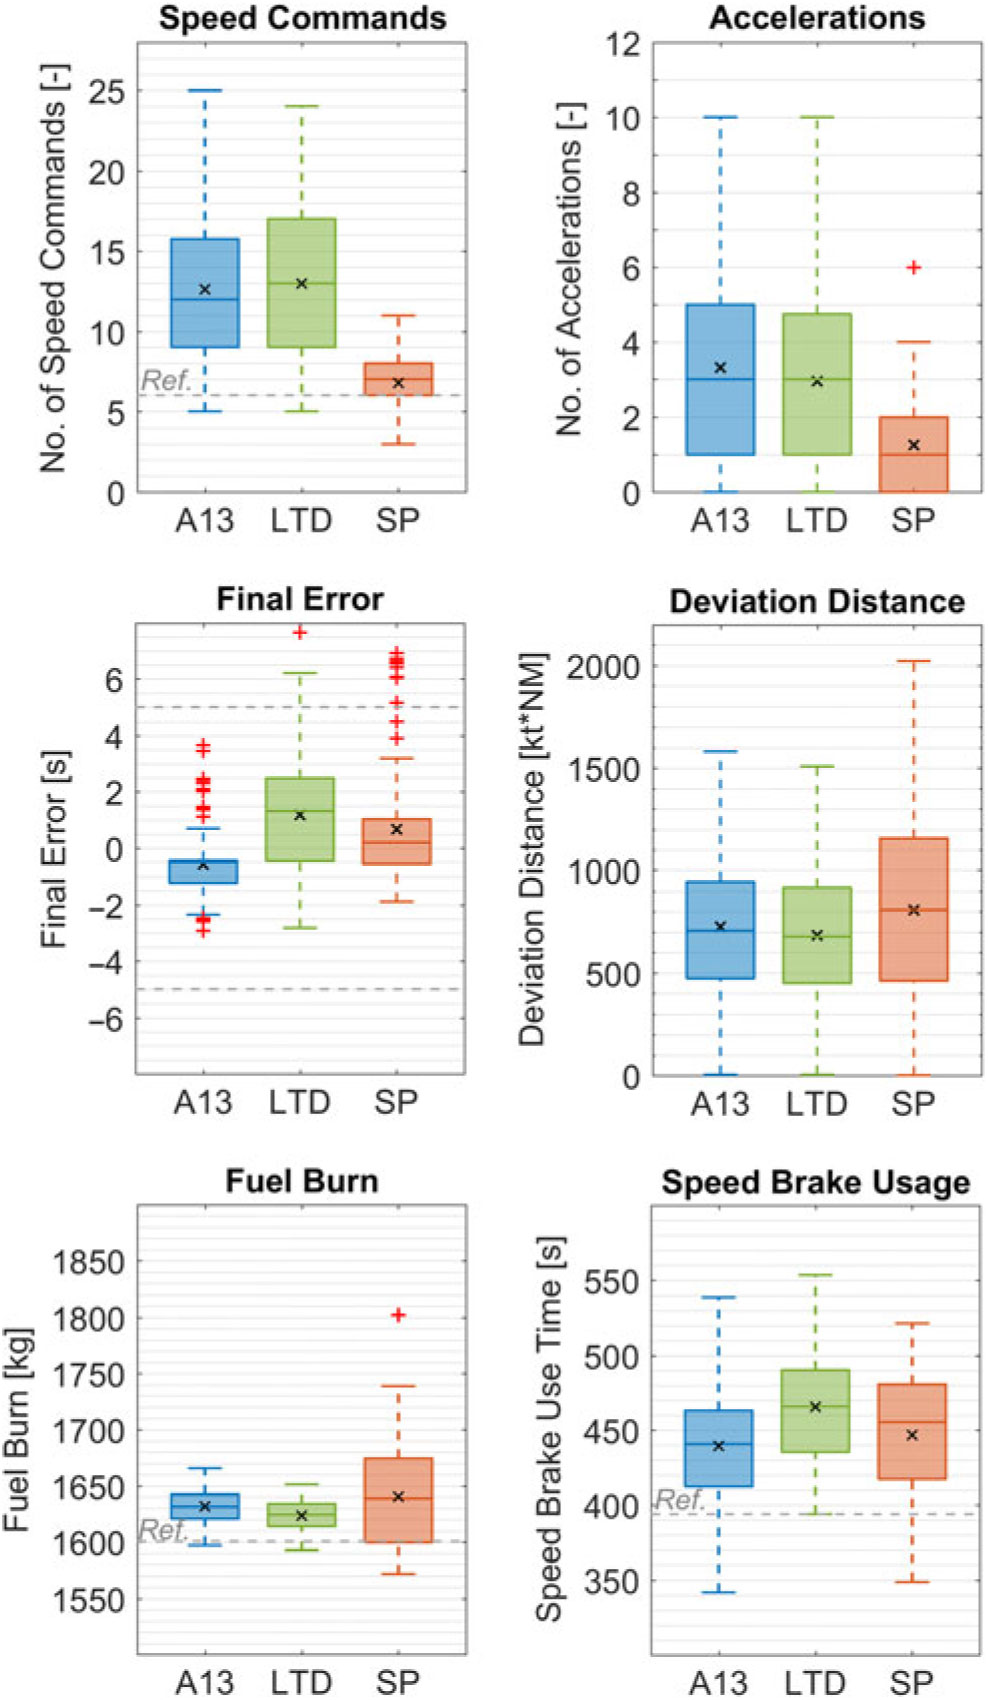
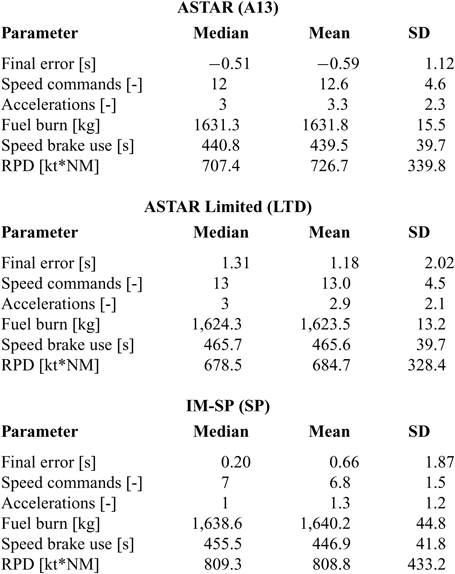
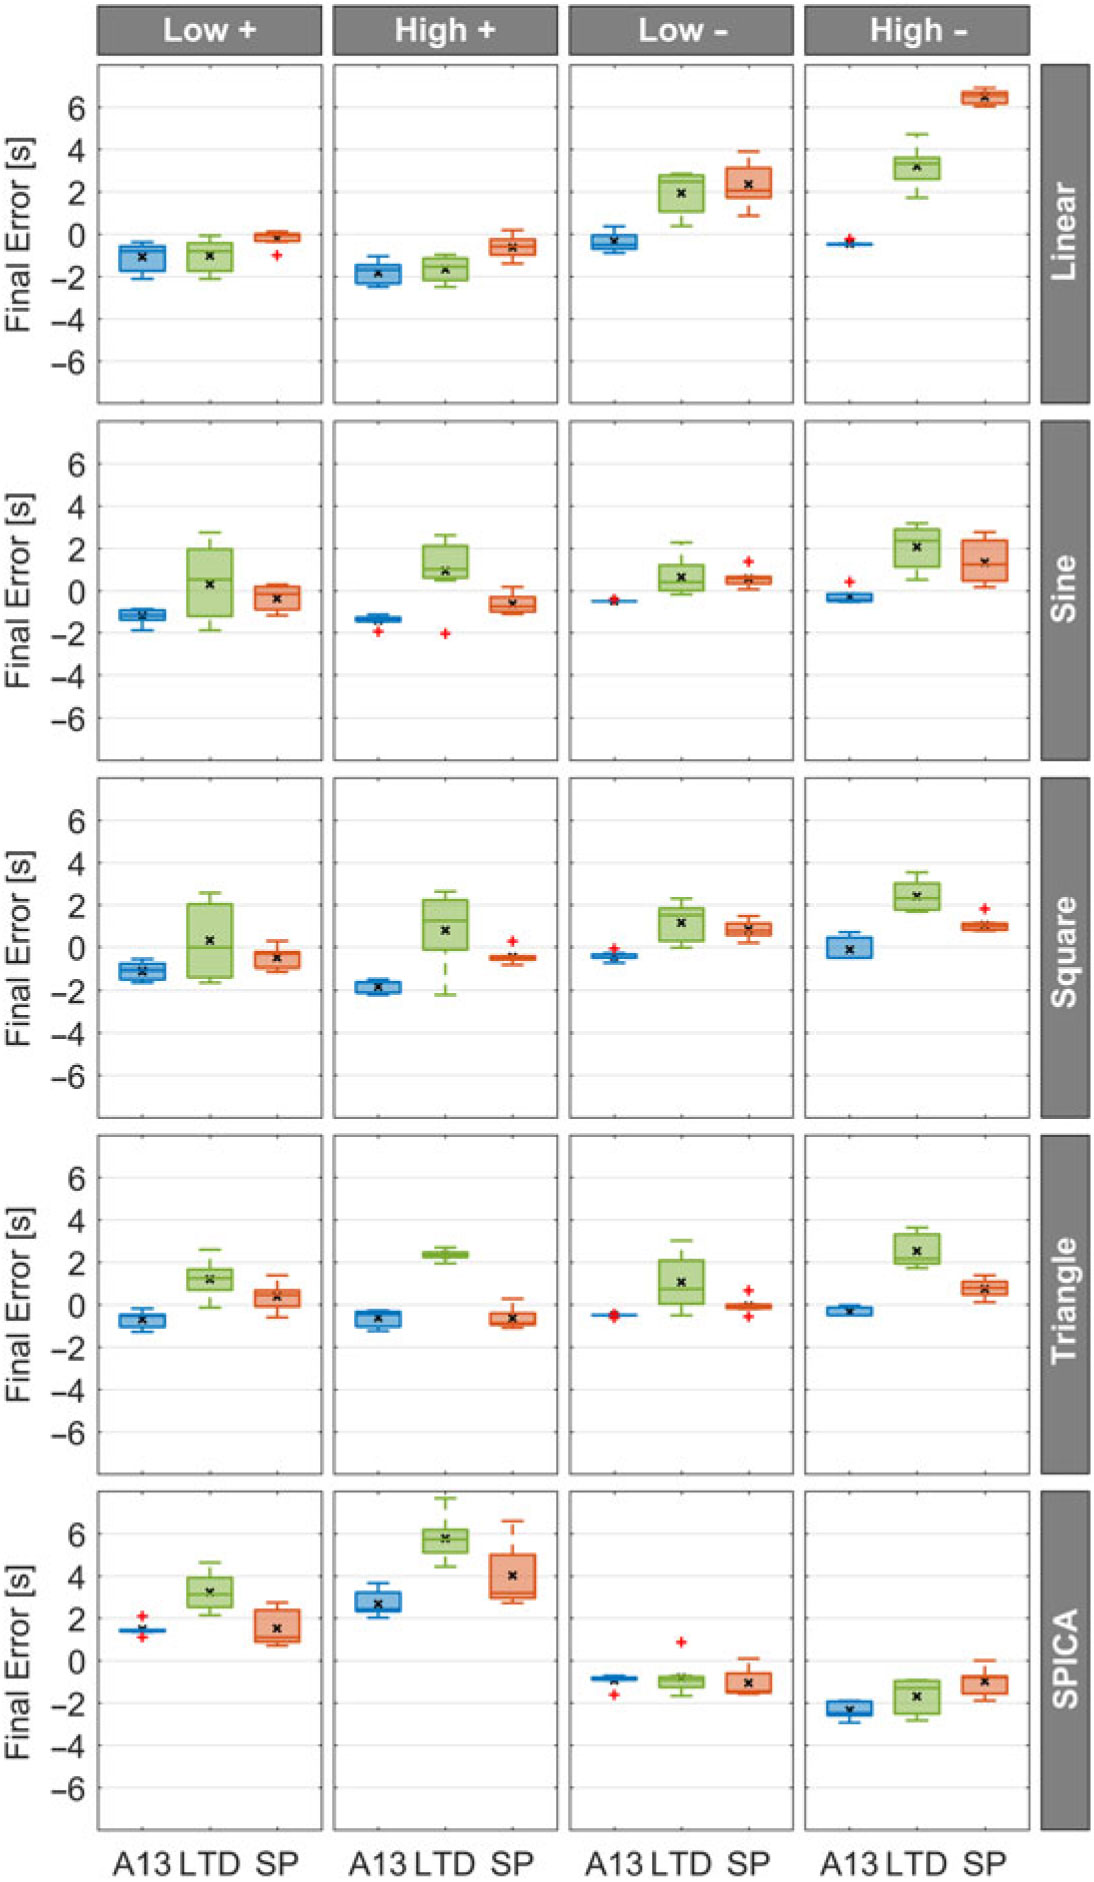
The overall results for the 147 cases are shown in the boxplot matrix in Fig. 10 and in Table 4. The boxplots in Fig. 10 are grouped by ASTAR with no speed constraints (A13), ASTAR with speed constraints (LTD) and the IM-SP algorithm (SP). The data are drawn according to the Tukey convention, with outliers marked by ‘+’, and the mean value is indicated by ‘x’. Where applicable, the reference value or the goal range is indicated by the dashed horizontal line. Table 4 presents the median, mean and standard deviation for each parameter, grouped by logic.
Results for all scenarios divided by logic. (A13 = ASTAR, limits lifted, LTD = ASTAR, limits enforced, SP = IM-SP).

Median, mean and standard deviation values for each parameter by logic

5.1 Spacing performance
ASTAR, with lifted speed constraints, showed the overall best results with all samples within the arrival time goal and the final error of −0.59 ± 1.12s. IM-SP showed comparable results with a spacing error of 0.66 ± 1.87s and a slightly better median value of 0.20s compared to −0.51s of ASTAR. While a decline in the SD was observed, the differences in the mean values were negligible. A few profiles generated by IM-SP arrived later than required, but no profiles arrived earlier than permissible. ASTAR with full limitations shows the highest final error at 1.18 ± 2.02s.
A scenario-by-scenario comparison matrix of the spacing performance is shown in Fig. 11. The matrix indicates that the majority of the late arriving outliers caused by IM-SP can be attributed to the ‘Linear High–’ case. A detailed explanation of the reason of this behaviour and a possible countermeasure is presented in Section 6.
Result matrix for each error pattern and amplification factor. (A13 = ASTAR, limits lifted, LTD = ASTAR, limits enforced, SP = IM-SP).

5.2 Speed commands and accelerations
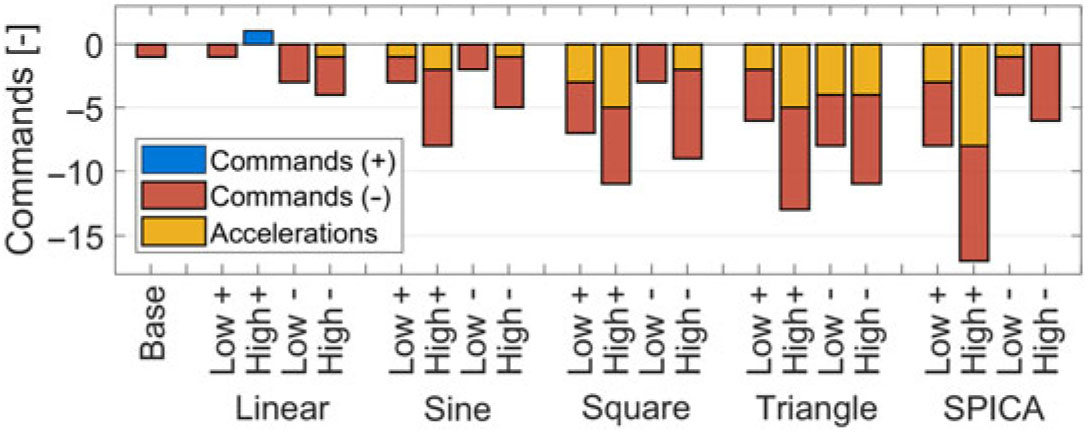
A significant reduction of 46% in speed commands was observed with IM-SP, which has 6.8 ± 1.5 (median 7) commands compared to 12.6 ± 4.6 (median 12) commands of ASTAR and 13.0 ± 4.5 (median 13) commands of its limited variant. On average, IM-SP profiles require only one more command than the reference profile. A decline in the total number of accelerations could also be observed. Figure 12 shows the median difference in issued speed commands and accelerations between IM-SP and limitation-lifted ASTAR, grouped by error pattern, amplification and sign. The acceleration bars are overlaid, not stacked; e.g., for the ‘SPICA Low+’ pattern, the median number of speed commands was reduced by 8, accelerations by 3.
Difference in median speed commands and accelerations between IM-SP and ASTAR (with limitations lifted).

5.3 Fuel burn
ASTAR in both variants show consistent fuel burns with small SDs. While IM-SP-generated profiles have a marginally higher average fuel burn (0.5% compared to unrestricted ASTAR), the SD is significantly higher, indicating that profiles with higher and lower fuel burn than ASTAR are generated. The results of ASTAR can partially be accredited to its behaviour to operate close and to return to the nominal speed (see Section 6).
5.4 Speed brake use
The average speed brake use time is similar for all cases, with a slightly elevated value for the limited ASTAR logic. Since the latter cannot increase its speed higher than the maximum speed, it continuously operates at the envelope border; thus, requiring longer speed brake deployment. In general, for continuous descent operations, especially with modern aircraft and at higher masses, deceleration in a clean configuration usually requires the use of speed brakes to achieve the anticipated deceleration rate. Therefore, the overall use time might be higher than that of other descent patterns.
5.5 Reference profile deviation
The RPD also confirms that the ASTAR profiles operate at speeds closer to the nominal profile or for shorter distances, although it does not indicate the effectiveness of FIM. Conversely, owing to IM-SP’s ability to advance or delay an acceleration, this value is easily increased during farther shifts.
5.6 Detailed example
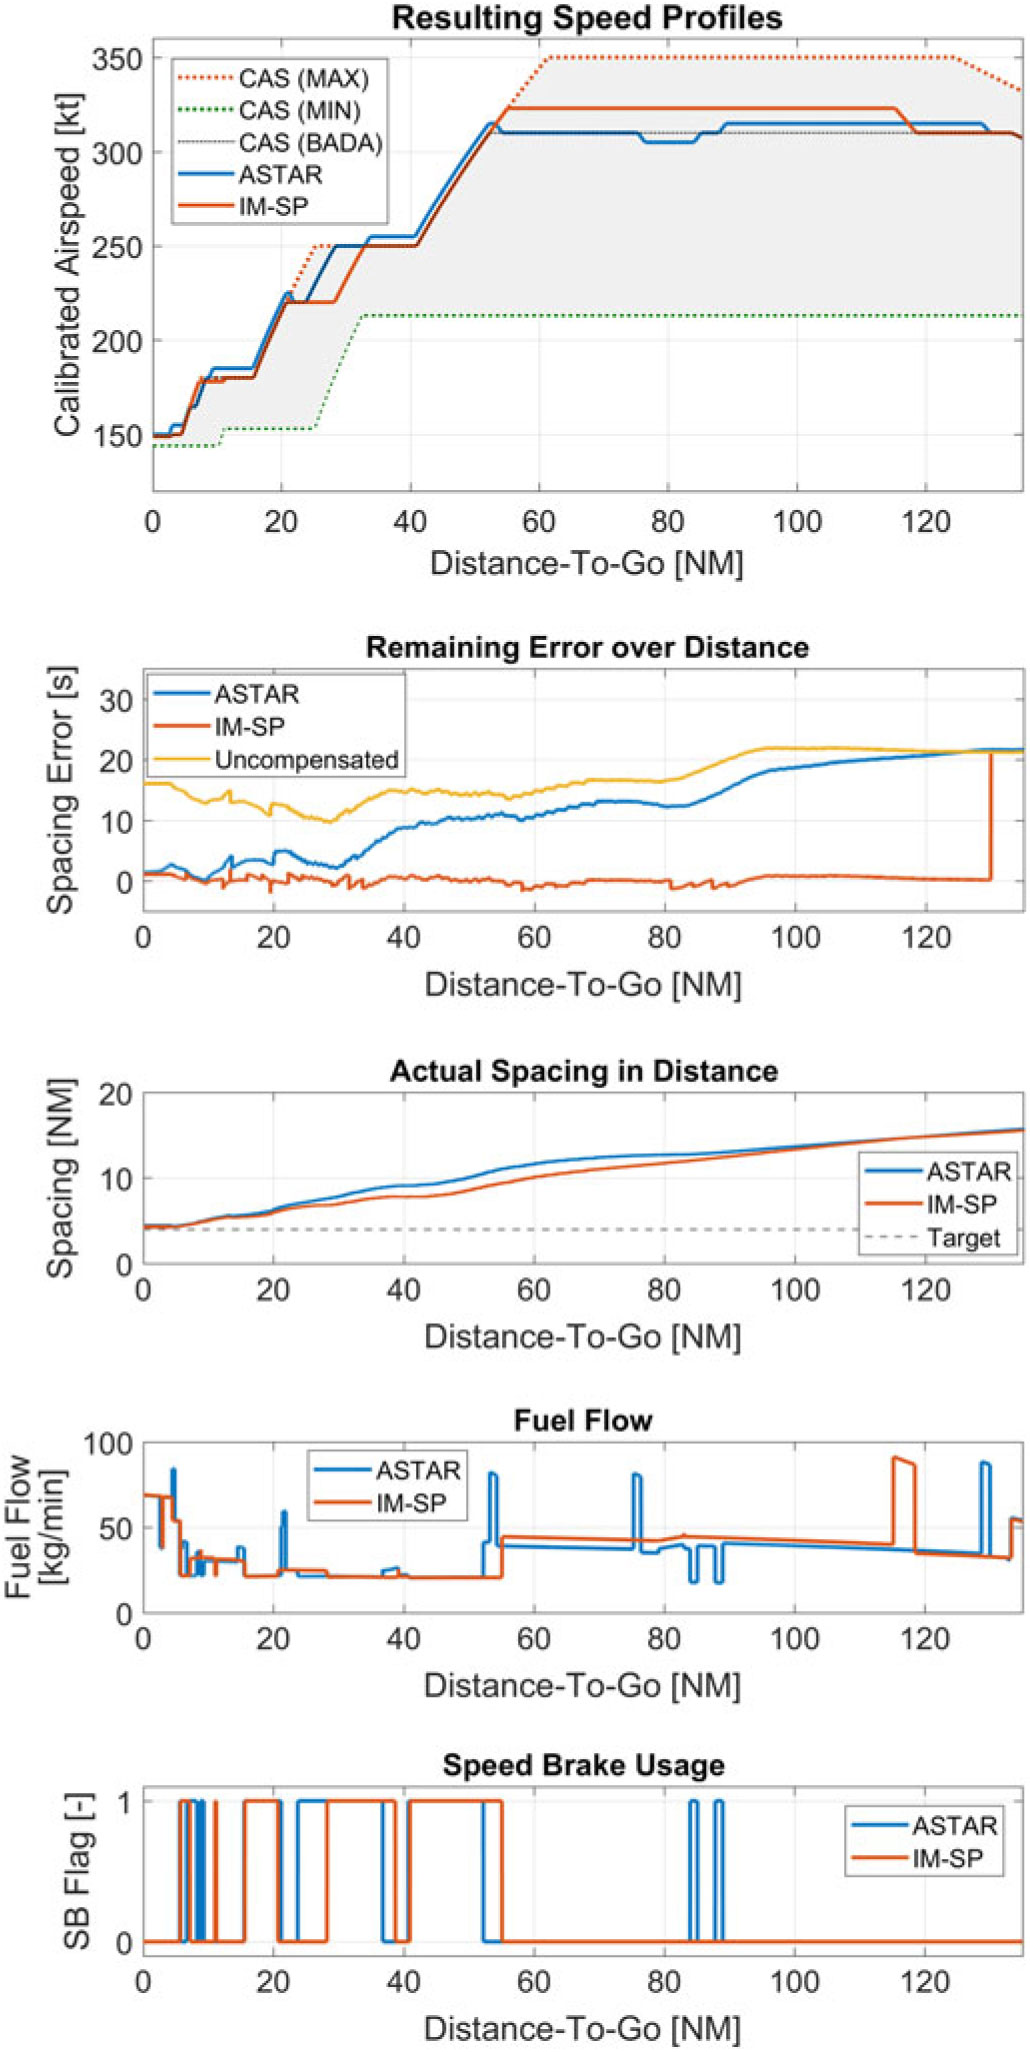
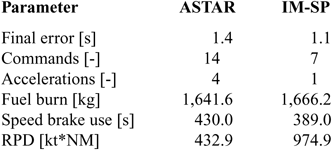
Figure 13 and Table 5 show the detailed comparison of the ASTAR (lifted) and IM-SP generated profiles for the ‘SPICA Low+’ case with +20s initial error. The x-axis, representing the DTG, is the same and aligned for all graphs and is limited to the area of FIM operation. The remaining error graph indicates the uncompensated error, i.e., the error if no action is taken, and the remaining error after treatment by each logic. This graph highlights the working principle of IM-SP, as sudden ‘jumps’ indicate that the re-planning process, as described in Section 3.5, was evoked and a modification was made. The most prominent one is found at system initiation. Here, the initial error of 20s was corrected by a single acceleration of +13kt commencing at a DTG of 118.52NM (approximately 90s after FIM initiation). From that point on, the newly generated profile is used for further error calculation until the next modification is made.
Detailed comparison of the ‘SPICA Low+’ scenario with an initial spacing error of +20s.

Result comparison for the SPICA Low+case

ASTAR commands an immediate but lower acceleration at initiation owing to the gain factors set at the current DTG. The acceleration is reverted after the TTF slows down, i.e., the induced spacing error decreases at a DTG of approximately 90NM before the nominal speed is resumed. IM-SP realises the necessary countermeasures at a later scheduled speed step and maintains the current speed. The actual distance graph shows the spacing in the distance between the ownship and TTF in nautical miles. While IM-SP closes in on the TTF earlier, due to the higher speed segment, sufficient separation is always maintained by both profiles, resulting in spacing distances of 4.4NM (ASTAR) and 4.3NM (IM-SP) at the TTF’s runway threshold crossing.
The total fuel burn for IM-SP was higher than for ASTAR; however, given the reduced number of speed changes (7 versus 14), the fuel flow was steadier with less spikes. The speed brake use time was reduced with IM-SP, and speed brakes were commanded fewer times.
As seen in Table 6, IM-SP modified the speed profile for 19 times: 12 DTG, 6 CASTGT modifications, and 1 acceleration. Besides the initial acceleration, modifications have been made to APs 10, 6 and 2. The projected effect on the TTG corresponds to the ‘jumps’ in the ‘Remaining Error over Distance’ graph in Fig. 13. The shortest TTR occurred for the final modification, informing the crew 31s before action was required. The second shortest notification time (34s) was the last modification to AP6. All other changes were available to the crew more than 60s before the change occurred.
List of all speed profile modifications by IM-SP

6.0 DISCUSSION AND FUTURE TASKS
6.1 Spacing performance
For spacing intervals that require the aircraft to operate at speeds close to the maximum limit, removing the waypoint speed constraints is essential for ASTAR’s performance and generates the most consistent results. However, for normal procedures in high-density arrival operations, speed constraints are currently necessary and envisioned to remain so in the near future. In this environment, the IM-SP concept and algorithm demonstrated improvements compared to ASTAR. The cases in which IM-SP fails to achieve the spacing goal occur with high spacing errors that increase during the final phases of the flight, predominantly during the ‘Linear High-’ pattern. In similar cases, the modified profile will at one point be the fastest available profile with no more room for further expeditions, i.e. no AEM (Fig. 14).
Example of a speed profile with no AEM.

A possible countermeasure would be to employ a logic that detects if the profile would lose its capability to further expedite the arrival. If this is the case, it either calculates a different profile to regain some margin or puts a surcharge on the error to artificially generate a faster profile allowing for compensating further delays.
6.2 Applying speed constraints to IM-SP
The motivation to apply all constraints to IM-SP in this initial study was to allow for an easier integration into current airspace systems and to mitigate potential concerns of air traffic controllers and air navigation service providers in exempting aircraft from those constraints. Further, depending on the national airspace system, rules like 250kt below 10,000ft can be of restrictive nature, i.e. not waivable by air traffic controllers, a recommendation (waivable) or not exist at all. Nevertheless, it is hypothesised that lifting these constraints for IM-SP will improve its spacing goal performance ability, especially in scenarios as described in Section 6.1, which will be investigated in a follow-up study.
6.3 Significance of the number of commands
The final error and number of speed command data (Table 4) indicates that IM-SP provides an improvement over ASTAR performance in an operationally realistic environment with speed constraints. As IM-SP is designed to apply and group IM required changes to existing procedural speed changes (Section 2.4), it not only produces less commands but also has the ability to announce changes earlier in advance (Table 6). Therefore, it is hypothesised that a Human-in-the-Loop (HITL) experiment would report less workload and improved awareness of speed changes. It is expected that the reduction in (additional) speed commands reduces the amount of attention the crew has to divert to the system and decreases the likelihood that commands are missed or entered incorrectly. Further, since the crew is able to confirm the current speed plan, i.e. IM-SP’s intentions, important tasks, e.g., landing briefings, can be scheduled to phases where the system is unlikely to interrupt. To make good use of this advantage, the development of an easy-to-understand graphical user interface (GUI), in close alignment to the previous FIM display designs(Reference Baxley, Palmer and Swieringa30), is an important future task.
Another potentially benefiting aspect of fewer commands and longer continuous speed segments is the better performance in chained FIM operations. As FIM is Automatic Dependent Surveillance Broadcast (ADS-B) reliant and its performance reduces with increasing number of FIM aircraft(Reference Weitz and Swieringa12,Reference Itoh, Uejima, Kakichi and Suzuki17,Reference Riedel, Itoh, Tatsukawa and Takahashi20) , fewer commands will also decrease the amount of actions required by the second FIM aircraft to react to the first FIM aircraft’s FIM-induced speed commands.
One feasible reason for ASTAR to issue a large number of speed commands is the tendency of its feedforward driven logic to return to the nominal speed, which sometimes occurs close to planned deceleration (Fig. 13); however, this does not apply to IM-SP.
6.4 Further testing and Human-in-the-Loop evaluation
While the results produced by IM-SP in this study are promising, the concept needs to be tested under different conditions, e.g. the lifting of speed constraints, different wind conditions or chained FIM operation. As for the latter, the ownship has no knowledge of the accumulated error in front of the TTF, i.e. upcoming error from two aircraft or more ahead, so that unknown or sudden delay might impact the system’s performance.
System wise, the optimisation of the cost function’s weight factors (Section 4.7) could allow for an improvement in performance, compared to the balanced configuration used in this study, and will also be explored in a future study.
Most importantly, the concept must be tested in a HITL flight simulator environment to evaluate the actual performance, usability and operational feasibility and to evaluate its acceptance by pilots and air traffic controllers.
7.0 CONCLUSION
This study introduced an alternative control concept for FIM application with a focus on reducing the speed commands and to benchmark the system to the current representative logic of ASTAR. The proposed system, IM-SP, which uses speed planning, was able to reduce the speed commands by 46% with minor impacts on spacing performance. Results for 147 different cases were calculated, and weaknesses of both logics were identified. The reduction in speed commands is expected to improve the usability and acceptance of FIM operations. Future research should focus on the conceptual differences of IM-SP, testing of this system under different conditions, the optimisation of the cost function attributes and their weight factors, the design of an adequate GUI and further tests including pilots and air traffic controllers in a HILT environment.