1 Introduction
Analysing the productivity and the organizational efficiency of public health systems is critical to address the concerns of policy makers who have to ensure the provision of public services which better satisfy population needs (Hollingsworth, Reference Hollingsworth2013). The existence of inefficiencies would imply that public resources could be better used elsewhere, in the health care or in other sectors, and that variations in efficiency could lead to uneven quality of service provision and perceptions of unfairness (Smith and Street, Reference Smith and Street2005). Understanding how large inefficiency are and where in the production process improvements could be made, is key for Governments (Hollingsworth and Street, Reference Hollingsworth and Street2006; Street and Hakkinen, Reference Street and Hakkinen2009; Papanicolas and Smith, Reference Papanicolas and Smith2014).
Efficiency in health care has been analysed as the difference between the observed and optimal productivity. Health care providers, including hospitals, but also individual practitioners, primary health care units, clinics, nursing homes, public health teams and primary health care facilities have been the most studied decision making units (DMUs) (Hollingsworth and Wildman, Reference Hollingsworth and Peacock2003; Hollingsworth, Reference Hollingsworth2008; Hollingsworth and Peacock, Reference Hollingsworth and Wildman2008; Hussey et al., Reference Hussey, de Vries, Romley, Wang, Chen, Shekelle and McGlynn2009; Kirigia et al., Reference Kirigia, Sambo, Renner, Alemu, Seasa and Bah2011; Au et al., Reference Au, Hollingsworth and Spinks2014). The efficiency of health systems has also been analysed, mostly at national level through cross-countries comparisons (Gravelle et al., Reference Gravelle, Jacobs, Jones and Street2003; Hollingsworth and Wildman, Reference Hollingsworth and Peacock2003; Greene, Reference Greene2004; Retzlaff-Roberts et al., Reference Retzlaff-Roberts, Chang and Rubin2004), but also at sub-national level, by comparing states (Kathuria and Sankar, Reference Kathuria and Sankar2005; Prachitha and Shanmugam, Reference Prachitha and Shanmugam2012), districts (Kinfu, Reference Kinfu2013; Kinfu and Sawhney, Reference Kinfu and Sawhney2015) or lower level health authorities (Giuffrida, Reference Giuffrida1999; Giuffrida et al., Reference Giuffrida, Gravelle and Sutton2000; Giuffrida and Gravelle, Reference Giuffrida and Gravelle2001; Puig-Junoy and Ortún, Reference Puig-Junoy and Ortún2004; Varela et al., Reference Varela, Martins and Fávero2010).
Sub-national health systems have been conceived and analysed as a DMU. However, in many national health systems (NHSs) organized on a hierarchical basis, sub-national health authorities are constituted by two types of entities with distinct functions. Health administrations (HAs) manage the financial resources to purchase health services from local health care providers or to directly provide them with the human and physical inputs they require. Health care providers deliver care according to their capacity and to the needs of their catchment population [World Health Organization (WHO), 2000; Robinson et al., Reference Robinson, Jakubowski and Figueras2005]. Due to their distinct roles, HA and health care providers, or health facilities (HFs), can be considered separate DMUs. Measuring their performances separately and understanding how they influence the performance of the health system at sub-national level could provide insights about where improvements could be made (Cacace and Nolte, Reference Cacace and Nolte2011).
Previous studies have assessed cost-efficiency in contracting health services (Puig-Junoy and Ortún, Reference Puig-Junoy and Ortún2004) or the relative contribution of administrative costs to inefficiencies of local health authorities (Giuffrida et al., Reference Giuffrida, Gravelle and Sutton2000). Some studies have accounted for the hierarchical organization of health care delivery in assessing providers’ efficiency through multilevel models (Hauck et al., Reference Hauck, Rice and Smith2003; Jacobs et al., Reference Jacobs, Smith and Street2006). However, nor the efficiency of two separate DMUs with distinct roles and production processes (HA and health care providers), nor the way in which local HA efficiency influences health care providers efficiency have been studied. The role of HAs is even more critical in low- and middle-income countries (LMICs), where the scarcity of financial resources is exacerbated (WHO, 2000). Further, due to the decentralization processes undergoing in many LMICs, HAs are acquiring growing responsibilities. However, very little is known about how they work, perform and affect the health system at the local level (Wickremasinghe et al., Reference Wickremasinghe, Hashmi, Schellenberg and Avan2016).
We used stochastic frontier analysis (SFA) to assess the efficiency of health districts in delivering outpatient primary care in Mozambique. As in the existing literature, we first assumed that health care delivery at local level is the result of an aggregated production process, through which financial resources and health care inputs are simultaneously transformed into services. We then analysed separately the efficiency of HAs in managing financial resources to equip and staff HFs, and the efficiency of HFs in using these inputs to deliver health care. We finally assessed the effect of HAs efficiency on health care delivery by including its measure in the district aggregated production function and in the HFs production function.
This study contributes to the literature on health care efficiency in three ways. First, the composite nature of local health care systems, resulting from the separate contributions of HAs and HFs to service delivery, is recognized and conceptualized. Second, HAs’ and HFs’ inefficiencies are separately measured and a method to quantify the effect of administrative inefficiency on the performance of HFs and district health systems is proposed. Third, the sources of bias arising from analysing the sub-national health systems as aggregated DMUs are identified.
By separately analysing the efficiency of the DMUs that contribute to health care delivery, (HAs and HFs), our analysis draws attention upon the overlooked role of HAs. By quantifying the effect of administrative on overall district efficiency, and by investigating some of the channels through which it acts, this study highlights how targeting HA efficiency can lead to a more effective use of financial resources at local level.
2 Study setting
The large majority of health care services in Mozambique are provided by the public sector. The NHS follows a centralized top-down hierarchical organization, including 10 provinces, 142 districts in the country and the capital, Maputo City. Districts manage secondary and primary care, which is provided through district hospitals (DHs), health centres (HCs) and clinics (MISAU, 2012c). There is generally one DH or one HC per district, often located in the major urban centre. DH and HC serve as district reference facility since along with basic primary care they provide inpatient care and, in DH, minor surgery. Acute and specialized care is provided by 10 provincial and central hospitals.
Like in many sub-Saharan and LMICs, the NHS in Mozambique relies heavily on districts, whose HAs organize service provision in line with the national targets and policies set by the Ministry of Health (MoH) (MISAU, 2012c; Wickremasinghe et al., Reference Wickremasinghe, Hashmi, Schellenberg and Avan2016). Specifically, district HAs manage financial and non-financial resources to guarantee that HFs have the means to operate and deliver services and are therefore responsible for the staff and equipment input-mix available in HFs (HST, 1998; MISAU, 2002, 2012c; Wickremasinghe et al., Reference Wickremasinghe, Hashmi, Schellenberg and Avan2016). The minimum number of staff and equipment required in each type of HF (clinic, HC and DH) are defined by the MoH according to the catchment population of the facility and to whether it provides services such as surgery or maternal care. The distribution of health care inputs across districts and across HFs within the same district (MISAU, 2002, 2012a, 2012c) is driven by these minimum staff and equipment standards.
With the decentralization reform, which began in 2007, the responsibility for hiring human resources (HR) has gradually been devolved to district HAs. District health administrators are responsible for opening staff vacancies, selecting candidates and legalizing their recruitment according to the national administrative norms. Medical and clinical staff are still recruited by central or provincial administrations and allocated to districts. However, district HAs have first to communicate their needs, so that the recruitment process gets started, and then hire and distribute staff across HFs, pay their salaries and manage their careers and benefits, and ultimately retain them. For example, housing for key health cadres, including health technicians and maternal and child nurses, has emerged as the most important factor for HR retention in rural areas (Vio et al., Reference Vio, Buffolano, Honda and Vinyals2013). The MoH recommends that a minimum number of housing should be built next to each HF (MISAU, 2007). The management of housing benefit, including building, renting, maintaining and allocating houses, along with the daily HR management, depends largely on district health administrators.
While the central or provincial administrations are responsible for infrastructure building and major maintenance, and for the purchase and distribution of drugs and major equipment, district health administrators are responsible for the direct procurement of small items of equipment and consumables. Therefore, the degree to which the HFs need for drugs, equipment and consumables is satisfied depends on the efficiency of HAs in identifying them first, and then in channelling and pursuing them with the higher administrative levels, or directly acquiring what is needed.
District HFs provide health care to meet demand given their capacity, which is determined by the infrastructure and the staff and equipment available. The actions of HFs staff operating under the various constraints they face, determine service availability and responsiveness to population needs, for example through HFs opening times and attitude towards patients. In some cases a pro-active attitude of staff can lead to the involvement of community volunteers to support health personnel in performing basic health care tasks or HFs maintenance (MISAU, 2012c). The capacity of HFs to deliver health care is affected by district HA. The levels of human and physical resources available in a HF are correlated and are the results of the HA capacity to effectively plan and spend resources and allocate inputs. HAs may also influence the way HFs are run through support, monitoring and coordination within their district (Sherr et al., Reference Sherr, Cuembelo, Michel, Gimbel, Micek, Kariaganis and Pio2013).
District recurrent expenditure, including salaries and running costs, is mostly funded through provincial and district government grants, as well as non-earmarked donor grants (referred here as provincial, district and donor financial resources for simplicity). District financial resources have progressively increased since 2008 and represented around 40% of the total executed recurrent expenditure at district level in 2011. Provincial and donor financial resources are allocated to districts according to the number and type of HFs. Districts own revenues represent a negligible share of their total financial resources and are generated from small activities, such as occasionally renting spaces, and from user fees collection. However, user fees are very low and the large majority of the population is exempted. Other donor earmarked funds are made available to support district-level activities, but those resources are often either difficult to track in a systematic way, or not managed by district administrations (MISAU, 2012a, 2012b, 2012c; Quresky et al., Reference Quresky, Cossa, Velenyi, Azeveda and Maia2016). All financial resources, at the time covered by this study, were managed by district HAs, while no financial resources were managed directly by HFs.
3 A framework for analysis: aggregated vs two-steps district production process
We used two alternative frameworks for the analysis of efficiency at the district level and we compared the results obtained.
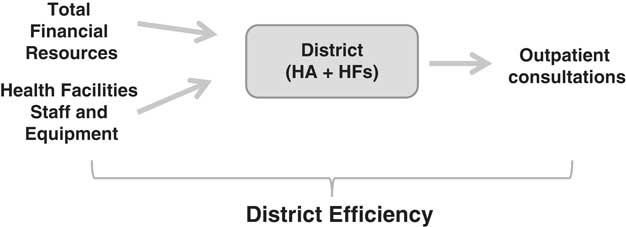
First, we followed the approach taken in the existing literature on local health system efficiency (Giuffrida, Reference Giuffrida1999; Giuffrida et al., Reference Giuffrida, Gravelle and Sutton2000; Giuffrida and Gravelle, Reference Giuffrida and Gravelle2001; Puig-Junoy and Ortún, Reference Puig-Junoy and Ortún2004; Kathuria and Sankar, Reference Kathuria and Sankar2005; Varela et al., Reference Varela, Martins and Fávero2010; Prachitha and Shanmugam, Reference Prachitha and Shanmugam2012; Kinfu, Reference Kinfu2013), and we considered health care delivery at district level as an aggregated production process. We conceived the district as an individual DMU, made of HA and HFs that transform all available inputs (financial resources, staff and equipment) into health care, measured here through outpatient consultations (Figure 1).
District aggregated health care production process. HA=health administration; HFs=health facilities.

Because of the referral system in place and the inequalities in inpatient and specialized care provision across the country, outpatient consultations are the only output delivered by all HFs and directly comparable across districts. Financial resources include the total recurrent expenditure from multiple sources but managed by the district. Since capital expenditure and infrastructure planning are managed at the central and provincial levels, and since changes in the number and type of HFs between 2008 and 2011 were minor, we considered these as given at the district level.
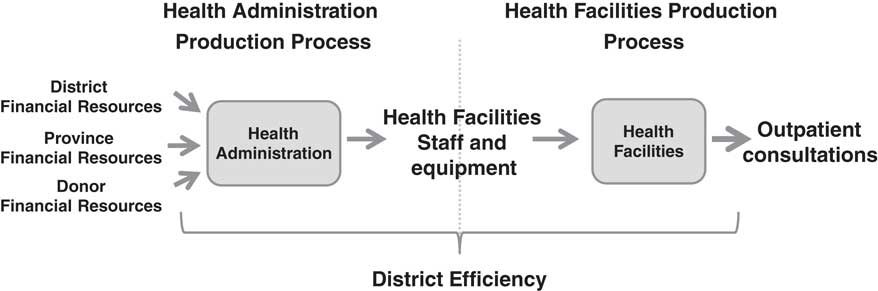
Second, since in Mozambique, as in many hierarchically organized NHSs (WHO, 2000; Robinson et al., Reference Robinson, Jakubowski and Figueras2005), the financial management and health care delivery functions depend on two separate DMUs, we modelled the health care production at the district level as a two-step process (Figure 2).
Two-step district health care delivery production process in Mozambique
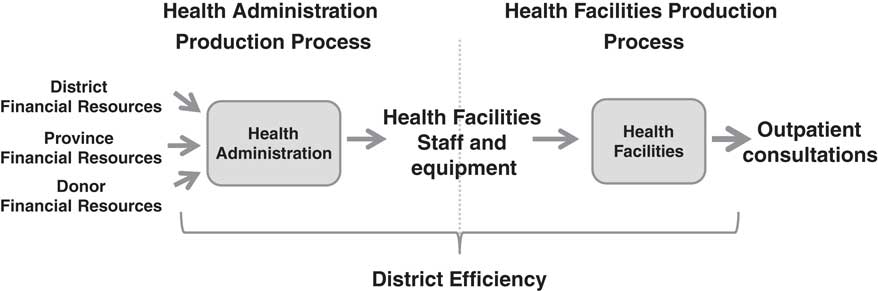
In a first step, the HA uses financial resources from three different sources (i.e. government provincial expenditure, government district expenditure and donor expenditure) to purchase the HFs input-mix and fund their running costs. In a second step, the HFs use their HR and equipment input-mix to deliver health care.
The HA provides the HFs with the input required (e.g. medical equipment, staff, drugs, timely payment of energy bills, maintenance commodities for cleaning and hygiene, food in inpatient wards, fuel for transport). The HA identifies the HFs input needs, plans the actions required to satisfy them and identifies those options that could minimize costs (e.g. providing regular maintenance and organizing the purchase of equipment and consumables for all HFs in the district). Differences across HAs in the efficiency in using the available financial resources to fund HFs inputs and running costs practically depend on the planning, management and supervision skills of the HA teams (for given conditions).
4 Methods
4.1 District efficiency assuming an aggregated production process
Following Fried et al. (Reference Fried, Lowell and Schmidt2006), we defined efficiency as the difference between the observed and optimal productivity, measured by ratios of output to input. We used SFA to compare the observed level of output to an optimal production frontier estimated based on the observed inputs and assumptions on the production function. We used a production function, rather than a cost function because information on prices was not available and because, due to central purchasing and national directives, the prices of the inputs measured and included in the analysis tend not vary across districts.
We used SFA rather than alternative non-parametric techniques because it allows accounting explicitly for measurement error and quantifying the effect of each inputs and of factors outside the DMU control on the production frontier (Kinfu, Reference Kinfu2013). Furthermore, when panel data are available, SFA models outperform non-parametric techniques if the assumed functional form for the production function is close to the underlying production technology (Giuffrida and Gravelle, Reference Giuffrida and Gravelle2001). We assumed a Cobb–Douglas functional form for f(.) accounting for inputs complementarities in health care delivery and assuming constant returns to scale.
We formulated the aggregated district SFA model as
 $$Y_{{it}} \,{\equals}\,f(X_{{it}}^{D} , \ {\rm }\beta ){\rm }E^{D} \left( {Y_{{it}} ,X_{{it}}^{D} } \right),$$
where Y
it
is the output (outpatient consultations), delivered by district i at time t.
 $X_{{it}}^{D} $
includes health care inputs, here defined as total financial resources for outpatient care and HFs staff and equipment. The production frontier
 $f\left( {X_{{it}}^{D} ,{\rm }\beta } \right)$
defines the maximum level of output (Y
it
) attainable by district i at time t, for a given combination of inputs
 $\left( {X_{{it}}^{D} } \right)$
. β is the vector of parameters of the production function f (.).
 $E^{D} \left( {Y_{{it}} ,X_{{it}}^{D} } \right){\equals}{{Y_{{it}} } \over {f(X_{{it}}^{D} ,\ {\rm }\beta )}}$
is the district efficiency calculated as the ratio of observed production (Y
it
) to the maximum number of consultations deliverable with the inputs available and the technology in use,
 $f\left( {X_{{it}}^{D} ,{\rm }\beta } \right)$
.
We log transformed equation (1) to obtain a linear equation and we applied the Pitt and Lee (Reference Pitt and Lee1981) random effects model for panel data with time invariant inefficiency, to allow controlling for district characteristics fixed over time. Important efficiency changes would have been unlikely since the time period considered covered the same government mandate. We derived the empirical specification of the Pitt and Lee (Reference Pitt and Lee1981) SFA model following Greene (Reference Greene2008):
 $${\rm }y_{{it}} \,{\equals}\,\alpha {\plus}\beta x_{{it}}^{D} {\plus}\delta z_{{it}}^{D} {\plus}{\rm }{\varepsilon}_{{it}}^{D} {\rm ,}$$
where
 ${\varepsilon}_{{it}}^{D} \,{\equals}\,v_{{it}}^{D} {\minus}u_{i}^{D} $
with
 ${\rm }v_{{it}}^{D} \sim N(0,\sigma _{{v^{D} }}^{2} )$
,
 $u_{i}^{D}\sim N^{{\plus}} \left( {0,\sigma _{{u^{D} }}^{2} } \right)$
and
 $cov\left( {v_{{it}}^{D} ,u_{i}^{D} } \right)\,{\equals}\,0$
.
y it is the natural log of the yearly number of outpatient consultations per capita.
 $x_{{it}}^{D} $
is a vector of inputs that includes: (a) the (natural log of) annual recurrent expenditure for outpatient care per capita (see Anselmi et al., Reference Anselmi, Lagarde and Hanson2015a for details), a proxy for financial resources, which is the sum of the executed district, provincial and donor expenditure in district I; (b) the (natural log of) average HF staff and equipment, measured using an index which averages across HFs the availability of six items: working car, autoclave, motorbike, number of basic, medium- and high-level trained health cadres (see Anselmi et al., 2015b). While the index is not comprehensive of all inputs required in the HF, evidence suggests that the availability of HR and major equipment is correlated with that of drugs and other medical supplies (Wagenaar et al., Reference Wagenaar, Gimbel, Hoek, Pfeiffer, Michel, Manuel, Cuembelo, Quembo, Afonso, Gloyd and Sherr2014).
For each HF we calculated the average ratio of available resources to the minimum standard set by norms for each item (MISAU, 2002). Details on the calculation and further discussion of the implications are provided in Anselmi et al. (Reference Anselmi, Lagarde and Hanson2015b). We used existing norms as a benchmark to standardize availability of items across different types of HFs (MISAU, 2012a). We averaged across items to account for the complementarity between staff and equipment availability required to deliver effective health care and across HF within the same district to get a measure of availability in HFs rather than in the district.
 $z_{{it}}^{D} $
is a vector of district characteristics that capture heterogeneity in the production technology and accommodates shifts of the production frontier.
 $z_{{it}}^{D} $
includes: (a) the (natural log of) number of HFs per type per 100,000 population; (b) the percentages of HFs with access to electricity and to running water (time variant); (c) the percentages of population that are economically active and illiterate (time invariant); and (d) provinces fixed effects to control for the influence of provincial management and other province characteristics. We included district characteristics and provincial dummies to control for differences in the epidemiological profile, for which specific data were not available, and for differences in demand for health care across geographic areas (Anselmi et al., Reference Anselmi, Lagarde and Hanson2015a, Reference Anselmi, Lagarde and Hanson2015b). Provincial dummies were also included to control for differences across provincial administrations that in a hierarchical system may influence both HAs and HFs activities. The observed error term
 $\left( {{\varepsilon}_{{it}}^{D} } \right)$
is a combination of the normally distributed stochastic error term
 $\left( { v_{{it}}^{D} } \right)$
and the non-negative half-normally distributed term
 $\left( {u_{i}^{D} } \right)$
.
 $u_{i}^{D} $
defines how far the i
th
district operates below the stochastic production frontier and measures the time invariant inefficiency in production (Kinfu, Reference Kinfu2013).
We finally obtained estimates of the district relative efficiency score (
 $\widehat{{E_{i}^{D} }}$
) from the Pitt and Lee (Reference Pitt and Lee1981) as follows (Greene, Reference Greene2008):
 $$\widehat{{E_{i}^{D} }}\,{\equals}\,e^{{{\minus}\widehat{{u_{i}{\vskip}^{D} }}}} \cong1\,{\minus}\,\widehat{{u_{i}^{D} }},$$
where
 $\widehat{{u_{i}^{D} }}$
is the input-oriented inefficiency scores obtained with the Jondrow, Lowell, Materov and Schmidt (JLMS) estimator (Jondrow et al., Reference Jondrow, Materov, Lovell and Schmidt1982).
 $u_{i}^{D} {\equals} {{{\minus}\lambda {\varepsilon}_{i} } \over \sigma }$
, where ɛ is half-normally distributed and can be estimated using the values provided by the SFA model estimates.
4.2 District efficiency assuming a two-step production process
4.2.1 First step: HA efficiency
In analogy with the SFA model used for the district aggregated production process, we derived the empirical specification of the district HAs SFA model as
 $${\rm }y_{{it}}^{A} \,{\equals}\,\alpha {\plus}\beta x_{{it}}^{A} {\plus}\delta z_{{it}}^{A} {\plus}{\varepsilon}_{{it}}^{A} ,$$
where
 ${\varepsilon}_{{it}}^{A} \,{\equals}\,v_{{it}}^{A} {\minus}u_{i}^{A} $
with
 ${\rm }v_{{it}}^{A} \sim N(0,\sigma _{{v^{A} }}^{2} )$
,
 $u_{i}^{A} \sim N^{{\plus}} \left( {0,\sigma _{{u^{A} }}^{2} } \right)$
and
 ${\rm cov}\left( {v_{{it}}^{A} ,u_{i}^{A} } \right)\,{\equals}\,0$
.
 $ y_{{it}}^{A} $
is the natural log of the average HFs staffing and equipment index described in section 4.1.
 $x_{{it}}^{A} $
includes the (natural log) of the recurrent expenditure per HF, for each source of funding. To standardize the availability of financial resource per HF across districts accounting for differences in number and type of existing HFs, we weighted each HF type based on the estimated cost of the minimum staff and equipment they should have according to norms (MISAU, 2012a).
 $z_{{it}}^{A} $
includes the (natural log) all HFs number, the percentages of HFs with access to water and electricity, the average ratio of houses for personnel, available and in good conditions, to the minimum number established by norms (MISAU, 2012a, 2012d) as a proxy for HR retention capacity, and provinces fixed effects.
We estimated
 $\widehat{{E_{i}^{A} }}$
to the efficiency of HA i using the JLMS estimator as decribed in equation (3).
4.2.2 Second step: HF efficiency
In the second step we derived the empirical specification of the district HFs production process as
 $${\rm }y_{{it}} \,{\equals}\,\alpha {\plus}\beta y_{{it}}^{A} {\plus}\beta x_{{it}}^{F} {\plus}\delta z_{{it}}^{F} {\rm }{\plus}{\varepsilon}_{{it}}^{F} ,$$
where
 ${\varepsilon}_{{it}}^{F} \,{\equals}\,v_{{it}}^{F} {\minus}u_{i}^{F} $
with
 ${\rm }v_{{it}}^{F} \sim N(0,\sigma _{{v^{F} }}^{2} )$
,
 $u_{i}^{F} \sim N^{{\plus}} \left( {0,\sigma _{{u^{F} }}^{2} } \right)$
and
 ${\rm cov}\left( {v_{{it}}^{F} ,u_{i}^{F} } \right)\,{\equals}\,0$
.
As in section 4.1, y
it
, is the natural log of the district total outpatient consultations per capita.
 $y_{{it}}^{A} $
includes the (natural log of) average availability of staffing and equipment with respect to norms, as in section 4.2.1.
 $x_{{it}}^{F} $
is the (natural log of the) number of DH, HC and clinics per 100,000 population.
 $z_{{it}}^{F} $
includes the percentages of the district population that are economically active and that are illiterate (time invariant) to control for catchment population characteristics, the percentages of HFs in the district with electricity and of those with access to running water (time variant), to control for HF conditions, and provinces fixed effects.
As before, using the JLMS estimator, we estimated
 $\widehat{{E_{i}^{F} }}$
, to which quantifies the average efficiency of HFs in district i.
Having estimated the district, HA and HFs efficiency scores (
 $\widehat{{E_{i}^{D} }}$
,
 $\widehat{{E_{i}^{A} }}$
and
 $\widehat{{E_{i}^{F} }}$
), we plotted them in a graph and calculated their correlation and rank correlation to compare the measured district performance under the assumption of an aggregated or two-step production process.
4.3 Testing for the effect of HA efficiency on district and HF efficiency
We tested for the effect of district administrative efficiency on district and HFs production (and efficiency) by including
 $\widehat{{E_{i}^{A} }}$
into the SFA models defined in equations (2) and (5). We looked at the significance of the coefficient associated with it, as done by Greene and Segal (Reference Greene and Segal2004) to test for the effect of efficiency on profitability.
We evaluated the goodness of fit of the district and HF models without and with inclusion of HA efficiency looking at the log likelihood and the Akaike information criterion (AIC), testing the hypothesis of a null coefficient associated with
 $\widehat{{E_{i}^{A} }}$
and performing a Likelihood-ratio (LR) test. Higher log likelihood, lower AIC and rejection of the LR test null hypothesis indicated that the SFA model including administrative efficiency fitted the data better.
We further compared the aggregated district SFA in equation (2) to a specification including
 $\widehat{{E_{i}^{A} }}$
but not HF staff and equipment. If the inclusion of staff and equipment levels, along with HA efficiency, did not improve the fit for the data, we could infer that the availability of staff and equipment depended on the financial resources available as well as the HA efficiency in managing them. A two-step model accounting for administrative efficiency would then be preferable.
We tested if accounting for heterogeneity in administrative efficiency affected the evaluation of district and HFs performance, by calculating the correlation and rank correlation of the efficiency scores estimated from equations (2) and (5) and from the relative counterparts including
 $\widehat{{E_{i}^{A} }}$
. High correlation would indicate a small effect of HA on district performance.
4.4 Data
Data on HFs type, staff and equipment for 2008–2011 were derived from the National Health Information System data, as provided by the MoH in June 2012 (MISAU, 2012d). After cross-checking the information with provincial and district annual reports and with local health authorities, we retained only information on equipment items that was found reliable. For 1.5% of the HFs we replaced staff and equipment figures in a specific year with the 2008–2011 average, when the discrepancy between the two was higher than 50%.
Figures for provincial and district recurrent expenditure for 2008–2011 were obtained from the Ministry of Finance (2012) and MoH budget execution reports (MISAU, 2012b). To get disaggregated district figures for all sources of expenditure, we assumed that donor and provincial expenditure were allocated to each district according to the number and type of HFs, as it used to be done before the decentralization (MISAU, 2012a), and that donor expenditure benefited exclusively primary and secondary care, which are managed at district level.
Population figures were based on annual projections from the 2007 Census (INE, 2010a, 2010b). District socio-economic indicators were estimated by the National Institute of Statistics from 2007 Census data (INE, 2008; INE, 2010a, 2010b), and were therefore time invariant over the period considered in the analysis.
We merged data at the district level to obtain a single 4-year panel database (2008–2011). We excluded Maputo City from the analysis, due to the presence of specialized and private health care providers, and eight districts, due to incomplete information. All models are estimated using Nlogit 5.
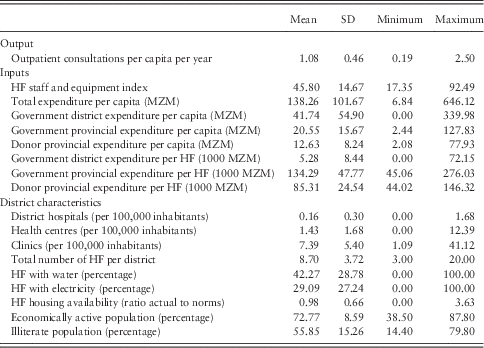
The descriptive statistics of the variables included in the analysis (Table 1), revealed considerable heterogeneity across districts in terms of service delivered, access to health care, expenditure and population characteristics, driven by unmeasured differences in population density and urbanization. Heterogeneity in expenditure by source reflected the undergoing decentralization process involving the gradual devolution of financial resources to districts, which explains the low but increasing district expenditure per capita.
District descriptive statistics, Mozambique 2008–2011

Note: N=532 (133 districts over 4 years); HF=health facility; MZM=Mozambican Metical.
5 Results
5.1 District efficiency assuming an aggregated or a two-step production process
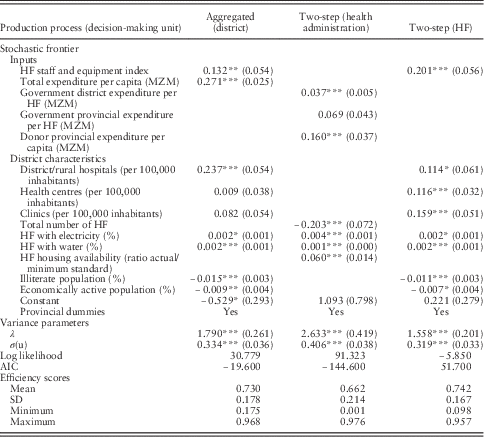
The average district efficiency differed if evaluated at the HA, HFs or aggregated level. Table 2 presents the coefficients of the stochastic frontier and the efficiency scores for aggregated district, HA and HFs.
District, health administration and health facility stochastic frontiers and efficiency scores, Mozambique (2008–2011)

Note: N=532 (133 districts over 4 years); HF=health facility; AIC=Akaike information criterion; MZM=Mozambican Metical.
Standard errors in parenthesis.
All stochastic frontier inputs in natural log.
***, **, *indicates significance at 1, 5, 10% level, respectively.
On average districts realised only 73% of the potentially deliverable outpatient consultations. This could be attributed to inefficiencies in health care delivery, since for given health care inputs HFs realised only 74% of the deliverable outpatient consultations, but also to administrative inefficiency. Indeed, on average HAs reached only 66% of the HFs staff and equipment levels that they could potentially achieve for given financial resources. The significance of the variance parameters confirmed the presence of inefficiency in each of the production processes considered.
When health care delivery was analysed as an aggregated district process, as expected, we found that staff and equipment, financial resources per capita, the presence of a DH and the proportion of HF with access to water and electricity were positively associated with the outpatient consultations production frontier (Table 2, Column 1). On the contrary, the proportions of illiterate and economically active population were negatively correlated with it, reflecting higher barriers to health care use in rural areas where education is lower and where a higher proportion of the population appear economically active (due to higher employment in agriculture rather than informal services and businesses).
When we analysed health care delivery as a two-step production process, we found more precise indications of how specific inputs contribute to district efficiency. Donor and district expenditures, the proportions of HFs with access to water and electricity, and the availability of staff housing, were positively correlated with the highest availability of staff and equipment that HAs could have managed to place in HFs (Table 2, Column 2). On the contrary, the number of HFs in a district was negatively correlated with it. Interestingly, provincial expenditure does not significantly affect district production frontier, probably due to its reduction along with the increase in district expenditure arising from decentralization policies.
As expected, we found that higher availability of staff and equipment positively affected the number of outpatients consultations per capita per year deliverable by HFs in a given district (Table 2, Column 3). The coefficient associated with HFs staff and equipment, which was hypothesized to depend on financial resources and HA efficiency, was larger in the HFs production frontier, where expenditure was not included (Table 2, Column 3) than in the district production frontier where expenditure was included (Table 2, Column 1). The numbers of HCs and clinics in a district were positively correlated with the HFs attainable output. This suggests that the non-correlation between the total number of HFs and the district attainable output could therefore reflect the opposite effect of the number of HFs on outpatient consultations and on HA management performance. Higher proportions of illiterate and of economically active population were negatively correlated with the delivery of outpatient consultations, likely reflecting utilization constraints in rural areas.
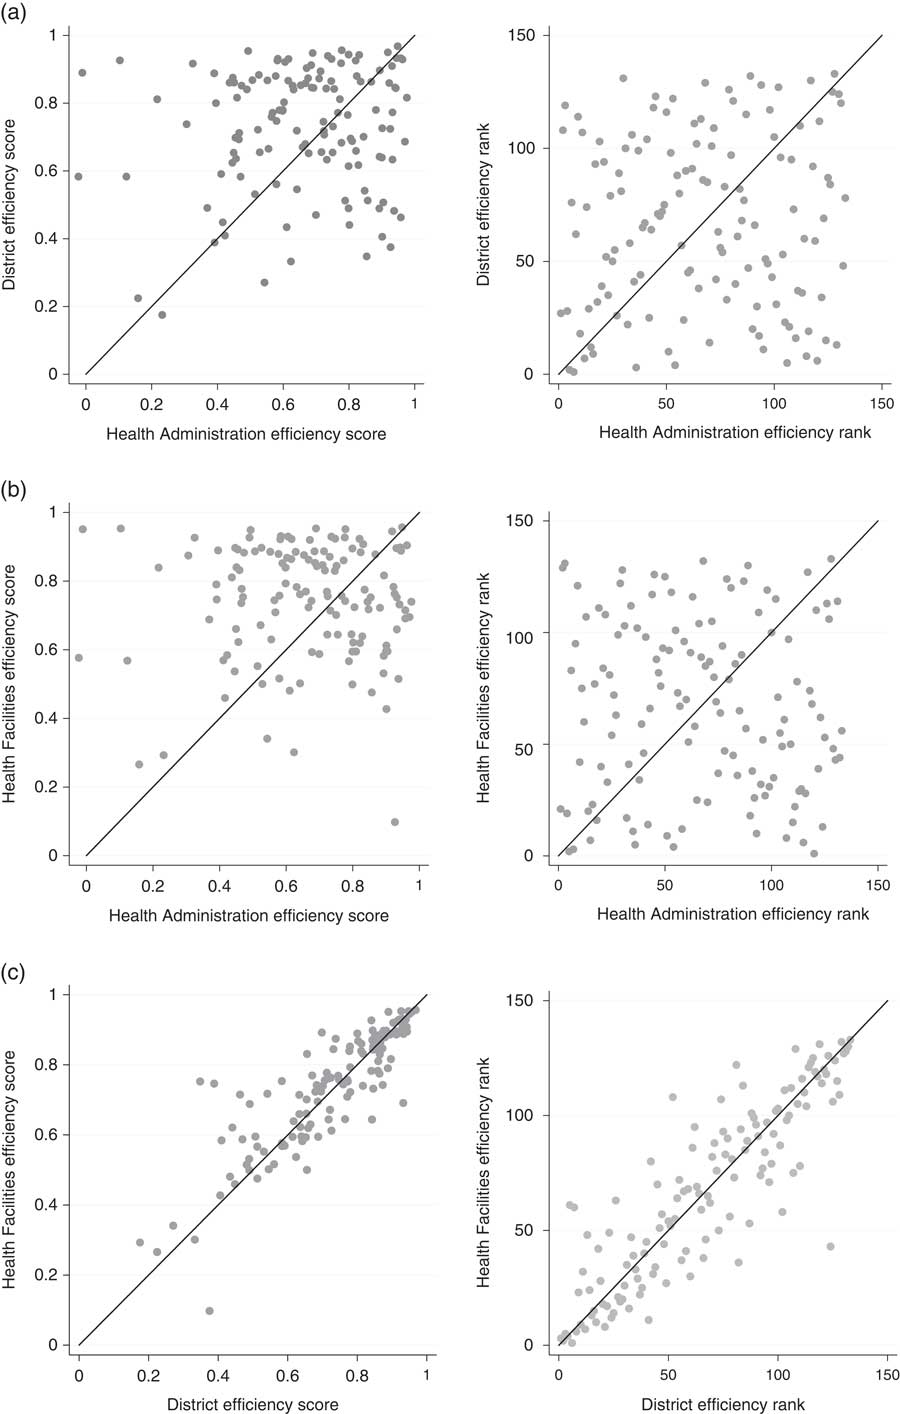
The comparison of the efficiency scores and the relative rankings of district, HA and HFs through scatter plots (Figure 3) and correlation coefficients, indicated that the district aggregated health care delivery process is closer to the HFs than to the HA process in the two-step model. HA and district efficiency scores and rankings were only mildly correlated (Perason’s correlation: 0.11, p-value: 0.00 and Kendall’s rank correlation: 0.07, p-value: 0.09), as illustrated by the dispersion of the relative plots in Figure 3(a). HA and HFs efficiency scores and rankings were different [Figure 3(b)] and not significantly correlated (Perason’s correlation: 0.01, p-value: 0.87 and Kendall’s rank correlation: −0.05, p-value: 0.26). Aggregated district and HFs efficiency scores and rankings were highly correlated (Perason’s correlation: 0.86, p-value: 0.00 and Kendall’s rank correlation: 0.88, p-value: 0.00) and very similar, as illustrated by their plots close to the 45° line [Figure 3(c)].
Comparison of district, health administration and health facilities efficiency scores and rankings, Mozambique (2008–2011); (a) health administration and district; (b) health administration and health facilities; (c) health facilities and district

5.2 The effect of HA efficiency on district and HF efficiency
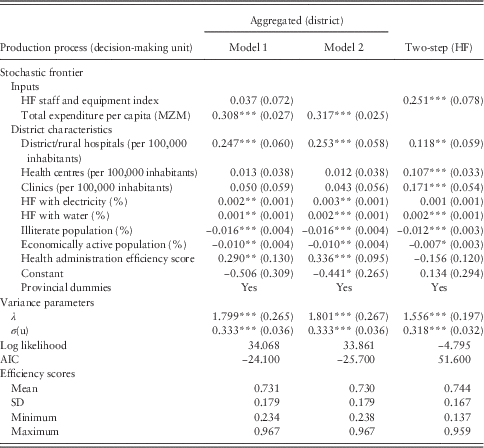
Table 3 shows SFA results including HA efficiency in aggregated district, with and without HFs staff and equipment (Columns 1 and 2), and for HFs (Column 3).
District and health facility stochastic frontiers and efficiency scores, accounting for health administration efficiency, Mozambique (2008–2011)

Note: N=532 (133 districts over 4 years); HF=health facility; AIC=Akaike information criterion; MZM = Mozambican Metical.
Standard errors in parenthesis.
All stochastic frontier inputs in natural log.
***, **, * indicates significance at 1, 5, 10% level, respectively.
When included in the district production function, the HA efficiency score had a positive and significant effect on the volume of deliverable outpatient consultations, as illustrated by the coefficient in the aggregated district production frontier (Table 3, Column 1). When comparing the aggregated district model without and with HA efficiency (Table 2, Column 1 and Table 3, Column 1) the higher log likelihood, the lower AIC criterion and LR test suggested that accounting for HA efficiency improved the model fit. The LR test (LR=6.61>3.84) rejected the null hypothesis of the coefficient associated with the HA efficiency being zero.
After the inclusion of the HA efficiency score, the coefficient associated with district expenditure was larger and the coefficient associated with the HFs staff and equipment was no longer significant. This indicate that the effect of HFs staff and equipment in the aggregated district production function was fully explained by the availability of financial resources and the efficiency of HA in using them. The LR test (LR=0.414<3.84) comparing the model specification in Table 3 (Column 1) and Table 3 (Column 2) confirmed that the inclusion of HFs staff and equipment did not improve the model fit.
Once the availability of inputs for health service delivery was accounted for, HA efficiency had no significant effect on the estimated HFs production frontier and efficiency scores (Table 3, Column 3). This suggests that HA efficiency influenced health care delivery only through the level of staffing and equipment in HFs. The smaller log likelihood, the higher AIC criterion and the LR test (LR=2.11<3.84) comparing the model in Table 2 (Column 2) with the model in Table 3 (Column 3) confirmed that the inclusion of HA efficiency did not improve the model fit to the data.
While the inclusion of HA efficiency in the district and in the HFs health care production models affected the responsiveness (elasticity) of health care delivery to each input, but not the measured district or HFs efficiencies. Indeed the coefficients associated with the inputs changed when the HA efficiency scores were included in the analysis, but not much the efficiency scores. Both the district and HFs efficiency scores resulting from the SFA models with and without HA efficiency were very highly correlated (Pearson’s correlation: 0.99, Kendall’s rank correlation: 0.99), indicating that the measured performance was not affected by the inclusion of HA efficiency.
5.3 Robustness checks
SFA estimates of efficiency may be sensitive to the assumptions made about the distribution of the inefficiency term and the definition of the model used (Street, Reference Street2003; Kumbhakar et al., Reference Kumbhakar, Lien and Hardaker2014). We therefore calculated the confidence intervals of the efficiency scores and performed a number of robustness checks. We carried out the same analysis in two alternative ways: first we assumed an exponential distribution for the inefficiency terms
 $u_{i}^{D} $
,
 $u_{i}^{A} $
and
 $u_{i}^{F} $
, rather than half-normal, and second we measured health care output in service units, rather than outpatient consultations. Service units are a composite weighted measure used in Mozambique’s NHS planning which includes inpatient days, institutional deliveries, vaccinations doses, outpatient consultations and maternal and child health consultations (MISAU, 2012c). Under the assumption of exponentially distributed inefficiency term, the stochastic frontier coefficients associated with input factors and the relative efficiency scores were very similar to those in the original model. When output was measured in service units, differences in the magnitude of coefficients, and for some district characteristics in their significance, were found, reflecting the different nature of the production process. However, the significant and positive effect of HA efficiency on the district but not on the HFs production frontier, was confirmed by both robustness checks. The correlation and rank correlation between the efficiency scores obtained from the original model and the one assuming an exponentially distributed inefficiency term (between 0.98 and 0.99) or the one with service units output (0.52 and 0.60) indicated sensitivity of results to the output definition rather than assumptions on the distribution of the inefficiency term.
Although less frequently done in the literature, we estimated alternative SFA models assuming a translog production function and using a true random effects model. The non-convergence of the maximum likelihood function, due to collinearity in the data, indicated that these models would not fit the data better.
6 Discussion
In this study we set out to assess the efficiency of health districts in delivering outpatient primary care in Mozambique and we distinguished between the efficiency of HA and health care providers in performing their roles. We estimated efficiency first assuming an aggregated health care delivery process and then a two-step process, where HA and HFs hold the separate responsibilities of managing financial resources to purchase health care inputs and of using these to deliver care. We found evidence of inefficiency at the aggregated district level (average efficiency score 73%) driven by inefficiencies of both HA (average efficiency score 66%) and HFs (average efficiency score 74%). We found variation in performance across districts, and in the performance of the same district when evaluated at the HA, HFs or aggregated district level. Performances at the HFs and aggregated district level were similar, since they were both evaluated with respect to the volume of services delivered. HA efficiency, affected both HFs and district health care delivery through the availability of staff and equipment.
The results obtained are in line with the literature on sub-national health systems in LMICs settings (Kathuria and Sankar, Reference Kathuria and Sankar2005; Varela et al., Reference Varela, Martins and Fávero2010; Kinfu, Reference Kinfu2013). Indeed, we found a great variability in input availability and in environmental factors, which affected district performance, emphasizing the importance of accounting for heterogeneity in efficiency analysis (Greene, Reference Greene2004). However, the comparison of the aggregated vs the two-step district health care production models revealed that a model accounting for administrative inefficiencies would perform better. This finding would apply to hierarchically organized public health systems where financial administration and health care delivery functions are attributed to separate organizations at local level, such as Mozambique. Similar conclusions could possibly apply also to the analysis of efficiency in other contexts (e.g. the allocation of inputs across specialties in a hospital) or in other public sectors where the financial management and service delivery functions are split.
Results suggest that the existing studies, which assume an aggregated production process at the sub-national level, tend to capture HFs rather than HA performance, and may generate misleading conclusions about the drivers of district performance. First of all they ignore the role of HA, which determines the availability of inputs for health care delivery in HFs. Second, they may lead to biased conclusions with respect to health care delivery responsiveness to specific inputs. For example, where an input such as the number of facilities in a district has opposing effects on HA and HFs production frontier, the two may cancel out leading to an insignificant effect on aggregated district health care delivery. Estimating the effect of specific inputs correctly and precisely could avoid ineffective policy recommendations while providing indications for more specific and effectively targeted intervention.
Although the efficiency of districts in delivering care is similar when estimated using the aggregated or two-steps model, analyzing separately the production process and performance of distinct organizations provides more precise insights on where inefficiencies are. For example, we found that only 66% of the staff and equipment potentially available for given financial resources were in fact available in HFs. Although the focus of the policy debate is on the improvement of health care conditions and delivery processes at the HF level, increasing HA efficiency is crucial to promote the effective use of available financial resources at district level could be increased. Increasing HA efficiency may translate into up to an average 34% increase in HFs staff and equipment without additional recurrent expenditure. Tackling administrative efficiencies will result into increased health care delivery. On the contrary, increasing financial resources without addressing HA inefficiencies may not produce the expected outcome, even when HFs are efficient. On average, a reduction of administrative inefficiency by 10 percentage points, for a given budget would lead to an increase in the volume of services delivered per thousand population per year of 0.2%.
The study suffers from limitations either common to SFA models either related to data availability and common to existing studies of sub-national health systems efficiency, particularly in LMICs. The definition of input and outputs is limited by data availability and may reduce the potential to evaluate the performance with respect to complicated production processes, with multiple objectives, such as health care including not only outpatient but also inpatient more complex care. Furthermore, no distributional and quality concerns were explicitly considered. However, the staff and equipment index includes essential health care inputs, HR availability in particular, which are likely to be correlated with other inputs (Wagenaar et al., Reference Wagenaar, Gimbel, Hoek, Pfeiffer, Michel, Manuel, Cuembelo, Quembo, Afonso, Gloyd and Sherr2014), and it incorporates distributional concerns since it accounts for resource distribution across HFs according to the minimum requirement set by norms for each type of HF.
In developing both the aggregated and the two-step models we follow previous studies focussing on similar settings (Kinfu, Reference Kinfu2013) and use a Cobb–Douglas production function which assumes complementarities between inputs. The Cobb–Douglas functional form assumes constant returns to scale, and the same returns to scale across districts, but it is possible that returns to scale vary at different levels of inputs and across districts. In particular, provincial administrations may influence returns to scale and economies of scale and prices may vary across districts in spite of national directives. (Arndt et al., Reference Arndt, Jones and Salvucci2015). Differences in the incentives for staff, such as the implementation of pay for performance schemes may also affect productivity, but these began to be applied in some provinces only in 2012. Such differences should be considered by further studies.
Since measures of disease prevalence were not available at district level, the coefficients associated with district characteristics should be interpreted with caution since they are potentially biased by this omission.
Although potential limitations related to the data available exist, the use of routine data has allowed to advance in comparison with previous studies focussing on similar settings.
Our findings led to a number of recommendation for further research investigating efficiency of sub-national health systems with the aim of informing policies to improve effectiveness in the use of public health resources. First, modelling separately the functions of HAs and HFs within districts can allow assessing the efficiency of each institutions and understand which districts are underperforming in which specific functions. Second, the use of different models for HAs and HFs production process allows to identify the effect of each input at different stages of the whole district health care delivery process. Third, while the inclusion of HA efficiency in the district and HFs production function does not affect the performance measurement, it reduces the bias and improves the precision of the estimates of the effect of each input. Finally, research on health system performance should explicitly account for the organizational architecture of the health system and the role of HAs. The use of contextual knowledge about the health care production processes to inform efficiency analysis are recommended to enhance the analysis of health care production processes and the understanding of which specific policy interventions can improve their efficiency.
7 Conclusion
Studying the effect of administrative efficiency on district and HFs performance has shown that analysing each production process separately at the sub-national health system level is more informative than assuming an aggregated production process. While district performance measured under the assumption of an aggregated production process reflects HFs performance, it is driven by both the performances of HA in using financial resources to staff and equip HFs and the performance of HFs in delivering health care.
Differences in performance across districts and HA, HFs or aggregated level within districts exist. The significant effect of administrative efficiency on health care delivery through the availability of staff and equipment in HFs, indicates that improving local capacity for resource administration may alone increase the volume of health care delivered at no additional cost. Further research on health system efficiency should separately assess HA and HFs performances and investigate their specific drivers.
Acknowledgements
The authors wish to thank the Ministry of Health, the Ministry of Finance and the National Institute of Statistics of Mozambique for providing all the data used in this analysis. Bina Langa, Amisse Momade, Samuel Cossa, Eduarda Ribeiro, Silvia Bignamini, Cidália Baloi, Célia Gonçalves, Ernesto Mazivila, Quinhas Fernandes, Jorge Perrolas, Costantino Muendane, Mario Tsaqice, Virginia Guibunda, Daniel Simone Nhachengo, Brigida Senate, Lígia Vilanculos and Salomão Lourenço. Lionel Senete provided invaluable support in cleaning the data and interpreting the results. Any remaining errors are ours.