Introduction
A large number of maternal conditions and environmental stimuli deleteriously affect reproduction in humans and other mammals, including prepregnancy body mass,Reference Kirchengast and Hartmann 1 , Reference Gopalakrishnan, Gardner and Dandrea 2 maternal age,Reference Symonds, Pearce and Bispham 3 nutrient and energy content of the maternal diet,Reference Ayala, Racotta, Hernández-Montes and Quevedo 4 , Reference Friggens, Hay and Oldham 5 and the formation and function of the placenta; these stimuli also harm the offspring.Reference Fowden, Ward and Wooding 6 The energy provided during pregnancy guarantees not only the proper formation of the fetus but also adipose reserves during early pregnancy, energy supply in the last trimester of gestationReference Herrera, Gomez-Coronado and Lasuncion 7 and lactation performance.Reference Álvarez-Ordás, Gutiérrez and Casado 8
Maternal fat storage and adequate energy intake during pregnancy affect lactation because energy requirements are higher during this period in comparison with other physiological conditions in both rats and humans.Reference Ayala, Racotta, Hernández-Montes and Quevedo 4 , Reference Cañas, Romero and Baldwin 9 , Reference Dewey 10 Restricting energy and/or nutrients during pregnancy and/or lactation induces both short- and long-term adverse physiological and metabolic effects in offspring.Reference Desai, Gayle, Babu and Ross 11 , Reference Passos, Ramos and Moura 12 The offspring of nutrient-restricted dams (during either gestation and/or lactation) demonstrate impaired synthesis and activity levels of several hormones,Reference Byrne 13 low birth weight, reduced body weight gain,Reference Desai, Gayle, Babu and Ross 11 , Reference Bertin, Gangnerau and Bellon 14 low β-cells, low insulin secretion by the pancreas,Reference Desai, Gayle, Babu and Ross 11 , Reference Fernandez-Twinn and Ozanne 15 altered feeding behaviors and higher rates of obesity.Reference Bertin, Gangnerau and Bellon 14 There is a relationship between poor nutrient environment during early life and the development of obesity and other metabolic disorders in adulthood: this is also known as the ‘fetal origins of adult disease’ hypothesis, metabolic programming or nutritional programming.Reference Armitage, Khan and Taylor 16
To investigate the relationship between poor nutrition during perinatal life and the development of metabolic disease, researchers have investigated the effects of isocaloric low-protein diets and daily calorie intake reduction (30–70%).Reference Bertin, Gangnerau and Bellon 14 , Reference Fernandez-Twinn and Ozanne 15 , Reference Byrne 13 Poor nursing is reportedly proportional to calorie restriction.Reference Armitage, Khan and Taylor 16 To administer an isoenergetic diet, most low-protein diets contain high levels of carbohydrates,Reference Cherala, Shapiro and D’Mello 17 unbalanced macronutrient ratios and excessive sucrose; together these can induce distinct metabolic responses, including reduced food intake.Reference Josephine 18 – Reference Dutriez-Casteloot, Breton and Coupé 20 In addition, the stress associated with food restriction can induce changes in hormonal activityReference Léonhardt, Lesage and Dufourny 21 by disturbing the hypothalamic–pituitary–adrenal (HPA) axis during weaning.Reference Mendoza, Pévet and Challet 22
Here we evaluate the effects of unlimited access to a low-energy (LE) diet on rat dams and offspring, thereby avoiding food restriction-associated stress. The experimental diet contained approximately 35% less energy than the control (C) diet. This degree of energy restriction is similar to that observed in malnourished human populations.Reference Armitage, Khan and Taylor 16 We hypothesized that this dietetic model would isolate the nutritional insults of various intervening factors (e.g., LE-associated stress, limited access to food, reduced consumption). We believe that administering LE diets to dams can negatively influence growth and metabolic parameters in offspring.
Materials and methods
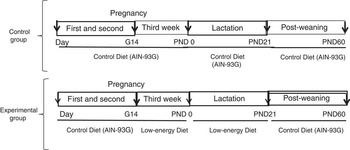
All procedures were performed according to the recommendations of the Ethics Committee on Animal Experimentation of the Science Center of the Federal University of Pernambuco, Pernambuco, Brazil (protocol 006025/2009-85) and the Guide for the Care and Use of Laboratory Animals. Adult virgin female Wistar rats weighing 247±23 g (n=13) were obtained from the Department of Nutrition of the Federal University of Pernambuco. Animals were maintained under controlled conditions (12-h light/dark cycle, 22±2°C, 55–60% relative humidity). Female rats were randomly paired with age- and strain-matched males (2:1 ratio). After mating, pregnant rats were housed in individual polyethylene cages (300×270×470 mm) and administered the C diet. The C diet consisted of casein-containing pellets that had been used for growth and reproduction. All rats were allowed both feed and water ad libitum. All dams either received the C or LE diet from the third week of pregnancy through to the end of lactation. The experimental design is shown in Fig. 1.
Schematic experimental protocol of the study. Control group received control diet based on casein as protein fuels and isoenergetic for growing rats. Experimental group received diet based on casein as protein fuels until gestation day 14. However, from the third week of pregnancy (G14), the experimental group also received diet based on casein as protein fuels until the end of the lactation period (PND 21), but with low-energy diet. After weaning, the growing rats in all groups were fed casein diet (AIN-93G). G14, 14th gestation day; PND 0, at delivery; PND 21, postnatal 21 days; PND 60, post natal 60 days.

Diets were prepared by the Laboratory of Experimental Nutrition and Dietetics, Department of Nutrition, Federal University of Pernambuco according to the recommendations of The American Institute of Nutrition for the growth and reproduction of rodents.Reference Reeves 23 The dry ingredients of both diets were mixed, combined with soybean oil and water, and dried at 62±2°C for 20–24 h. Feed was prepared at the beginning of the experimental period and kept at 4°C until use. Fresh feed was provided every 24 h, daily food intake was monitored and weekly intake was periodically analyzed.
The LE diet contained 35–40% less energy relative to the C diet. The final composition (kcal%) of the C diet was 19% protein, 18% lipids and 63% carbohydrates, thereby providing 3.6 kcal/g; the LE diet consisted of 17% protein, 19% lipids and 64% carbohydrates, thereby providing 2.4 kcal/g. To further decrease the energy value, additional crude fibers (10% more purified cellulose and soluble fiber) and water (~30% greater moisture) were added to the LE diet compared with the C diet. Carbohydrates consisted of sugar and corn starch in both diets. Approximately 3.5 and 1.0 g minerals and vitamins, respectively, were added to every 100 g feed. Proteins and lipids were provided by casein and soybean oil, respectively, and the macronutrient ratios (carbohydrates:protein:lipids) were 7:2:1 and 6:2:1 for the C and LE diets, respectively. The dietetic composition of the LE diet was previously published.Reference Muniz, Silva and Cavalcante 24
On the day of parturition (day 0 of lactation), litters were weighed and the number of pups was registered. Twenty-four hours after delivery, all litters were culled to six pups (male:female ratio of 3:3 or 2:4). Only male rats were retained in this study after weaning. Female pups were only used during lactation to maintain the litter size (six pups), they were killed by decapitation at weaning. After weaning, all weaned male pups were housed three per cage and received the C diet (19% protein [v/v]) until the end of the experiment.
Biometrics, energy efficiency and biochemical determinations
The body weights of the dams (during pregnancy and lactation) and pups (during lactation and after weaning) were periodically recorded. Body weight percentages were calculated for the offspring. Body weight was recorded using a laboratory balance (class II XL-500; Martes, Zilina, Slovak Republic). Food intake was measured every 7 days by calculating the difference between the amount of food provided at the onset of the light cycle and the amount of food remaining 24 h later.Reference Lopes de Souza, Orozco-Solis and Grit 25 To evaluate the percentage increase in food consumption by the dams during lactation, total food intake was plotted against the percent change in food intake during gestation in each group. Total energy intake was calculated by multiplying food intake during gestation and lactation by the energy values of the LE or C diet.
Sample collection from dams
During weaning (day 21–22), dams were intraperitoneally anesthetized with xylazine (10 mg/kg) and ketamine (100 mg/kg) during the first hours of the light cycle after fasting for 12–14 h. Blood samples were obtained by cardiac puncture, and plasma transferrin (colorimetric method; interday coefficient of variation=2.9–4.3%) and retinol-binding protein levels (chemiluminescence method) were determined. Prealbumin and insulin-like growth factor (IGF-1) were determined using interday coefficients of variation of 0.6% and 7.7%, respectively. All analyses were performed at the Laboratory of Pharmacy of the Federal University of Pernambuco. The liver, adipose tissue (both inguinal and retroperitoneal), heart and kidneys were extracted and weighed.
Sample collection from pups
Body weight was recorded weekly throughout the study between 8:00 and 10:00 am. At 60 days of age, the anthropometric indices of the overnight-fasted male offspring were measured.Reference Novelli, Diniz and Galhardi 26 , Reference Bernardis 27 The body weight was recorded, and the circumferences of the thorax (immediately behind the foreleg) and abdomen (immediately anterior to the forefoot) were measured to determine the waist:chest ratio.Reference Novelli, Diniz and Galhardi 26 Body length through lactation and at the end of the experiment was estimated by measuring the distance from the top of the nose to the base of the tail. The distance from the nose to the anus was measured using digital calipers (0.01-mm precision; Series 799; Starrett, São Paulo, Brazil). Data were used to calculate body weight gain, Lee index and body mass index (BMI) using the following formulas:
 $${\rm Body}\,{\rm weight}\,{\rm gain}={\rm final}\,{\rm weight}\,({\rm g})/{\rm initial}\,{\rm weight}\,{\rm (g)};$$
 $$\eqalign{{\rm Lee}\,{\rm index}={\rm cube}\,{\rm root}\,{\rm of}\,{\rm body}\,{\rm weight}\,{\rm (g)}/ \cr {\rm nose\hbox-{\hyphen}to\hbox-{\hyphen}anus}\,{\rm length}\,({\rm cm});^{{{\rm 27}}} $$
 $${\rm BMI}={\rm body}\,{\rm weight}\,{\rm (g)}/{\rm length}\,({\rm cm}^{2} ).^{{{\rm 27}}} $$
Rats were intraperitoneally anaesthetized (10 mg/kg xylazine and 100 mg/kg ketamine) after measurement. The trunk was then opened and blood samples were obtained by cardiac puncture, and blood samples were pooled into heparinized tubes. Blood was centrifuged at room temperature (3000 rpm for 20 min), and serum samples were stored at –70°C until serum biochemical analysis. Enzymatic methods were used to determine the levels of glucose (coefficient of variation=6.9%), triglycerides (coefficient of variation=3.0%) and cholesterol (coefficient of variation=6.1%), and the polyethylene glycol method (Kit Labtest) was used to determine the levels of high-density lipoprotein (HDL; coefficient of variation=4.0%), low-density lipoprotein (LDL; coefficient of variation=1.4–1.6%) and very low-density lipoprotein (VLDL).
After cardiac puncture and blood collection, the abdominal cavity was opened and the organs and fat depots were removed and weighed. Fat depots (epididymal, retroperitoneal and perirenal fat pads) were categorized as visceral fat. Visceral fat was used to determine the absolute and relative amounts of visceral body fat. After killing, the liver, heart, right and left kidneys, right and left adrenal glands, stomach and spleen were removed and weighed to calculate their absolute (mg) and relative weights (g/100g body weight).
Concomitantly, the tibiae were removed, dissected and fixed in 4% formalin in 0.1 mol/l phosphate buffer (pH 7.2). The total length, proximal width and distal width of each tibia were measured to the nearest 0.01 mm using calipers. Tibia length was determined using parameters for assessing animal growth.Reference Lui, Forcinito and Chang 28 The weights of the organs and tissues were measured using a scale (AS-1000; Martes).
Food conversion (FC) and energy efficiency (EE) were calculated and used to determine any metabolic alterations:
 $$\eqalign{{\rm FC}\ \left[ {{\rm weight}\,{\rm gain}\,({\rm g})\,{\rm per}\,{\rm food}\,{\rm intake}\,({\rm g})} \right] \cr \quad= {\rm final}\,{\rm body}\,{\rm weight}\,{\minus}\,{\rm initial}\,{\rm body}\,{\rm weight}/ \cr \quad \ {\rm amount}\,{\rm of}\,{\rm food}\,{\rm intake};$$
 $$\eqalign{{\rm EE}\ \left[ {{\rm weight}\,{\rm gain}\,{\rm (g)}\,{\rm per}\,{\rm kilocalories}\,{\rm ingested}} \right] \cr \quad= {\rm final}\,{\rm body}\,{\rm weight}\,{\minus}\,{\rm initial}\,{\rm body}\,{\rm weight}/ \cr \quad\ {\rm energetic}\,{\rm value}\,{\rm of}\,{\rm the}\,{\rm diet\ (\%)}.$$
Statistical analysis
Results are expressed as the mean±standard error of the mean (s.e.m.). Data were first tested for normality using the Kolmogorov–Smirnov test. The paired or unpaired two-tailed student t-test or Mann–Whitney test were used to assess both groups. In this study, P<0.05 indicates statistical significance. Two-way repeated measures analysis of variance (ANOVA) was used to analyze body weight and food intake, and maternal diet (LE) and time (weeks) were used as the factors in this analysis. The Bonferroni post-hoc test was used when differences were noted between groups. All statistical analyses were performed using GraphPad Prism (version 5.00; GraphPad Software Inc., La Jolla, CA, USA).
Results
Body weight and food consumption in dams during pregnancy and lactation
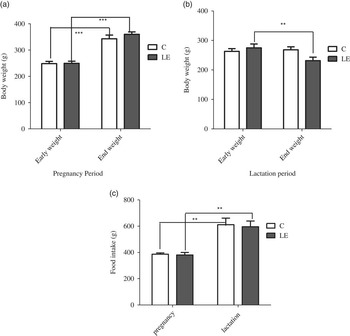
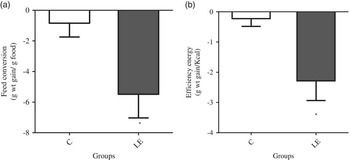
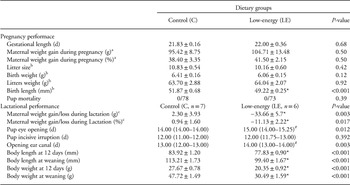
The body weights of the pregnant rats in the C and LE groups were similar at onset (C=248.3±8.2 g; LE=249.4±8.0 g) and during late pregnancy (C=343.7±13.7 g; LE=359.6±20 9.1 g). However, by the end of the lactation period, the body weights of the LE dams were 14% less in comparison with the C group (C=268.4±10.1 g; LE=231.5±11.6 g; P<0.05; Fig. 2). Both groups demonstrated similar weekly gains in body weight during pregnancy, despite the dietary changes in the LE group that were applied at week 3 of pregnancy (gestational week 1: C=14.35±8.64 g, LE=11.05±9.75 g, P=0.89; gestational week 2: C=22.08±4.06 g, LE=21.59±2.91 g, P=0.87; gestational week 3: C=58.98±16.42 g, LE=69.82±11.48 g, P=0.59). However, body weight variations in lactating dams were higher in the LE group in comparison with the C group (Table 1). The student paired t-test indicated significant differences between the initial and final body weight. The control food consumption is important because indicate that higher levels of crude fiber and moisture in the LE diet not altered palatability or food intake. The FC and EE lactation coefficients also indicate decreases in efficiency (C=–0.84±0.90, LE=–5.48±1.54; P<0.05) and energy (C=–0.22±0.26, LE=–2.28±0.65; P<0.05) in the LE group, demonstrating that the LE diet impairs lactation performance despite similar levels of ingestion (Fig. 3).
Intragroup analysis was used to compare dams’ control (C) or low-energy diet (LE) according to body weight in grams during gestation (a) and lactation (b), as well as the range of increase in gram intake through lactation compared with its own food intake during pregnancy (c). Values expressed as means±s.e.m. **P<0.01; ***P<0.001 using paired Student’s ‘t’ test.

Feed conversion (a) and energy efficiency (b) of dams during lactation fed control (n=7) or low-energy (n=6) diet. Values are expressed as means±s.e.m.*P<0.05 v. control using unpaired two-tailed Student’s t-test.

Outcomes of consummation of low-energy diet from third gestational week to end of lactation in pregnancy and lactation performance of dams, birth weight and development of the offspring

d, day of maturation.
Values are means±s.e.m. or median (interquartile interval).
a Computed relative to the body weight on day of pregnancy.
b Computed relative to first day post parturition.
c Negative signs indicate loss of weight.
* Significantly different from control, P<0.05 using unpaired Student’s t-test.
# Significantly different from control, P<0.05 using non-parametric Mann–Whitney’s rank sum test.
Maternal diet during pregnancy did not significantly affect litter size (C=11.1±0.6; LE=10.4±0.6, P>0.05) or litter birth weight. The studentʼs paired t-test showed differences between initial and body weight end of the lactating dams fed with LE diet (265.2±10.0 v. 231.5±11.6 g, respectively; P=0.006), but there was no significant difference between the initial and final body weights of the C dams (263.2±9.1 v. 260.5±11.7 g, respectively; P>0.05).
There were no statistical differences in food consumption between the C and LE dams during pregnancy (gestational week 1: C=133.2±25.8 g, LE=123.0±44.5 g; gestational week 2: C=133.4±12.6 g, LE=127.1±38.7 g; gestational week 3: C=119.9±26.4 g, LE=135.6±13.3 g) or lactation (gestational week 1: C=140.1±51.4 g, LE=138.1±21.4 g; gestational week 2: C=214.4±43.8 g, LE=201.7±41.4 g; gestational week 3: C=257.4±36.5 g, LE=255.5±69.4 g; Fig. 4).
Absolute food intake (a) and weekly body weight (b) of dams during pregnancy and lactation fed with control (n=7) or low-energy (n=6) diet from the third pregnancy week until weaning. Values are expressed as means±s.e.m., P<0.05 using two-way RM ANOVA followed Bonferroni post hoc test.
Both groups of dams demonstrated a similar increase in percentage food intake throughout lactation compared with pregnancy. These increases were approximately 58% and 53% in the C and LE group, respectively (C=386.5±9.7 g and 611.9±42.2 g; LE=387.7±32.8 and 595.3±44.14 g during pregnancy and lactation, respectively; Fig. 2). This difference in LE dams demonstrated reduced body length and weight and delayed maturation compared with pups born to C dams (Table 1).
Metabolic parameters and organ weights in dams
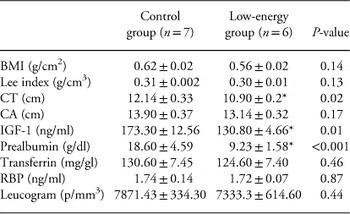
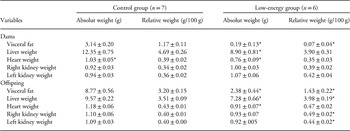
At weaning, we didnʼt find differences in anthropometric measurements, except thoracic circunference. But, LE dams demonstrated reduced plasma prealbumin and IGF-1 levels (Table 2). LE dams demonstrated reduced visceral fat, plasma prealbumin and plasma IGF-1 levels (Table 3). These biochemical parameters are important markers of acute malnutrition. We didnʼt find differences among relative organ weights of dams. The only exceptions were the absolute and relative levels of visceral fat (Table 3) that indicate the high mobilization of lipid storage in LE dams.
Anthropometric and biochemical parameter of dams after weaning fed with control or low-energy diet during pregnancy and lactation

BMI, body mass index; CT, thoracic circumference; CA, abdominal circumference; IGF-1, insulin-simile growth factor-1; RBP, retinol-binding protein.
Values are means±s.e.m. Data were analyzed by unpaired Student’s t-test.
* P<0.05 compared with control.
Visceral fat and organ weight of dams and offspring at 60 days old that were fed with control or low-energy diet during from third week of pregnancy and lactation

Values are means±s.e.m. Data were analyzed by unpaired Student’s t-test.
* P<0.05 compared with control. Litters according to mother’s diet constituted groups: control (n=14) and low-energy diet (n-12).
Nutritional status of pups from lactation through 60 days of age
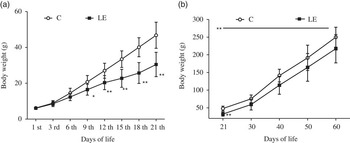
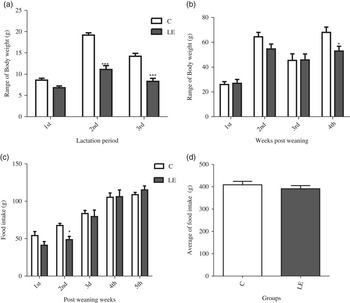
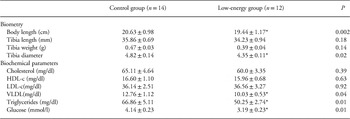
Offspring born to LE dams demonstrated significantly lower body weights during lactation (Fig. 5a) and after weaning (Fig. 5b). Lower body weight gain was observed in weeks 2–3 of lactation and week 4 after weaning (Fig. 6a). Although the total amount of food intake did not differ between groups, reduced food intake was observed 2 weeks after weaning. These differences in body weight were maintained until 60 days of age (Fig. 6a). At the end of the experimental period (60 days of age), the offspring of LE dams were smaller (Fig. 5b; Table 1) and demonstrated reduced plasma glucose, triglycerides and VLDL levels, as well as smaller tibia and reduced heart and liver weights (Table 4).
Body weight of pups born to dams fed a control (C, n=14) or low-energy (LE, n=12) diet from birth to weaning (a) and from weaning to 60 days old (b). Values are expressed as means±s.e.m., *P<0.05, **P<0.01 v. control using two-way repeated measures ANOVA followed by Bonferroni multiple comparison test.

Weekly body weight gain during lactation (a) and post weaning (b) and weekly food intake in grams postweaning to 60 days old (c) and average total food intake of post weaning to 60 days old (d) of the offspring born to dams fed with a control or a low-energy diet from the last week’s pregnancy until the end of lactation. *P<0.05 and **P<0.01 v. control using two-way ANOVA for repeated measures followed by Bonferroni multiple comparison test (a, b, c) and Student’s ‘t’ test (d). In all analysis, n=14–12 pups per group.

Biometry and biochemical parameter of rat of 60 days old, fed control or low-energy diet during pregnancy and lactation

Data were analyzed by unpaired Student’s t-test. Litters according to mother’s diet constituted groups: control (n=14) and low-energy diet (n=12).
* P<0.05 compared with control.
Litter size, body length and mortality did not differ between groups at birth (Table 1). However, the body lengths of the offspring of the LE dams were 6% less (Table 1) compared with body lengths of the offspring of the C dams at weaning (Table 4).
Smaller liver weights and higher kidney weights were noted in LE offspring in comparison with C offspring (Table 3). These results indicate that the hepatic tissue is vulnerable to nutritional insult and other peripheral organs are protected against energetic insult.
Discussion
Administering the LE diet to pregnant rats from week 3 of gestation through the lactation period affected lactation outcomes and induced deleterious effects on nutritional status and biochemical parameters in offspring. Pups born to LE dams demonstrated shorter body length, reduced body weight and delays in the opening of the eyes and ear canal. Reductions in body length and weight were maintained through 60 days of age, and plasma glucose, triglycerides and VLDL levels were reduced. However, the LE groups did not demonstrate differences in terms of litter size or pup weight. This finding suggests that administering isoenergetic diets during the first 2 weeks of pregnancy can provide sufficient energy and allow the build-up of adequate maternal reserves in the fat pads,Reference Herrera, Gomez-Coronado and Lasuncion 7 , Reference Bellinger, Lilley and Langley-Evans 29 which can then sustain fetal growth through the last week of pregnancy. Previous studies on low-protein diets through pregnancy report conflicting results regarding birth weight and litter size. Previous findings report low and unaffected weights at birth.Reference Bertin, Gangnerau and Bellon 14 , Reference Zhang, Li and Yang 30 These changes in both litter size and/or birth weight depend on food quality and macronutrient content, as well as the energy value of the maternal diet.Reference De Moura, Lisboa and Custódio 31 – Reference Nascimento, Omar and Delacourt 33
Recently, we reported that administering a low-protein diet through pregnancy and lactation does not alter pup birth weight, but does reduce the food intake of dams during lactation.Reference Nascimento, Omar and Delacourt 33 However, we did not observe any differences in food intake between lactating rats that received either the C or LE diet. Similar levels of intake were noted between our groups of lactating rats. These data corroborate our hypothesis about the effects of isolation of energy restriction without stress by limitation of food intake or reduction of feed.
Generally, lactating rats consume about two-fold to four-fold more energy than nonlactating rats. This is also associated with changes in the serum levels of insulin, leptin and thyroxine (T4).Reference Denis, Bing and Brocklehurst 34 Reducing food intake in dams during lactation makes it difficult to isolate the effects of protein restriction from the effects of calorie restriction.Reference Moretto, Ballen and Gonçalves 35 , Reference Sampson and Jansen 36
Furthermore, hypophagia was not noted in the lactating LE dams in this study, which can be partially explained by the proportion of macronutrients in the energetic diet and/or the adequate protein:energy ratio of the LE diet. Consequently, this finding allowed us to measure the actual effects of the LE diet without taking into account any confounding factors associated with reduced food intake.
In addition to the reduced growth of the pups, the LE diet resulted in acute undernourishment in the dams, as indicated by the reduced FC and EE coefficients and visceral fat, body weight, plasma IGF-1 and plasma prealbumin levels. Low plasma prealbumin is indicative of acute malnutrition.Reference Flint and Vernon 38 Proteins are hydrolyzed into their constituent amino acids when energy is scarce, which are then oxidized to provide additional energy. Energy is prioritized over protein synthesis; thus, energy scarcity mobilizes protein from the visceral fat, most especially into the liver tissue,Reference Marchini, Moriguti and Padovan 37 thereby inhibiting endogenous synthesis. This also explains the low serum prealbumin and IGF-1 levels that were noted in lactating rats. Meanwhile, low serum IGF-1 is directly associated with poor milk production because IGF-1 regulates growth hormone synthesis.Reference Flint and Vernon 38 In addition, low IGF-1 is indicative of negative energy balance, which results in the increased mobilization of triglycerides.Reference Picarel-Blanchot, Alvarez and Bailbe 39 Thus, the low body weight, visceral fat and hormone levels in dams suggest the greater mobilization of tissue and fat storage to maintain milk production when energy intake is limited.
Acute malnutrition in dams is reflected by the body mass of the offspring. At weaning, offspring born to LE dams demonstrated 12% and 40% reductions in body length and weight, respectively, compared with C offspring. In addition, pups born to the LE dams demonstrated delays in certain physical characteristics. For example, eye and ear openings were delayed in the LE group in comparison with the C group. Eyes in rodents typically open between postnatal days 12–14,Reference Stellwagen and Shatz 40 thereby influencing the development and plasticity of visual afferents. In contrast, auditory development is not complete before postnatal week 4.Reference Stellwagen and Shatz 40 Our results partly agree with previous studies reporting that low-protein diets and restricted food intake cause malnutrition in offspring.Reference Sutton, Centanni and Butler 41 , Reference Kwon, Kang and Nam 42 , Reference De Moura, Lisboa and Custódio 31 These results also confirm our initial hypothesis that the LE diet is less deleterious to the growth and development of offspring than other nutritional insults.
The underlying metabolic mechanisms that cause low serum glucose in undernourished offspring remain unclear. Plausible explanations for the low basal rate of glucose production are associated with hepatic glucose metabolism,Reference Desai, Gayle, Babu and Ross 11 the suppression of glucose synthesisReference Poore, Cleal and Newman 43 and insulin response,Reference Picarel-Blanchot, Alvarez and Bailbe 39 indicating that total body glucose metabolism is most responsive to insulin in both protein-calorie and food-restricted groups.
Both hypoglycemia and low plasma triglycerides are associated with insulin sensitivityReference Palou, Priego and Sánchez 32 and long-term insulin resistance in rats that are undernourished during perinatal life. However, a previous study reported that mice that receive energetic restriction during perinatal life demonstrate altered circadian physiology-related clock activities and lipid and glucose biosynthesis in the liver.Reference Fernandes, Carmo and Herrera 44 The reduced liver weights noted in this study can be explained by morphometric alterations and metabolic shifts. More recently, the presence of steatohepatitis was observed in lactating rats and offspring.Reference Kwon, Kang and Nam 42 Together, this evidence explains, partly, the altered blood glucose and lipid levels found in the offspring.
We also found that the pups in the LE group demonstrated shorter body lengths and smaller tibiae widths. Abnormalities in body size, as well as bone length and skeletal mineral content, can result in adverse outcomes in adulthood. Fernandes et al. Reference Fernandes, Abrue and Schanaider 45 reported persistent morphological changes in tibia growth in rats that received low-protein or restricted diets; more severe alterations are reportedly associated with the low-protein diet. In addition, Reichling and GermanReference Reichling and German 46 reported that protein-malnourished rats demonstrate the greatest duration of growth, probably because of developmental delays in epiphyseal fusion that are impossible during earlier periods of diaphyseal ossification. The same authors also report that less flexible structures are most affected by nutritional insults during growth (e.g., bone width) compared with structures that demonstrate extended periods of growth (e.g. bone length).Reference Reichling and German 46
In summary, here we report that administering LE diets to pregnant rats induces acute malnutrition. LE diets also jeopardize the growth and development of offspring and, over the short term, alter the plasma metabolic profile.
Acknowledgments
The authors thank LEAAL (Laboratório de Experimentação e Análise de Alimentos, Universidade Federal de Pernambuco) for analyzing the hypocaloric diet. We are also grateful to Francisco Bolaños-Jimenez for carefully reviewing this manuscript.
Financial Support
This work was partially supported by CAPES-COFECUB (Action Number Me 657/09), CNPq (number process 476841/2010-0), and CAPES.
Conflicts of Interest
None.
Ethical Standards
The experimental procedures were approved by the Ethical Committee of the Science Center of the Federal University of Pernambuco, Brazil (protocol no. 006025/2009-85), and followed the Guidelines for the Care and Use of Laboratory Animals.Reference Bayne 47