I. INTRODUCTION
Consumer products based on polymers are produced in large quantities to fulfill the needs of modern society. Automotive, shipbuilding, textile, electronic device, food packing, and healthcare are examples of industries that use polymeric resins derived from natural or synthetic sources in the manufacture of products with specific properties. Most applications use conventional commodity and engineering thermoplastics. However, polymers obtained from natural resources and biodegradable plastics have attracted increasing interest. Among these polymers, poly(3-hydroxybutyrate) (PHB) is a very promising material. PHB is a semicrystalline thermoplastic polymer, completely biodegradable and biocompatible, obtained from renewable resources. Nowadays it has been used in a number of industrial applications, including packing, food containers, prosthesis, suture threads, devices for controlled drug release, containers for plant germination, and blankets for pesticides release, etc.
As crystalline polymer, PHB has been studied on its crystallization and melting behavior and also on ways to control the microstructure. The physical behavior of this polymer depends on the crystallization conditions during processing, and there is still much to be learned about the way these materials respond to thermal treatment. Ongoing research intended to establish PHB's properties and optimize its processing conditions is reported in the literature with the expectation of extending the range of its application. The material properties of semi-crystalline polymers are controlled by molecular and supra-molecular structures that are frequently determined by the crystallization mechanisms. Consequently, the study of the crystallization and melting behavior is critical to understand and control the material properties and the processing required to obtain them. Reference Bastioli1–Reference Reddy, Ghai and Kalia10
For a number of reasons, polymer materials, including PHB, are modified with natural or synthetic fillers. Carbon black (CB) is one of the main fillers used by rubber and plastic industries, owing to its outstanding characteristics like high surface area, high thermal and electric conductivity and strong (black) color. CB is virtually pure elemental carbon in the form of colloidal particles that are produced by the incomplete combustion or thermal decomposition of gaseous or liquid hydrocarbons under controlled conditions. Besides the use as a reinforcing filler, CB can also improve the lifetime or products due to its action as an ultraviolet stabilizer and be an antistatic agent. Examples of industrial products that use CB as a filler include rubber products, such as belts, hoses, gaskets, diaphragms, vibration isolation devices, bushings, and air springs. It is also used in the aerospace industry in elastomers for aircraft vibration control components such as engine mounts. CB is in the top 50 industrial chemicals manufactured worldwide. Reference Mucha, Marszałek and Fidrych11–Reference del Rı́o, Ojeda and Acosta17
As finely divided filler with good physical interactions to polymers, CB can also be used as a nucleating agent, affecting both the crystallization and melting behavior. Reference Wunderlich18,Reference Wunderlich19 This effect in PHB is the main objective of this article. The crystallization and melting of PHB and PHB/CB compounds with CB content ranging from 0.5 to 10% were investigated by differential scanning calorimetry (DSC), applying thermal cycles of heating/cooling/reheating at rates ranging from 2 to 32 °C/min. DSC tests revealed that PHB and its compounds may be crystallized from the molten state, hereinafter named melt crystallization, as well from the amorphous solid state, a phenomenon known as cold crystallization. The characteristic phase change temperatures and temperature intervals, the rate of phase change, and the amount of each phase involved in the change were determined in terms of the cooling and heating rates as well as the CB content. The effect of CB on the morphology of PHB was analyzed by means of optical microscopy (OM).
II. EXPERIMENTAL
A. Materials
The PHB polymer, a random copolymer with approximately 4% of 3-hydroxyvalerate units, was supplied by PHB Industrial SA (Brazil) and its thermal transition temperatures are presented in Table I. Melt crystallization (T mc), cold crystallization (T cc), and melting peak (T mp) temperatures were obtained during cooling and reheating, respectively, according to ASTM D 3418 and using a cooling/heating rate of 12 °C/min.
Thermal transition temperatures of PHB (data by the authors).

CB grade N339 (ASTM D 1760), commercial name Vulcan-M, was purchased from Cabot Brasil; it is indicated to be used as a reinforcing filler and pigment for elastomers and thermoplastics. According to manufacturer's literature, N339 presents a moderately large surface area of 93 m2/g (CTAB, ASTM D 3775), low abrasiveness, high tinting strength, and an apparent density of 0.35 g/cm3 (ASTM D 1513); it absorbs 120 cm3 DBP/g in standard tests (ASTM D 2414). 20 Correlations reported in the literature Reference Medalia and Richards21 suggest a mean diameter of 120 nm for the aggregates, the smallest structures we hope to disperse into the polymer matrix.
B. Methods
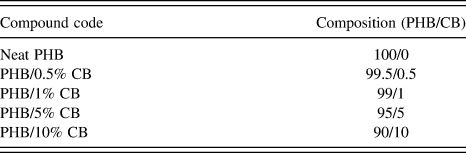
Before mixing, the PHB and CB were oven-dried at 80 °C for 6 h under forced air circulation to remove humidity and, therefore, minimize PHB degradation during processing. The components were mixed for 10 min using a Haake Rheomix 600 laboratory internal mixer (Haake Technik GmbH, Vreden, Germany) fitted with high intensity (roller type) rotors with the chamber wall kept at 190 °C and the nominal rotors speed set to 60 rpm. The CB content ranged from 0.5 to 10% by weight, according to Table II.
Compositions of the compounds studied.

C. DSC measurements
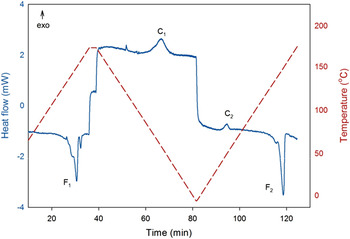
Thermal analysis was performed in a TA Instruments DSC Q20 V24.9 differential scanning calorimeter (Newcastle, Delaware), under a nitrogen flow of 50 mL/min to minimize oxidative degradation, to which the PHB is susceptible. Reference Gogolewski, Jonanovic, Perren, Dillon and Hughes8,Reference El-Hadi, Schnabel, Straube, Müller and Riemschneider22 Samples of approximately 5 mg were wrapped with aluminum foil to minimize the effect of the polymer thermal conductivity, which may cause differential broadening and shifting of peak positions. Reference Wagner23 A new specimen was used for each run. A blank curve was obtained for each heating/cooling/reheating stage to ensure that no contamination of the instrument had taken place. A thermal cycle of four stages was used: (i) heating from room temperature (approximately 30 °C) to 195 °C (first heating stage); (ii) the samples were held at this temperature for 3 min to eliminate any residual crystallinity and erase the previous thermal history; (iii) the melt was cooled to 20 °C (cooling stage) and then (iv) reheated to 195 °C (second heating or reheating stage). Tests were run at constant rates of heating and cooling of 2, 4, 6, 8, 12, 16, 24, and 32 °C/min. Figure 1 shows a typical DSC output with the indicated cycles. Four thermal events were identified in most DSC tests, namely, melting during the first heating stage (F 1), melt crystallization during cooling (C 1), cold crystallization during reheating (C 2), and finally, a second melting event (F 2).
Typical DSC output for PHB heating/cooling/reheating at 6 °C/min (exothermic peaks up), showing the phase change events: first melting (F 1), melt crystallization (C 1), cold crystallization (C 2), and second melting (F 2).

For each thermal event, the starting and end points of departure from the underlying baseline were visually established in a plot of energy flow (J) versus time (t). The fractional crystallization (or melting) x for the event was computed as a function of time by integration Reference Menczel and Prime24 :
 $$x(t) = {1 \over {{E_0}}}\int_{{t_1}}^t {\left| {J(t') - {J_0}(t')} \right|{\rm{d}}t'\quad ,}$$
where J 0 is the virtual baseline during the event (a straight line in the present case), and E 0 is the total latent heat of the phase change:
 $${E_0} = \int_{{t_1}}^{{t_2}} {\left| {J(t) - {J_0}(t)} \right|{\rm{d}}t} \quad ,$$
where t 1 and t 2 are the initial and final times. The rate of the phase change (crystallization or melting) c is simply:
 $$c(t) = {{{\rm{d}}x} \over {{\rm{d}}t}} = {{\left| {J(t) - {J_0}(t)} \right|} \over {{E_0}}}\quad ,$$
from which the peak (maximum) and average crystallization rates may be computed. The fractional crystallization/melting x and the rate of crystallization/fusion c may be expressed as functions of temperature (T) by knowing the linear relationship between time and temperature during the event:
 $$T = {T_1} + \phi \left( {t - {t_1}} \right)\quad ,$$
where T 1 is the sample temperature at the starting point t 1, and ϕ is the (constant) rate of heating or cooling during the event. The specific latent heat of crystallization or melting (or enthalpy, because the phase change occurs at constant pressure) is computed from E 0, the polymer fraction w P and the sample mass m S:
 $$\Delta H = {{{E_0}} \over {{w_{\rm{P}}}{m_{\rm{S}}}}}\quad .$$
The mass crystallinity change ΔX
c during the event is estimated, taking into account the heat of fusion of PHB 100% crystalline
 $\Delta H_{\rm{m}}^0$
:
 $$\Delta {X_{\rm{c}}} = {{\Delta H} \over {\Delta H_{\rm{m}}^0}}\quad .$$
A value of
 $\Delta H_{\rm{m}}^0 = 146\;{{\rm{J}} \mathord{\left{\vphantom {{\rm{J}} {\rm{g}}}} \right\kern-\nulldelimiterspace}/ {\rm{g}}}$
at the equilibrium melting temperature
 $T_{\rm{m}}^0 = 185{\;^ \circ }{\rm{C}}$
was previously reported in the literature.
Reference Barham, Keller, Otun and Holmes25
D. Optical microscopy
OM images were obtained using a Hinox model KH 1300 series H05008. Selected samples were melted on glass slides in a hot stage, and images were acquired during and after cooling.
III. RESULTS AND DISCUSSION
A. DSC measurements
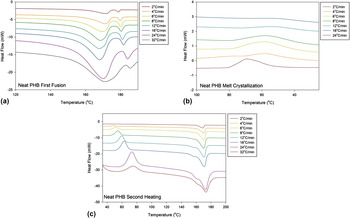
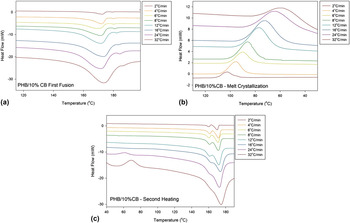
DSC scans of neat PHB and PHB with 10% CB acquired during the heating, cooling, and reheating stages are shown in Figs. 2 and 3, respectively for various scanning rates. In the first melting [Figs. 2(a) and 3(a)], both types of samples showed complex (double) endothermic peaks under the different heating rates: the main melting peak followed by a minor peak at a higher temperature. Figures 2(b) and 3(b) present the DSC scans obtained during the cooling stage; exothermic peaks can be observed in some plots due to the melting crystallization of PHB, which is strongly dependent on the cooling rate and the CB content. For the second heating [Figs. 2(c) and 3(c)], some plots had an exothermic peak due to the cold crystallization of the PHB and an endothermic peak due to melting, but most of them appeared as complex endothermic peaks, where a shoulder or a minor peak is followed by the main peak. These events are related to the second fusion of PHB.
DSC scans of neat PHB obtained during the heating (a), cooling (b), and reheating (c) stages using different scanning rates.

DSC scans of PHB with 10% CB obtained during the heating (a), cooling (b), and reheating (c) stages using different scanning rates.

In general, the endothermic peaks have better definition and are sharper for the second heating possibly due to the molecular rearrangement conducting to a more homogeneous PHB. Note that the first heating refers to the melting of PHB as obtained from processing whereas the second heating refers to the melting of PHB obtained during the more controlled cooling stage of the experiment. The most notable feature of the melting events for neat PHB and its compounds is the structure of the peaks. During the first heating, the main melting peak is followed by a minor peak at a higher temperature. During the second heating stage, the relative position of the major and minor peaks is reversed, with the main melting peak preceded by a minor peak (shown as a shoulder for neat PHB) at a lower temperature. The pattern is repeated for all the PHB/CB compounds tested and also observed for PHB/natural fiber compounds, as reported elsewhere. Reference Cipriano26 It is plausible to assume that stable and perfect crystals may have been developed during heating and cooling cycles. Hence, these new crystals, major peak constituent, should need more energy to melt, and thus are visualized in the higher temperature regions.
It is worth noting that the total area under the peaks (i.e., proportional to the PHB crystallinity) is relatively insensitive to both the heating rate and filler content. It is common practice to assume that the second melting (during the reheating stage) represents the “true” melting behavior of the polymer, as the first melting is affected by the unknown thermal history of the sample, obtained during processing. According to some authors, Reference Gunaratne and Shanks9,Reference Papageorgiou and Panayiotou27–Reference Beekmans, van der Meer and Vancso36 the complex peaks appearing in the fusion region may originate from (i) melting, recrystallization and re-melting during heating, (ii) the presence of more than one crystal modification (polymorphism), (iii) different morphologies (lamellar thickness, distribution, perfection or stability), (iv) physical aging or/and relaxation of the rigid amorphous fraction, or (v) different molecular weight species. While these explanations may be true in general, we have observed previously Reference Almeida37 that PHB is very sensitive to temperature and may degrade, to an uncertain degree, during the first heating stage, even in the presence of nitrogen as we used here. Thus, the PHB that melts during the reheating may not be the same polymer that melts during the first heating stage. This may have some influence on the observed difference in the melting peak patterns.
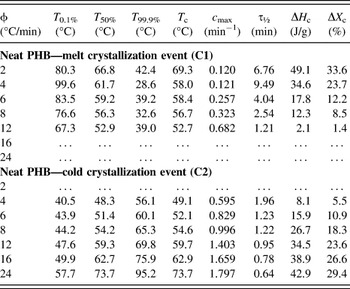
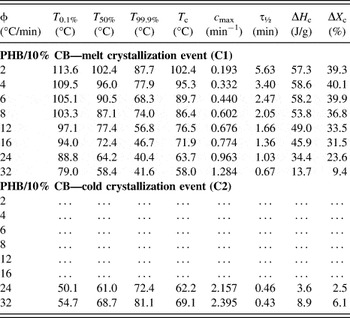
A small amount of crystallization from the melt was observed during the cooling stage in neat PHB [Fig. 2(b)], whereas this is the main form of crystallization in the compounds with 10% CB [Fig. 3(b)]. The crystallization from the melt was seen for cooling rates ranging from 2 to 12 °C/min for neat PHB and between 2 and 32 °C/min for the compound with 10% CB. The cold crystallization, i.e., the exothermic peaks in Figs. 2(c) and 3(c), was observed for the heating rates ranging from 4 to 32 °C/min in neat PHB but only at 24 and 32 °C/min for PHB/10% CB. The cooling and reheating rates therefore affect the phase transition, as an increase in the cooling rate shifts the exothermic peaks to lower temperatures during the melt crystallization, while an increase in the heating rate shifts the peaks to higher temperatures during the cold crystallization, as seen in Figs. 2(c) and 3(c). From these observations we can deduce that a rational control of crystallinity may be reached according to the cooling rates used during processing since it has a direct effect on the final properties of PHB products. In general, the crystalline is the PHB, more brittle and harder are the plastic products made from it.
The CB filler behaves as a nucleating agent, accelerating the crystallization of PHB, whether in melt or cold crystallization, which may be confirmed by the thermograms of Figs. 2 and 3 and also by the analyses of the T 0.01 and c max parameters presented in Tables III and IV further on. During cooling, melt crystallization starts at higher temperatures for CB compounds [Fig. 3(b)], and during the second heating, cold crystallization starts at higher temperatures for neat PHB [Fig. 2(c)]. The maximum crystallization rate, c max, increases with the cooling and heating rates as well as with the increase of CB content. This trend may be indicative of a faster crystallization rate in the compounds. Reference Mucha, Marszałek and Fidrych11,Reference Razavi-Nouri, Ghorbanzadeh-Ahangari, Fereidoon and Jahanshahi13,Reference Papageorgiou, Zhuravlev, Papageorgiou, Bikiaris, Chrissafis and Schick16,Reference del Rı́o, Ojeda and Acosta17,Reference Almeida37 Tables in the Supplementary Material show several parameters for the crystallization and melting events observed in neat PHB and PHB/10% CB.
Nonisothermal crystallization parameters of neat PHB.

Nonisothermal crystallization parameters of PHB/10%CB.

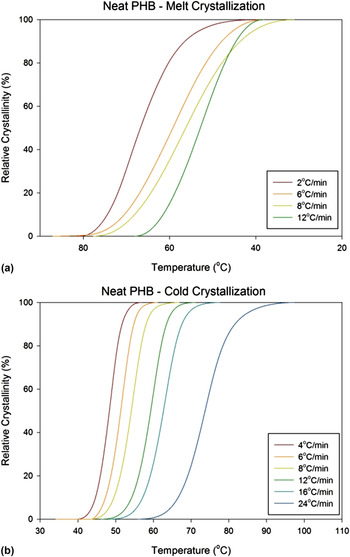
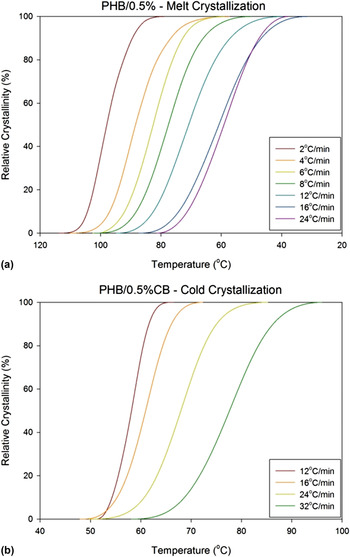
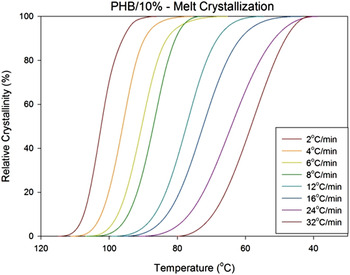
Figures 4–6 present the development of the relative crystallinity as function of temperature for neat PHB, PHB/0.5% CB and PHB/10% CB compounds, respectively; the data were obtained from DSC thermal scans during melt and cold crystallization, as indicated. All plots have the sigmoidal shape characteristic of phase transformation in polymers. One can see the displacement of the plots to lower temperatures with increasing cooling rates during the melt crystallization process and the opposite trend for cold crystallization, which means that for higher cooling rates, melt crystallization takes place at lower temperatures, and for higher heating rates, cold crystallization occurs at higher temperatures. This is a consequence of the time dependence of the crystallization of polymers Reference Wellen, Canedo and Rabello38 and, hence, the phase transition of PHB may be controlled by varying the cooling/heating rates. Studies conducted by several authors showed that the rates applied during crystallization have a direct influence on the polymer morphology. Reference Gunaratne and Shanks9,Reference Mucha, Marszałek and Fidrych11,Reference Furushima, Nakada, Takahashi and Ishikiriyama28,Reference Owen, Heinzel, Škrbić and Divjaković29,Reference Almeida37,Reference Finelli, Siracusa, Lotti, Marchese and Munari39
Relative crystallinity (%) versus temperature (°C) for neat PHB. (a) Melt crystallization. (b) Cold crystallization.

Relative crystallinity (%) versus temperature (°C) for PHB/0.5% CB compound. (a) Melt crystallization. (b) Cold crystallization.

Relative crystallinity (%) versus temperature (°C) for PHB/10% CB compound, acquired during melt crystallization.

As observed in the DSC scans presented in Figs. 2 and 3, an increase in the cooling rate may result in the suppression of crystallization during cooling, depending on the composition. For the neat PHB, melt crystallization was observed only at cooling rates below 12 °C/min; for the PHB/0.5% CB melt crystallization is suppressed above 24 °C/min, while in PHB/10% CB, the polymer crystallizes from the melt at all cooling rates tested. Here we have a direct effect of the time released to the crystallization mechanisms to take place, under high rates the crystalline fraction doesn't have enough time to nucleate and growth, under high cooling rates the solid state is quickly reached, before crystals were developed. This behavior is a consequence of the chemical structure of PHB. The relatively large side groups make the molecule segment less capable to rearrange to nucleate crystals. The nucleation rate is reduced and, when it occurs at lower temperature, the molecule mobility is not sufficient to promote crystal growth. On the other hand, the nucleating effect of CB increases the nucleation temperature and, hence, allows crystal growth to take place at higher temperatures. The consequence is a faster overall crystallization (Figs. 4–6) and, therefore, the observation of melt crystallization peaks on DSC thermograms [as in Fig. 3(b)].
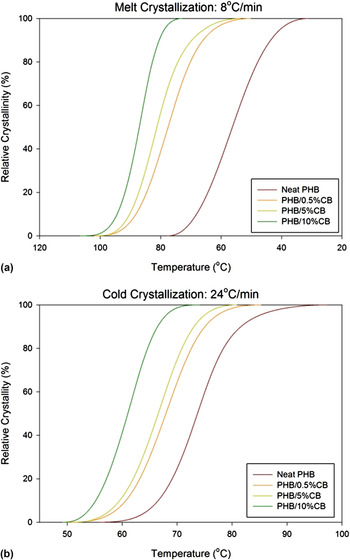
Figure 7 shows the effect of CB content on the PHB melt crystallized at 8 °C/min and on the PHB cold crystallized at 24 °C/min, respectively. These rates were chosen because all compositions may be observed for each event considered. The content of CB added to PHB in this work ranged from 0.5 to 10%, so that it may be viewed as an additive at the lowest content, i.e., 0.5 wt%, and as a filler at higher concentrations. In both cases, the CB may act as a nucleator, promoting the crystallization of PHB, whether during melt or cold crystallization. One may observe the displacement of the sigmoid plots in Fig. 7 to higher and lower temperatures during the melt and cold crystallization, respectively. Reference Mucha, Marszałek and Fidrych11,Reference Papageorgiou, Zhuravlev, Papageorgiou, Bikiaris, Chrissafis and Schick16
Relative crystallinity (%) versus temperature (°C) obtained at 8 °C/min obtained during (a) melt crystallization, (b) cold crystallization. Compositions indicated.

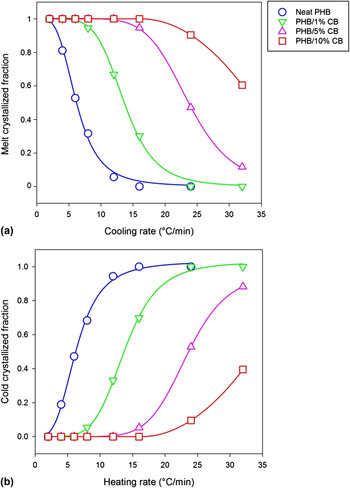
The balance between melt and cold crystallization is analyzed in terms of the fraction of PHB crystallized in each event during a given test, according to Eq. (7):
 $${f_{\rm{M}}} = {{\Delta {X_{\rm{c}}}\left( {{C_1}} \right)} \over {\Delta {X_{\rm{c}}}({C_1}) + \Delta {X_{\rm{c}}}\left( {{C_2}} \right)}},\quad <$$><$$>{f_C} = {{\Delta {X_{\rm{c}}}({C_2})} \over {\Delta {X_{\rm{c}}}({C_1}) + \Delta {X_{\rm{c}}}({C_2})}} = 1 - {f_{\rm{M}}}\quad ,$$
where f M and f C are fractions of PHB melt and cold crystallized, and ΔX c(C 1) and ΔX c(C 2) are the crystallinities observed during the melt (C 1) and cold (C 2) crystallization events.
The results are plotted in Fig. 8. The melt crystallized fraction follows a perfect sigmoid as a function of cooling rate, from f M =1 at very low cooling rates to f M = 0 at very high rates. The data suggest that at high cooling rates, not all crystallizable polymer is able to crystallize from the melt, as PHB crystallization is relatively slow and requires large undercooling. On the other hand, the cold crystallization temperature and rate depend mostly on the heating rate during the second heating stage, while the amount that crystallizes in this stage probably depends more on the cooling rate of the previous stage than on the heating conditions. The sigmoids are shifted to higher cooling rates for higher CB contents, suggesting that the filler facilitates the melt crystallization process, acting as a nucleating agent. Reference Almeida37,Reference Wellen, Rabello, Araújo, Fechine and Canedo40
Melt crystallized fraction versus cooling rate, (a). Cold crystallized fraction versus heating rate, (b). Compositions indicated.

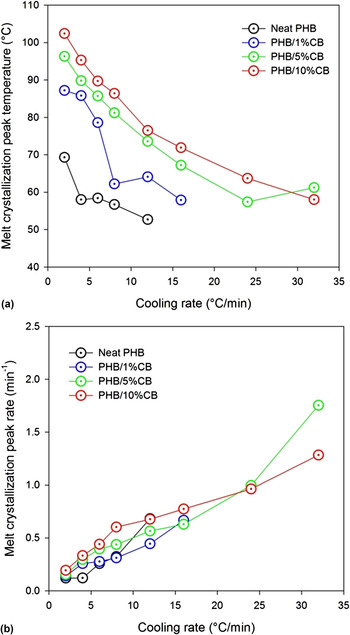
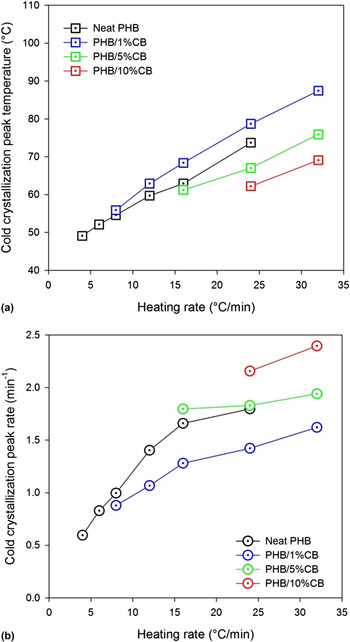
For a given cooling/heating rate and CB content, the melt crystallization temperature is higher than the cold crystallization temperature, as shown in Figs. 9 and 10. The melt crystallization temperature decreases with an increase in the cooling rate and increases with an increase in the filler content. The melt peak crystallization rates are proportional to the cooling rate and fairly independent on the CB content. The cold crystallization temperature and rate increase with an increase of the heating rate; their dependence on filler content is less clear, but in general, the temperature decreases and the rate increases with an increase in the CB content.
Peak crystallization temperature (a) and maximum rate (b) for melt crystallization of PHB in neat resin and CB compounds as functions of the cooling rate.

Peak crystallization temperature (a) and maximum rate (b) for cold crystallization of PHB in the neat resin and CB compounds as functions of the heating rate.

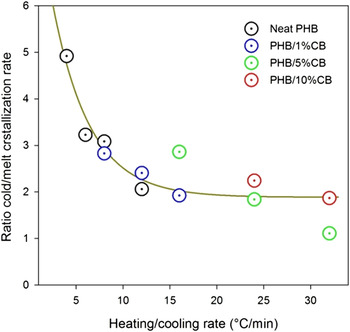
Figure 11 shows the ratio of the cold peak crystallization rate to the melt peak crystallization rate for all tests in which both crystallization events were observed. The ratio depends on the cooling/heating rate, particularly for rates below 12 °C/min, but only weakly on CB content. As the heating/cooling rate increases, the cold crystallization become slower whereas the melt crystallization becomes faster. This is a direct consequence of the nucleation rate, which is normally the main controller factor on crystallization. Reference Wunderlich18,Reference Wunderlich19 At higher heating rate, there is no much time available for nucleation and, therefore, few nucleation sites are formed, reducing the overall rate of cold nucleation. On the other hand, the faster the cooling rate from the melt, more stable nuclei are formed since they are destroyed at high temperatures.
Ratio of peak rates of cold and melt crystallization as a function of the cooling/heating rate for several CB loading levels.

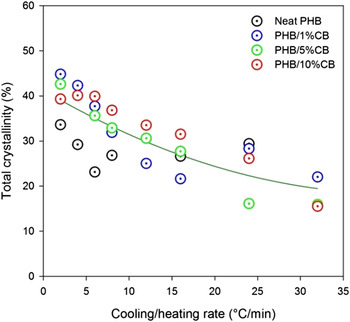
The total crystallinity developed during the crystallization events (melt and cold) estimated using the procedures described in Sec. II is plotted in Fig. 12. The crystallinity decreases as the cooling/heating rate increases, from approximately 40% at 2 °C/min to approximately 20% at 32 °C/min; it is virtually independent of filler content; even considering the high uncertainty of DSC estimates of crystallinity, Reference Wellen, Rabello, Fechine and Canedo41 the observed drop in crystallinity is significant and it is linked to the suppressed crystallization under effect of fast cooling and heating process.
Total crystallinity developed during melt and cold crystallization as function of the cooling/heating rate for several CB loading levels.

The crystalline phase generated during cooling of the melt (melt crystallization) and the early stages of the second heating (cold crystallization) must be equal to the total amount of material melted during the second melting stage. However, the crystallinity estimated during this last event is approximately 42% and independent of the heating rate and filler content.
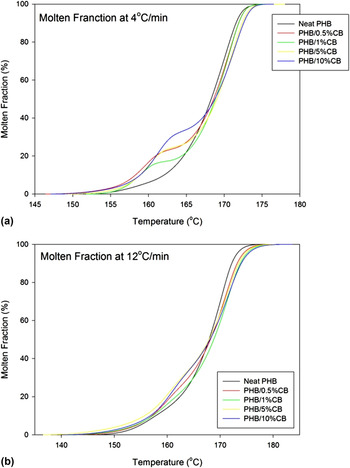
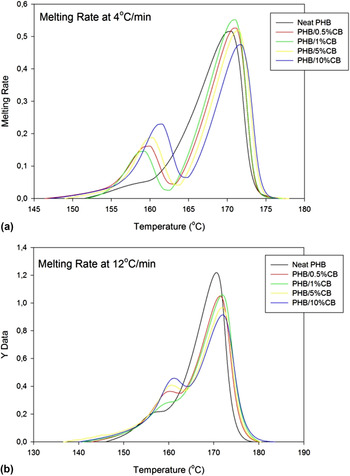
The effect of complex peaks on the molten fraction of PHB is given in Fig. 13 as a break of the sigmoid, which is more evident at lower heating rates. Figure 14 shows the effect of CB on the melting rate of PHB (see tables in the Supplementary Material). Adding CB to PHB decreases the melting rate in a trend opposite to that observed for crystallization rates. This effect may be connected to the changes in total crystallinity for different CB levels, as shown in Fig. 12. At lower rates, when the thermal environment during the experiment may be more stable, the increase in crystallinity is clear. Two events may promote the observed behavior: (i) the formation of more crystalline structures (possibly with different thermal stabilities) in PHB/CB compounds and (ii) the development of a denser amorphous phase in samples with a larger CB content, which is rejected from the crystalline growth zone during the crystallization process.
Molten fraction as function of temperature (°C) for neat PHB and PHB/CB compounds. Compositions indicated.

Melting rate versus temperature (°C) of neat PHB and PHB/CB compounds. Compositions indicated.

B. OM images
OM images of neat PHB and PHB/CB compounds are presented in Figs. 15–17. These images were captured during the cooling from the molten state, immediately after cooling, and 24 h later; in the last case, samples were maintained for 24 h at ambient temperature (25 °C).
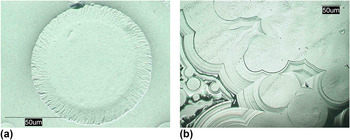
OM images of a PHB spherulite growing in a PHB/0.5% CB compound during cooling (a) and the lamellar structure in a PHB/5% CB compound (b).

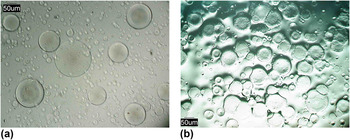
OM images in neat PHB (a) and PHB/10% CB (b) immediately after cooling.

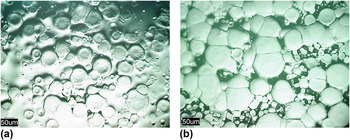
OM images in PHB/10% CB immediately after cooling (a) and after 24 h (b).

Figure 15(a) shows a PHB spherulite growing in a PHB/0.5% compound, and Fig. 15(b) shows a high magnification image of the lamellae. Figure 16 compares the crystalline growth in neat PHB and PHB/10% CB. The images, taken immediately after melt crystallization, show the effect of CB on the number of crystals developed during the event. This is a consequence of the nucleation effect of CB and it is consistent to the DSC results shown previously. Figure 17 illustrates the effect of time, showing the continuing crystal growth during storage at ambient temperature, after the crystallization process is supposedly finished. The progression of crystallization after processing and the room temperature is rather common with some polymer and it is called secondary crystallization REF (reference). It is normally related to the organization of molecules onto pre-existing crystals in the interlamellar regions REF. The images shown in Fig. 17 is a remarkable change in morphology and include also spherulite impingement. This effect might have a strong influence, both related to PBH investigation but also to product physical properties which may change in short periods after processing.
IV. CONCLUSIONS
Cooling and heating rates have a strong influence on phase transitions of PHB and its composites with CB. Increasing the cooling rate results in lower melt crystallization temperatures and promotes higher crystallization rates. Increasing the heating rate has the opposite effect on the cold crystallization temperature. However, cold crystallization rates increase with the heating rate. The addition of CB has a significant effect on the melt crystallization temperature, lowering the undercooling required to start the process, thus acting as a nucleator. The effect of CB on the cold crystallization temperature is not clear but it increases the cold crystallization rate. The melting temperature and rate are minimally affected by both the heating rate and CB content. The complex melting peaks observed in PHB show patterns of minor/major temperature and rate distribution that differ in the first and second melting events. These patterns, virtually independent of the heating rate, are affected by the CB content. CB interferes with the PHB crystallization process, promoting the formation a larger number of crystals. PHB crystallization continues after cooling, during storage at ambient temperature with significant changes in morphology.
Supplementary Material
To view supplementary material for this article, please visit http://dx.doi.org/jmr.2015.287.
ACKNOWLEDGMENTS
Authors would like to thank PHB Industrial SA (Brazil) for kindly supplying PHB resin, and Ms. Maria do Bom Conselho Vitorino and Mr. Alceu Black for preparing the compounds. R.M.R.W. thanks CNPq/Brazil (MCTI/CNPq N 14/2012—Process No. 478124/2012-0) and E.L.C. thanks to FACEPE/PE/Brazil for the financial support.