

INTRODUCTION
The Atlantic bluefin tuna, Thunnus thynnus (Linnaeus, 1758), is a pelagic teleost that ranges across the North Atlantic Ocean and the Mediterranean Sea (Mather et al., Reference Mather, Mason and Jones1995). Between the 1970s and 2000s, the highly profitable fishery of this species led to severe depletion of the stocks, though the eastern population now seems to show signs of recovery as a result of effective conservation measures recently implemented by the International Commission for the Conservation of Atlantic Tunas (ICCAT, 2012). A better understanding of foraging habits at early stages of the life history is essential in fish conservation and management strategies as they significantly influence the recruitment (Young & Davis, Reference Young and Davis1990) and hence the sustainability of populations and their capacity for supporting commercial fisheries. At the end of spring, young Atlantic bluefin tuna migrate to the Bay of Biscay foraging ground (Goñi & Arrizabalaga, Reference Goñi and Arrizabalaga2010), where, as revealed by stomach-content analyses (SCAs), they feed mainly on anchovy (Engraulis encrasicolus), northern krill (Meganyctiphanes norvegica), horse mackerel (Trachurus trachurus) and blue whiting (Micromesistius poutassou) (Ortiz de Zárate & Cort, Reference Ortiz de Zárate and Cort1986; Logan et al., Reference Logan, Rodríguez-Marín, Goñi, Barreiro, Arrizabalaga, Golet and Lutcavage2011).
Given that diet determinations from SCA may be sometimes inaccurate (Varela et al., Reference Varela, Rodríguez-Marín and Medina2013), complementary stable-isotope analyses (SIAs) have been increasingly used to investigate the foraging ecology of marine fish (Bode et al., Reference Bode, Alvarez-Ossorio, Cunha, Garrido, Peleteiro, Porteiro, Valdes and Varela2007; Kadye & Booth, Reference Kadye and Booth2012). The suitability of SIA to understand interactions in the marine food web relies on the fact that the isotopic composition of consumers depends on the isotopic signatures of their prey. Whereas SCA provides a narrow temporal window or ‘snapshot’ of diet compositions, SIA incorporates isotopic data from food sources consumed over a broad period of time (i.e. weeks to months, Peterson & Fry, Reference Peterson and Fry1987; Hobson et al., Reference Hobson, Schell, Renouf and Noseworthy1996). Carbon stable-isotope ratios (δ 13C) are often used as dietary source indicators (Pinnegar & Polunin, Reference Pinnegar and Polunin2000), while the nitrogen isotope value (δ 15N) is a suitable index of the consumer's trophic position (Minagawa & Wada, Reference Minagawa and Wada1984; Jennings et al., Reference Jennings, Maxwell, Schratzberger and Milligan2008). Additionally, the isotopic composition of fish tissues and their most common prey allows the estimation of dietary proportions applying mixing models (Phillips & Gregg, Reference Phillips and Gregg2001; Parnell et al., Reference Parnell, Inger, Bearhop and Jackson2010). In this study, SCA, SIA and stable-isotope mixing model analyses were integrated to assess diet compositions of young Atlantic bluefin tuna captured in the Bay of Biscay.
MATERIALS AND METHODS
Sampling and stomach-content analysis (SCA)
Atlantic bluefin tuna (N = 65), ranging between 62 and 127 cm in straight fork length and between 5 and 40 kg in body mass, were caught by baitboat at the south-east corner of the Bay of Biscay in summer (2008–2010) (Figure 1). The fish were captured during daytime and the main bait species used in the fishing operations were horse mackerel (Trachurus trachurus), anchovy (Engraulis encrasicolus), Atlantic mackerel (Scomber scombrus), bogue (Boops boops) and sardine (Sardina pilchardus). The tuna age, which was estimated from direct reading on the first ray of the first dorsal fin or from age–length curves (Rodríguez-Marín et al., Reference Rodríguez-Marín, Clear, Cort, Megalofonou, Neilson, Neves dos Santos, Olafsdottir, Rodriguez-Cabello, Ruiz and Valeiras2007), ranged between 1 and 4 years. Whole stomachs and samples of muscle and liver were collected from most of the fish (Table 1), the muscle samples being removed from the caudal peduncle. All samples were preserved in ice on-board and stored at –20°C in the laboratory.
Atlantic bluefin tuna (ABFT) were collected in the Bay of Biscay (●).

Sample collection summary of bluefin tuna captured by baitboat in the Bay of Biscay during 2008 and 2010.

The contents of 36 stomachs were analysed for prey identification (Table 2). They were washed through a sieve of 1000 µm mesh size. Identification of taxa was made to the lowest possible taxonomic level. The size and colour of the gall bladder and texture of the stomach lining were checked visually to determine whether the food items found in the stomach contents were actually natural prey or fishing bait (Talbot & Higgins, Reference Talbot and Higgins1982). Prey items assumed to be bait were not considered in the analyses, and the stomachs containing only bait were classified as empty (N = 16). Fish otoliths and cephalopod beaks were used for identification of partially digested prey. The dietary importance of each food item was assessed by the following indices:
-
– frequency of occurrence: %Oi = (number of stomachs containing prey item i/total number of non-empty stomachs) × 100;
-
– percentage of weight: %Wi = (weight of prey item i/total weight of all prey items) × 100;
-
– alimentary index: %AIi = (%Wi × %Oi)/100 (Lauzzane, Reference Lauzanne1975).
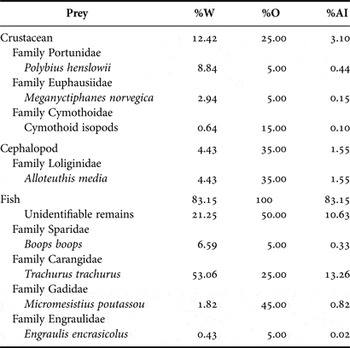
Stomach contents of bluefin tuna captured by baitboat in the Bay of Biscay during 2008 and 2010. Percentage of weight (%W), ocurrence (%O) and alimentary index (%AI).

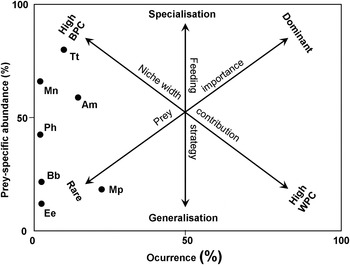
Feeding patterns were assessed using the graphical analysis proposed by Amundsen et al. (Reference Amundsen, Gabler and Staldvik1996). This procedure, which is a modification of the graphical method of Costello (Reference Costello1990), provides information about prey importance and feeding strategy of the predator by evaluating a two-dimensional plot of prey-specific abundance (%Pi) against %Oi (see Figure 2), with %Pi = (∑prey i weight/∑weight of all prey in the stomachs containing prey i) × 100.
Prey-specific abundance plotted against frequency of occurrence of prey species for young bluefin tuna (Thunnus thynnus) from the Bay of Biscay. Explanatory axes for foraging patterns are those of Costello (Reference Costello1990) as modified from Amundsen et al. (Reference Amundsen, Gabler and Staldvik1996). The two diagonal axes represent the importance of prey (dominant vs rare) and the contribution to the niche width (high between-phenotype vs high within-phenotype contribution); the vertical axis defines the predator feeding strategy (specialist vs generalist). Am, Alloteuthis media; Bb, Boops boops; Ee, Engraulis encrasicolus; Mn, Meganyctiphanes norvegical; Mp, Micromesistius poutassou; Tt, Trachurus trachurus.

Stable-isotope analysis (SIA)
Stable-isotope analysis was carried out in 65 muscle samples from tuna captured in 2008–2010, and 32 liver samples taken in 2008 and 2010. Each tissue sample was rinsed with distilled water, freeze-dried for 48 h, and ground to powder. Half of this sample was used for δ 15N analysis, and the remainder was treated for lipid extraction prior to δ 13C analysis (Varela, et al., Reference Varela, Larrañaga and Medina2011). All carbon and nitrogen isotope data are reported in δ notation according to the following equation:
 $$\delta X = \left[{\left({\displaystyle{{R_{\rm sample}}} \over {R_{\rm standard}}}\right)- 1} \right]*1000$$
where X is 13C or 15N and R is the ratio 13C/12C or 15N/14N (Peterson & Fry, Reference Peterson and Fry1987). Standard materials are Vienna Pee Dee belemnite for carbon and atmospheric N2 for nitrogen.
Mixing-model analysis
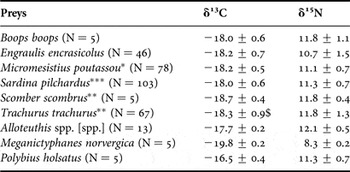
The Bayesian mixing model of Parnell et al. (Reference Parnell, Inger, Bearhop and Jackson2010) was applied to determine proportional contributions of different prey items to the tuna diet. The tuna isotopic data of all years were pooled and the list of potential prey used in the mixing-model analysis comprised those found in the stomachs and other common prey of juvenile bluefin tuna in the Bay of Biscay (Ortiz de Zárate & Cort, Reference Ortiz de Zárate and Cort1986; Logan et al., Reference Logan, Rodríguez-Marín, Goñi, Barreiro, Arrizabalaga, Golet and Lutcavage2011). The prey-tissue discrimination factors applied were Δ13Cmuscle (‰) = 0.32 ± 0.09, Δ15Nmuscle (‰) = 1.46 ± 0.14, Δ13Cliver (‰) = 0.39 ± 0.23 and Δ15Nliver (‰) = 1.62 ± 0.22 (Varela et al., Reference Varela, de la Gándara, Ortega and Medina2012). Isotopic data of the prey species in the study area were taken from a comprehensive analysis of the food web compiling samples of 142 species collected over 10 years (Chouvelon et al., Reference Chouvelon, Spitz, Caurant, Mèndez-Fernandez, Chappuis, Laugier, Le Goff and Bustamante2012). In species where this report provides isotopic data for two different size-classes that fit into the whole prey size range consumed by juvenile Atlantic bluefin tuna (i.e. Sardina pilchardus), a single data (mean ± standard deviation) was recalculated from the two original values. Otherwise, for Micromesistius poutassou, Scomber scombrus and Trachurus trachurus only the data from smaller size-classes were considered, since the larger classes were not found in the stomachs (Table 3).
Mean ± standard deviation values of δ 13C and δ 15N of the prey species considered in the mixing-model analysis (taken from Chouvelon et al., Reference Chouvelon, Spitz, Caurant, Mèndez-Fernandez, Chappuis, Laugier, Le Goff and Bustamante2012).

*, data corresponding to individuals lesser than 300 mm; **, data corresponding to individuals lesser than 200 mm; ***, single data recalculated from the two size ranges provided in the original study.
RESULTS
Stomach-content analysis (SCA)
Eight prey taxa were recorded from the stomach contents analysed (Table 2). Fish was the most abundant prey group in terms of weight and occurrence, whereas crustaceans and cephalopods were much less represented. The cymothoid isopods that occasionally appear in the stomachs could have been ingested along with parasitized prey fish. The horse mackerel (Trachurus trachurus) was the most significant prey species in terms of weight (%W = 53.06) and alimentary index (%AI = 13.26), while the blue whiting (Micromesistius poutassou) was the most frequent prey item, appearing in 45.00% of the non-empty stomachs examined and accounting for 1.82% of the total prey weight (Table 2).
The pattern of point distribution in the plot of prey-specific abundance against occurrence (Figure 2) suggests that in the Bay of Biscay young bluefin tuna have a heterogeneous diet and generalist feeding pattern, with no clear dominant prey, and varying degrees of specialization on different prey taxa. Some prey, represented by T. trachurus and M. norvegica, showed high specific abundance and low occurrence (upper left), indicating that they are preyed by few individuals displaying high specialization. Other prey items, such as Engraulis encrasicolus and Boops boops, showed low specific abundance and occurrence (lower left) and were of little importance.
Stable-isotope analysis (SIA)
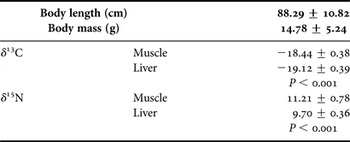
Stable-isotope values measured in white muscle did not show significant differences among years 2008–2011 (analysis of variance followed by Tukey's test, P > 0.05). No significant isotopic differences were likewise observed in liver tissue between years 2008 and 2011 (Student's t-test, P > 0.05). Both, δ 13C and δ 15N values were significantly higher in muscle than in liver (Student's t-test, P < 0.001, Table 4).
Body length (cm), body mass (g), δ 13C, and δ 15N values (mean ± standard deviation).

P values from comparisons between muscle and liver samples (Student's t-test) are shown beneath the relevant compared data.
Mixing-model analysis
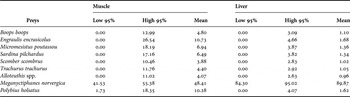
Mixing-model dietary estimations varied depending on the tuna tissue used in the analyses (Table 5). Crustaceans were the most abundant prey group for muscle and liver tissues (~58.70% and ~91.49% respectively), while the northern krill (M. norvegica) was the most abundant prey species (~48.41% and ~89.87%).
Mixing-model estimates from tuna muscle and liver isotopic data. Values are presented as mean proportion estimates with upper and lower 95% confidence intervals.

DISCUSSION
In agreement with earlier observations (Ortiz de Zárate & Cort, Reference Ortiz de Zárate and Cort1986; Logan et al., Reference Logan, Rodríguez-Marín, Goñi, Barreiro, Arrizabalaga, Golet and Lutcavage2011), our SCA results show that fish is the most important prey group for young Atlantic bluefin tuna captured in the Bay of Biscay. Unlike previous analyses, squids seem to be well represented by Alloteuthis media. Although this species has not been found in the diet of bluefin tuna in the Bay of Biscay (Ortiz de Zarate & Cort, Reference Ortiz de Zárate and Cort1986; Logan et al., Reference Logan, Rodríguez-Marín, Goñi, Barreiro, Arrizabalaga, Golet and Lutcavage2011), it was reported in the diet of albacore (Thunnus alalunga) (Ortiz de Zárate, Reference Ortiz de Zárate1987). Alloteuthis media is a neritic, demersal organism ranging between 0 and 350 m (Guerra, Reference Guerra and Ramos1992; Hastie et al., Reference Hastie, Pierce, Wang, Bruno, Moreno, Piatkowski and Robin2009), whose abundance may strongly vary in association with environmental changes (Silva et al., Reference Silva, Vila, Torres, Sobrino and Acosta2011). The horse mackerel (T. trachurus) appears to be an important food resource for young bluefin tuna foraging in the Bay of Biscay, though its contribution to the diet might be overestimated because horse mackerel is often used as bait in this fishing ground (Rodríguez-Marín et al., Reference Rodríguez-Marín, Arrizabalaga, Ortiz, Rodríguez-Cabello, Moreno and Kell2003). In spite of the fact that the examination of the gall bladder and stomach lining allowed us to remove non-natural prey from the analysis, this criterion might not be fully accurate in certain cases. Therefore, some horse mackerel identified as natural prey could be in fact bait.
While diet reconstructions from gut contents require the examination of a spatially and temporally comprehensive collection of samples (Bode et al., Reference Bode, Carrera and Porteiro2006), the present study is based on a relatively small number of stomachs. This shortcoming, added to the fast digestion rate of tunas (Aloncle & Delaporte, Reference Aloncle and Delaporte1970), may reduce the accuracy of the SCA results. However, SIA coupled with mixing models may avoid some of the physiological and temporal biases inherent to SCA (Varela et al., Reference Varela, Rodríguez-Marín and Medina2013). The muscle and liver δ 15N values measured in this study are similar to those reported for age 1–3 bluefin tuna (size range = 57–120 cm) (Logan et al., Reference Logan, Rodríguez-Marín, Goñi, Barreiro, Arrizabalaga, Golet and Lutcavage2011) and age 1–5 albacore (size range = 39.6–112 cm) (Goñi et al., Reference Goñi, Logan, Arrizabalaga, Jarry and Lutcavage2011) collected from the same area, suggesting that these two tuna populations feed on prey occupying the same trophic level. The lower δ 13C values found in this study may be accounted for by dietary interannual variations or by the different procedures used to correct lipid content effects on δ 13C data.
The mixing model estimates derived from muscle and liver tissues indicate that bluefin tuna preyed primarily on euphausiids, which are located in low trophic levels of marine food webs. These results are consistent with previous studies, which concluded that euphausiids are common prey of bluefin tuna (Ortiz de Zárate & Cort, Reference Ortiz de Zárate and Cort1986; Logan et al., Reference Logan, Rodríguez-Marín, Goñi, Barreiro, Arrizabalaga, Golet and Lutcavage2011). It is known that krill are available in shallow waters only during night-time (Kaartvedt et al., Reference Kaartvedt, Larsen, Hjelmseth and Onsrud2002) and are rapidly digested by tuna, so that they are only identifiable in early morning hours (Goñi et al., Reference Goñi, Logan, Arrizabalaga, Jarry and Lutcavage2011). Hence, the marked differences between SCA and SIA regarding the krill contribution to bluefin tuna diet may be due to sampling hours when digestion of krill would have been already completed.
The marked discrepancies between the diet compositions deduced from muscle and liver mixing models are most probably due to the different turnover rates of these organs (MacNeil et al., Reference MacNeil, Gregory, Skomal and Fisk2005), which would provide information at two distinct time scales (Gannes et al., Reference Gannes, Martínez del Río and Koch1998). Thus, the results derived from muscle samples should be interpreted cautiously, since the muscle tissue has a low turnover rate (Graham, Reference Graham2008) and might not be in equilibrium with local prey species.
Both SCA and SIA indicate that juvenile bluefin tuna from the Bay of Biscay feed on species located at different (low and intermediate) trophic levels of the pelagic food web. However, Logan et al. (Reference Logan, Rodríguez-Marín, Goñi, Barreiro, Arrizabalaga, Golet and Lutcavage2011) estimated that juvenile tuna preyed mainly on northern krill and anchovy, which occupy low trophic levels. These contrasting observations suggest that young bluefin tuna can consume a wide variety of species, and their composition depends on the availability of potential prey.
ACKNOWLEDGEMENTS
We thank María Lema (Unidad de Técnicas Instrumentales de Análisis, Universade da Coruña) for isotopic analysis. This work was granted by Junta de Andalucía (RNM-02469), Spanish government (CTM2011-29525-C04-01 and CTM2011-27505) and Prometeo Project (SENESCYT, Ecuador). This is CEI-MAR contribution No. 42.