

INTRODUCTION
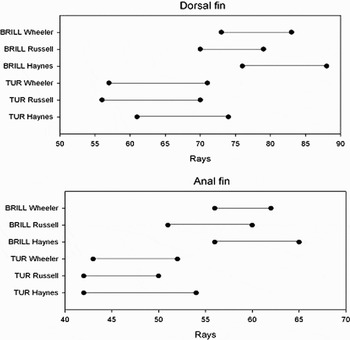
Turbot Psetta maxima Linnaeus and brill Scophthalmus rhombus Linnaeus are valuable commercial non-quota flatfish, and are caught as by-catch in demersal fisheries off the coast of Ireland (Anon, Reference Anon2005). It is not known when turbot or brill spawn, or whether separate stocks exist. The juveniles settle from the plankton onto sandy beach nursery grounds along the west coast of Ireland. Relatively little is known of the population dynamics of these two very similar species especially in the early life history stages. 0-group turbot and brill are almost identical in appearance, and distinguishing between these two species, which lack adult characteristics such as shape, coloration, and the presence of bony tubercles in the juvenile phase, can be problematic (Russell, Reference Russell1976). Hence, for the correct identification of 0-group turbot and brill, fin rays are the diagnostic characteristics to be used (Russell, Reference Russell1976), subsequent to more subtle identification techniques, which can be difficult to describe quantitatively. The number of fin rays exhibited by a fish is determined in the embryonic or larval life stage, and remain constant throughout the life of a fish (Lindsey, Reference Lindsey1988). Variability in fin ray counts reported for juvenile turbot and brill in the literature, in addition to the existence of overlap in the fin ray count range, has previously not been addressed. The fin ray counts reported by Russell (Reference Russell1976) for turbot and brill overlap for the dorsal fin ray, and are extremely close to overlapping for the anal fin rays. In contrast, the fin ray counts reported for turbot and brill by Wheeler (Reference Wheeler1969) for the dorsal and anal fin ray counts do not overlap, showing that significant variation in counts among authors occurs. Consequently, depending on the literature source utilized, misidentification of 0-group turbot and brill could arise.
Fin rays are influenced by a wide range of environmental factors such as temperature, salinity, light and dissolved oxygen (Nielsen et al., Reference Nielsen, Bagge and MacKenzie1998; Swain & Foote, Reference Swain and Foote1999; Kinoshita et al., Reference Kinoshita, Seikai, Tanaka and Kuwamura2000). Significant temporal and spatial variation can therefore occur between individuals of the same species originating from geographically separated stocks, and/or which have experienced different environmental conditions during the egg and larval stages. Juvenile plaice supplied to nursery grounds along the Danish coast were found to originate from separate spawning stocks based on their fin ray counts, as a result of the different environmental conditions experienced by eggs and larvae subsequent to spawning. Geographically separated stocks of rainbow trout (Salmo gairdneri Richardson) and summer flounder (Paralichthys dentatus Linnaeus) have also been distinguished between, based on differences in their fin ray numbers (MacGregor & MacCrimmon, Reference MacGregor and MacCrimmon1977; Burke et al., Reference Burke, Monaghan and Yokoyama2000).
The present study of 0-group turbot and brill is part of a larger investigation of the early life history of flatfish species on Irish west coast nursery grounds (Allen et al., Reference Allen, Brophy, McGrath and King2008; Haynes et al., Reference Haynes, Allen, Brophy and McGrath2008, Reference Haynes, Brophy, McGrath, O'Callaghan, Comerford and Casburn2010; de Raedemaecker et al., Reference Raedemaecker, Keating, Brophy, O'Connor and McGrath2010; Shephard et al., Reference Shephard, Haynes, Brophy, McGrath and Boele2010). Validation of identification techniques for juvenile flatfish, particularly turbot and brill, was an essential prerequisite to this research. 0-group flatfish were collected from sandy beach nursery grounds along the west coast of Ireland by beach seine. A preliminary separation of 0-group turbot and brill was carried out on the beach, based on subtle identification techniques shape and coloration, which are not described in the literature. Subsequent to this initial separation, fin rays were counted and plotted for the 130 0-group flatfish in 2009, in order to test the hypothesis that fin ray counts could be used as a reliable confirmatory method to distinguish between the two species. Furthermore, the fin ray counts of 490 juvenile turbot collected over a four-year period (2006–2009) and juvenile brill collected over a one-year period were also used to determine temporal or spatial scales of variation in these parameters. Significant spatial variation in fin ray counts has been shown for Irish west coast plaice by Haynes et al. (Reference Haynes, Allen, Brophy and McGrath2008). No published information was available for the range of fin ray counts of turbot or brill along the west coast of Ireland, or whether fin ray counts previously determined for turbot and brill from the British Isles (Wheeler, Reference Wheeler1969; Russell, Reference Russell1976) were similar to west of Ireland counts. The objectives of the present study were therefore to: (1) determine if 0-group turbot and brill could be reliably distinguished between using fin ray counts; and (2) determine scales of temporal and/or spatial variation in the number of fin rays of turbot and brill.
MATERIALS AND METHODS
Fish collection
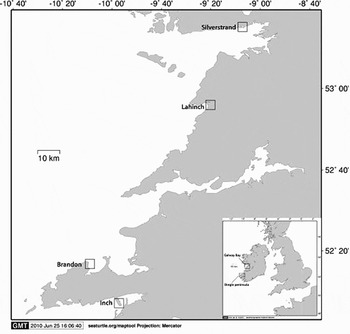
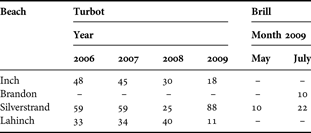
0-group turbot and brill were collected from two nursery grounds between May and October on the west coast of Ireland in 2009 by beach seine (Figure 1; Table 1). Lengths of 0-group turbot and brill collected on this nursery ground ranged from 2.4 to 6.1 cm, and from 2.5 to 8.1 cm respectively, with the majority of individuals captured <4 cm. 0-group turbot were also collected from three nursery grounds along the west coast of Ireland over a four-year period (2006– 2009). Sampling on a beach was carried out in a single day, between two hours prior to or two hours after the time of low tide during daylight hours. A preliminary separation of 0-group turbot and brill was carried out on the beach, using subtle identification techniques such as coloration and shape. Furthermore, individuals involved in the beach seining survey since the year 2000, prior to the years investigated in the present study, had considerable expertise in the identification of 0-group flatfish based on their appearance. This was also used to aid the initial separation of turbot and brill prior to verification using fin ray counts. Fish were captured using a beach seine as described in Haynes et al. (Reference Haynes, Brophy, McGrath, O'Callaghan, Comerford and Casburn2010), and placed in plastic bags with the sample date and location and frozen in the laboratory within a number of hours of being captured for further analyses.
Beaches assessed for 0-group turbot and brill along the west coast of Ireland (2006–2009).

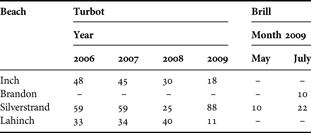
Abundances of 0-group turbot (per year) and brill (per month in 2009) collected from Irish west coast nursery grounds. –, denotes zero abundances.
Fin ray analysis
Frozen fish were removed from the freezer and allowed to thaw overnight. In order to confirm that 0-group turbot and brill had been separated correctly in the initial identification stages, the number of dorsal, anal, and caudal fin rays, which are species specific for flatfish, were counted under a stereoscopic microscope and compared with the fin ray count given by Wheeler (Reference Wheeler1969) and Russell (Reference Russell1976).
Temperature data
Temperature has been found to significantly influence the number of fin rays exhibited by flatfish (Kinoshita et al., Reference Kinoshita, Seikai, Tanaka and Kuwamura2000). Although limited, the mean spring sea surface temperature data (March, April and May) corresponding to the pelagic stage in turbot, were obtained and considered in the discussion, with the possibility that temporal variability in fin ray counts may have an environmental basis. Temperature data were available for three years only (2006–2008) and were provided by the Marine Institute from the weather buoys M1 (53.1266°N 11.2000°W) off the west coast and M3 (51.2166°N 10.5500°W) off the south-west coast of Ireland.
Statistical analyses
Statistical analysis was carried out on both the dorsal and anal fin ray counts of turbot and brill using the statistical package MINITAB 15. Homogeneity of variances were tested using Levene's test, and were log transformed where appropriate (Underwood, Reference Underwood1997). Where the data failed to display homogeneity of variances, the non-parametric Kruskal–Wallis test was used. Data were analysed using unbalanced analyses of variance (ANOVAs), to test the null hypotheses that there was no significant difference in the number of dorsal and or fin ray counts of turbot between beach and year. Beach was included as a fixed factor, whereas year was included as a random factor. Significant differences were explored using Tukey's post-hoc procedures. A one-way ANOVA was used to test the null hypotheses that there was no significant difference in the number of dorsal or anal fin ray counts of brill between beach and month. Principal components analysis (PCA) was carried out on the dorsal and anal fin ray counts of 0-group flatfish, to determine if these could be used as reliable characteristics to distinguish between turbot and brill. The PCA transforms or decomposes interrelated variables into a new set of variables or principal components (PC) which are not correlated with each other, while retaining most but not all of the variation present in the dataset (Jolliffe, Reference Jolliffe2002).
RESULTS
The range of caudal fin rays for both turbot and brill was identical, and therefore omitted from the analyses. Fin ray counts of turbot and brill in the present study were different from those described in the literature by Wheeler (Reference Wheeler1969) and Russell (Reference Russell1976) (Figure 2).
Fin ray count ranges for turbot and brill as described in the literature.

Comparison of juvenile turbot and brill fin ray counts
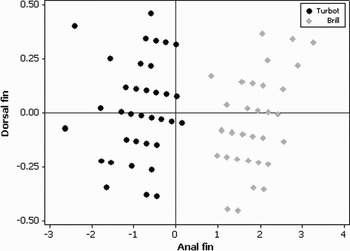
Using PCA, the dorsal and anal fin ray counts of 0-group flatfish collected along the west coast of Ireland were found to separate into two distinct groups; turbot and brill, with no overlap detected for 2009 (Figure 3). The PC1 revealed 98% of the variation with PC2 accounting for only 2% of the variation observed.
Principal components analysis plot of the dorsal and anal fin ray counts between 0-group turbot (N = 88) and brill (N = 42) collected on Silverstand on the west coast of Ireland in 2009.

Spatial variation in the fin ray counts of brill (2009)
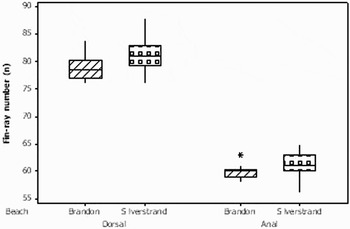
A one-way ANOVA detected a significant difference in the dorsal (df = 1; F = 4.66; P = 0.037) and anal (df = 1; F = 5.43; P = 0.025) fin ray counts of brill (N = 42) between Silverstrand and Brandon beaches. The dorsal fin ray counts on Silverstrand beach were significantly higher (ñ| = 81 ± 3) in comparison to the dorsal fin ray counts on Brandon beach (ñ| = 79 ± 3), with the number of anal fin ray counts on Silverstrand beach (ñ| = 61 ± 2) also significantly higher in comparison to Brandon beach (ñ| = 60 ± 2) (Figure 4). A one-way ANOVA detected no significant difference in the number of dorsal (df = 1; F = 0.12; P = 0.736) or anal (df = 1; F = 0.13; P = 0.749) fin ray counts of brill between the months of May and July on Silverstrand beach.
Spatial variation in the number of dorsal and anal fin ray counts of 0-group brill collected on beaches along the west coast of Ireland (2009).

Temporal and spatial variation in turbot fin ray counts (2006–2009)
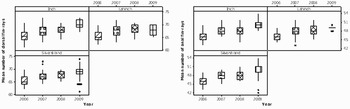
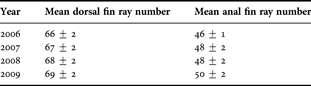
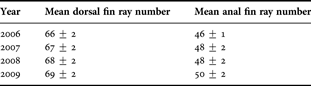
A two-way ANOVA revealed no significant differences in the number of dorsal fin ray counts of turbot (N = 490) between beaches (df = 2; F = 1.63; P = 0.197). However, a significant difference occurred in the number of dorsal fin ray counts between years (df = 3; F = 60.02; P < 0.001). There was no significant interaction between beach and year factors (df = 6; F = 1.60; P = 0.144). Tukey's multiple comparisons tests revealed that turbot in 2006 had significantly lower dorsal fin ray counts (ñ| = 66 ± 2) compared to 2007 (ñ| = 67 ± 2), 2008 (ñ| = 68 ± 2), and 2009 (ñ| = 69 ± 2). Furthermore, turbot in 2009 had significantly higher dorsal fin ray counts in comparison to all other years (Figure 5). A non-parametric Kruskal–Wallis found no significant differences in the anal fin rays between beaches (H = 3.80; df = 2; P = 0.15). However, a significant difference in the number of anal fin rays occurred between years (H = 206.12; df = 2; P < 0.001). Tukey's multiple comparisons tests on ranked data revealed that turbot in 2006 had a significantly lower number of dorsal fin ray counts (ñ| = 46 ± 1) compared to 2007 (ñ| = 48 ± 2), 2008 (ñ| = 48 ± 2), and 2009 (ñ| = 50 ± 2). The mean dorsal and anal fin ray counts of o-group turbot, collated in a given year on west of Ireland nursery grounds, are presented in Table 2.
Temporal variation in the number of dorsal (left) and anal (right) fin ray counts of 0-group trubot collected on beaches along the west coast of Ireland (2006–2009).

Mean dorsal and anal fin ray counts of 0-group turbot collected on nursery grounds along the west coast of Ireland (2006–2009).
The influence of temperature on fin ray counts
Although not statistically analysed, there was a suggestion that mean sea temperatures representing the pelagic stage of turbot along the west coast of Ireland, may have influenced the temporal variability in fin ray counts observed in the present study. The significantly lower fin ray counts exhibited by turbot in the year 2006 also corresponded with lower sea temperatures (ñ| = 10.64°C) in comparison to 2007 (ñ| = 11.59°C) and 2008 (ñ| = 11.57°C).
DISCUSSION
Fin ray count ranges for 0-group turbot and brill along the west coast of Ireland were different from those previously reported in the literature. Nonetheless, they proved to be a reliable confirmatory method for distinguishing between juvenile flatfish collected along the west coast of Ireland in a given year (2009), subsequent to a preliminary separation. Recently, Haynes et al. (Reference Haynes, Allen, Brophy and McGrath2008) have shown that fin ray counts may be used to distinguish juvenile flounder from plaice on Irish nursery grounds, with this method previously used by Nichols (Reference Nichols1971) to separate plaice from other species. In contrast, fin ray counts were deemed unreliable for differentiating between 0-group sand flounder (Rhombosolea plebeia (Richardson)) and yellow bellied flounder (Rhombosolea leporina Gunther) (Eldon & Smith, Reference Eldon and Smith1986) due to the existence of overlap in the fin ray count ranges. Although there was no evidence of fin ray overlap between turbot and brill in 2009, the possibility that it may arise in other years cannot be excluded given the scales of spatial and temporal variation observed in the present investigation.
Juvenile turbot collected from nursery grounds along the west coast exhibited significantly different fin ray counts between years but not between beaches. Turbot supplied to nursery grounds along the west coast may therefore have originated from the same spawning stock. In contrast, fin ray counts of juvenile brill were found to differ significantly between beaches. Fish collected from Brandon beach exhibited significantly lower counts compared to those collected from Silverstrand beach, suggesting a difference in the origin of juveniles to these areas. O'Neill et al. (Reference O'Neill, McGrath and Brophy2010) have shown significant variation in flounder fin ray counts between Irish and Welsh populations. The scales of variation reported in the latter study and herein show that fin ray count ranges reported from temporally or spatially limited data must be treated with caution when used as the sole identification tool for juvenile flatfish.
Although the data are limited, there is the suggestion that the mean number of dorsal and anal fin ray counts of turbot is positively influenced by mean sea temperatures during the pelagic stage. Temperature has previously been reported to influence the number of fin rays exhibited by juvenile flatfish, with significant positive correlations observed for both Japanese flounder (Paralichthys olivaceus) (Kinoshita et al., Reference Kinoshita, Seikai, Tanaka and Kuwamura2000) and summer flounder (Burke et al., Reference Burke, Monaghan and Yokoyama2000). Differences in environmental factors have also been reported to result in variability of pectoral fin ray counts between herring (Clupea harengus harengus Linnaeus) stocks (Safford & Booke, Reference Safford and Booke1992). Temporal variability in fin ray counts in the present study may therefore reflect inter-annual differences in the temperature experienced by turbot eggs and larvae in the pelagic stage.
The present study demonstrates that the use of fin ray counts as a method to distinguish between 0-group flatfish should be applied with caution given the variability observed. A longer time-series is needed to further elucidate the results revealed in the present study. The suggestion that there may be different stocks of brill needs further investigation using, perhaps, otolith morphology or genetics.
ACKNOWLEDGEMENTS
We would like to extend our appreciation to Bord Iascaigh Mhara and Taidhge Mara Teoranta who funded much of the fieldwork; the Marine Institute, in particular Deirdre O'Driscoll for providing the necessary environmental data, Lahinch Seaworld, Galway Atlantaquaria for their assistance with sample collections, and Seaturtle.org for their mapping software. For all involved in the collection of fish over the years; Stephen Comerford, Fien de Raedemaecker and Bernadette O'Neill from the Commercial Fisheries Research Group, and Grace Madden, Fergal Moore, and Derek Haynes. Finally, we are extremely grateful to the two referees for their valuable comments and suggestions, which improved the quality of this manuscript.