Implications
Poor reproductive performance in young ewes is a major economic and welfare issue facing the sheep industry. Meeting ewe nutritional requirements in pregnancy is critical for placental and foetal development, which has major implications on lamb survival. This paper increases understanding on the effects of plane of nutrition in the early stages of gestation in 1- and 2-year-old ewes and is designed to help develop feeding strategies to improve this situation.
Introduction
The nutrient requirements of adolescent ewes are a function of age, body weight and condition, and stage and level of production. Because young ewes are still growing and have not yet reached mature body size, their requirements for nutrients are higher than adult ewes (National Research Council, 2007). Production stages such as gestation and lactation not only determine a higher demand for nutrients but also add complexity in nutrient partitioning and utilization due to numerous pregnancy-induced adaptations in maternal tissue metabolism (reviewed by Robinson et al., Reference Robinson, Rooke and McEvoy2002). Annett and Carson (Reference Annett and Carson2006) demonstrated that mature and adolescent ewes do not respond in equivalent ways to different planes of nutrition during early pregnancy (EP) (day 0 to 30 of gestation). Therefore, meeting the adolescent ewe’s requirements during pregnancy is critical for placental and foetal development, and in determining lamb birth weight. This has major implications on lamb survival as extreme birth weights (light and heavy lambs) are associated with higher mortality rates (Sawalha et al., Reference Sawalha, Conington, Brotherstone and Villanueva2007).
Nutrient partitioning in EP influences embryo growth and development. Underfeeding (0.6 M) adolescent dams in EP (day 0 to 30 of gestation) increased the proportion of ewes that successfully conceived, with no effects on lamb birth weight, viability or performance (Annett and Carson, Reference Annett and Carson2006). However, adolescent dams depleted their body reserves and appeared less capable of sustaining an adequate lactational performance. In adult ewes, Muñoz et al. (Reference Muñoz, Carson, McCoy, Dawson, O’Connell and Gordon2008a) reported that dams on low-plane diets (0.6 M) for the first 39 days of gestation gave birth to heavier lambs at parturition that had lower mortality rates at weaning than lambs born from control or over-fed ewes, provided nutrition during mid- and late pregnancy was adequate.
During MP, the most sensitive period for nutritional modification of placental growth and consequently birth weight is between days 30 and 80 of gestation, the period of maximal placental weight gain (Schneider, Reference Schneider1996). Several authors have highlighted the inconsistencies between reports that examine the effects of maternal nutrition in MP on foetal and placental growth (Kelly, Reference Kelly1992; Heasman et al., Reference Heasman, Clarke, Stephenson and Symonds1999; Redmer et al., Reference Redmer, Wallace and Reynolds2004). Wallace et al. (Reference Wallace, Luther, Milne, Aitken, Redmer, Reynolds and Hay2006) recently reviewed two adolescent sheep models of nutritional manipulation during pregnancy. In the over-nourished dam model, when adolescent ewes were offered ad libitum intakes equivalent to twice maintenance (M) energy requirements, the maternal growth achieved was concomitant with impaired placental and foetal growth, relative to control dams. In contrast, in the under-nourished dam model (adolescent ewes prevented from growing by feeding 0.7 M), limiting maternal energy intake gradually depleted maternal body reserves, leading to reduced foetal growth in late pregnancy, independent of alterations in placental growth.
From the published literature, a series of factors such as level and length of nutrient manipulation, maturity of the dam and period during which nutritional manipulation occurs (early, mid- or late pregnancy) have been identified as having a determining influence in the final outcome of pregnancy. However, there is a paucity of information on the effect of these factors on foetal development, parturition performance and on dam and neonatal behaviours. The objectives of the present study were to investigate the effects of different planes of nutrition during EP and MP and their interactions on maternal and offspring performance of ewes of 1 and 2 years of age.
Material and methods
The work described in this paper was conducted in accordance with the requirements of the UK Animals (Scientific Procedures) Act 1986.
Animals
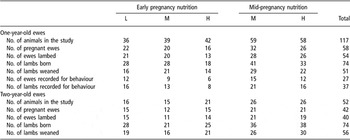
Two studies were conducted in parallel over two successive mating seasons. The first study involved a total of 117 (n = 81 year 1; n = 36 year 2) peri-pubertal crossbred ewes of 7.2 ± 0.3 months of age (Table 1). The second study utilized 52 (n = 19 year 1; n = 33 year 2) uniparous crossbred ewes of 19.2 ± 0.3 months of age. The breeds of the ewes were Texel × Greyface (Border Leicester × Scottish Blackface; n = 63), Charolais × Greyface (n = 54) and Lleyn × Greyface (n = 52). Twenty-seven rams (15 and 12 for year 1 and 2, respectively) from three different breeds were used in the study – Charolais, Lleyn and Texel. Prior to the commencement of the study, all animals had ad libitum access to fresh pasture. The mean live weight (LW) and body condition score (BCS) of peri-pubertal ewes at the start of the study were 46.7 ± 4.9 kg and 3.5 ± 0.2, respectively. The same parameters for uniparous ewes were 62.6 ± 5.6 kg and 3.6 ± 0.2.
Number of 1- and 2-year-old ewes involved in the study

Nutrition provided: low (L), medium (M) or high (H) as compared to predicted metabolizable energy requirements for maintenance.
Experimental design
Both experiments were carried out at the Agri-Food and Biosciences Institute, Hillsborough, and had a common experimental design. All ewes were housed in individual pens on wooden slat floors at the start of the study, where they remained throughout pregnancy. In mid-October, the ewes were submitted to a synchronization regime based on intravaginal sponges containing 30 mg flugestone acetate for 12 days (Chronogest®; Intervet UK Ltd, Milton Keynes, UK), followed by an intramuscular injection of 300 IU of pregnant mare serum gonadotrophin (Fostim 6000®; Pharmacia & Upjohn Animal Health Ltd, Kalamazoo, MI, USA). Two days after sponge removal the ewes were naturally mated once and randomly allocated to treatments and subsequently balanced for LW, BCS, ewe breed and sire breed.
Nutritional treatments were applied offering different levels of the same dried grass-based diet that in year 1 contained 897 g dry matter (DM)/kg and supplied the ewes with 149 g crude protein (CP)/kg DM. In year 2, the diet contained 911 g DM/kg and supplied 128 g CP/kg DM. In vivo metabolizable energy (ME) values (10.2 MJ/kg DM) determined previously (Annett and Carson, Reference Annett and Carson2006) for grass nuts from the same source were used in the current study. From day 1 to 39 post-mating (EP), ewes were placed on one of three planes of nutrition that were individually estimated to provide either 200% (high, H-EP), 100% (medium, M-EP) or 60% (low, L-EP) of predicted ME requirements for M of a non-pregnant ewe (Agriculture and Food Research Council, 1993). From day 40 to day 90 of gestation (MP) within each EP treatment, primiparous ewes (experiment 1) were allocated to rations providing either 140% (medium, M-MP) or 200% (high, H-MP) of individual ME requirements for M of a non-pregnant ewe. In the same period, uniparous ewes (experiment 2) received either 80% (medium, M-MP) or 140% (high, H-MP) of their ME requirement relative to a non-pregnant ewe.
Within each combination of EP and MP treatments half of the ewes received a selenium supplement (0.5 mg Se/ewe per day), offered from day −14 to day 90 of pregnancy (year 1 = Selplex®; Alltech, Belfast, Northern Ireland, UK; year 2 = Retosel Premix 4.5%®; Trouw Nutrition, Belfast, Northern Ireland, UK) as described in Muñoz et al. (Reference Muñoz, Carson, McCoy, Dawson, O’Connell and Gordon2008b). During EP and MP, diets were supplemented daily with 25 g of barley, as a vehicle for the intake of selenium and 25 g of straw as a source of fibre. After 90 days of pregnancy, all ewes were offered increasing levels of the grass-based diet to meet individual energy and protein requirements for late pregnancy calculated in accordance with their LW and expected litter size (Agriculture and Food Research Council, 1993). During this period, diets were supplemented with 25 g of straw, 100 g/day of Sopralin® (Trouw Nutrition) and 25 g/day of a standard vitamin and mineral mix: VMC Sheep® (Trouw Nutrition), which supplied per kg vitamin A, 400 000 IU; vitamin D3, 80 000 IU; vitamin E, 600 IU; Se, 10 mg; Ca, 170 g; P, 40 g; NaCl, 320 g and Mg, 60 g. The total daily feed allocation was offered in a single feed at 0930 h. Pregnancy status of the ewes was determined by ultrasound scanning on day 50 of gestation. All non-pregnant animals were removed from the study and their data (LW and BCS data) were included in the analysis only up to day 55. Following lambing, ewes remained indoors with their lambs for 48 h, after which they were returned to pasture. Twin suckling ewes were kept in a separate field compared to ewes with singles. Creep concentrate feeding (ME 12.3 MJ/kg DM; CP 204 g/kg DM and 30 g/kg VMC Intensive Lamb® (Trouw Nutrition): vitamin A, 400 000 IU; vitamin D3, 66 667 IU; vitamin E, 1000 IU; Se, 17 mg; Ca, 100 g; P, 3.1 g and NaCl, 500 g per kg product) was introduced to lambs from twin suckling ewes in the first year and to all lambs in year 2, from 4 weeks of age and until weaning at 16 weeks.
Measurements
Placental and foetal development was assessed on all animals by trans-abdominal ultrasonography performed by the same operator using a portable Aloka 500 SSD with a 3.5 MHz curvilinear transducer (Aloka, Tokyo, Japan). During the procedure, the sheep were restrained in a crate in a ventral position. All ultrasonographic examinations were performed by the same operator. A continuous 2-min ultrasound recording was obtained for a single foetus from each ewe, at days 57 ± 3, 67 ± 2 and 81 ± 0.5 of gestation (year 1) and on days 41 ± 1, 50 ± 0.4 and 72 ± 0.4 of gestation (year 2). Still images of the foetus were transferred to a PC using DT-Acquire 3.3.0 (Data Translation Inc., Marlboro, NY, USA). Global Lab Image/2 3.6 (Data Translation Inc.) was used for measurements of cranial and abdominal diameters (to the nearest mm), as described by Pharr et al. (Reference Pharr, Rowell and Flood1994). Placental growth was monitored during the same period (Kelly et al., Reference Kelly, Newnham, Johnson and Speijers1987).
In year 1, data on maternal and neonatal behaviours of 1-year-old ewes only were collected in situ following parturition. Ewe and lamb behaviours were recorded continuously for the first 30 min after the birth of each lamb, using handheld data recorders and the observer software system for behaviour research (Noldus Information Technology, Wageningen, The Netherlands). The definition of maternal behaviours was based on Dwyer and Lawrence (Reference Dwyer and Lawrence1998), while neonatal lamb behaviours were based on Dwyer et al. (Reference Dwyer, Lawrence, Brown and Simm1996), and have been described previously (Muñoz et al., Reference Muñoz, Carson, McCoy, Dawson, O’Connell and Gordon2008b).
Ewe LW and BCS (Russel et al., Reference Russel, Doney and Gunn1969) were recorded at fortnightly intervals throughout gestation, 48 h after lambing, at 6 weeks post-lambing and at weaning. Jugular blood samples were collected using 8 ml lithium heparin tubes with gel (Vacuette®; Greiner Bio-One Ltd, Gloucestershire, UK) 2 h after feeding from all ewes at mating, at day 42 and at day 83 of gestation. Blood samples were stored at room temperature for 1 h before centrifuging at 4000 r.p.m. for 10 min. Plasma was stored at −20°C until analysed for progesterone concentrations, determined using an enzyme-linked immunosorbent assay (ELISA) kit (Ridgeway Science Ltd, Gloucestershire, UK).
Primiparous ewes lambed at 1.0 ± 0.02 years of age while biparous ewes were 2.0 ± 0.03 years old. At lambing, records were kept of lambing date, litter size, lambing difficulty (0 = no assistance and 1 = assistance), birth presentation (normal or abnormal position), birth weight and sex for all lambs. Within 24 h of lambing, nutritional effects on foetal skeletal development were assessed by measuring head and crown-rump length, thoracic circumference, and right fore limb and right hind limb length, using a flexible measuring tape. Lambs were weighed at 24 h post partum, at 3 and 6 weeks of age, and thereafter at fortnightly intervals until weaning. The lambs were blood sampled 24 h after birth by venipuncture using a 5 ml vacuette® gel separation tube (Greiner Bio-One Ltd, Gloucestershire, UK). Samples were kept at room temperature for 1 h after collection and refrigerated at 4°C for a further 24 h. Samples were than centrifuged at 4000 r.p.m. for 10 min. The serum was collected and stored at −20°C until assayed for immunoglobulin concentration estimated by zinc sulphate turbidity analyses (McEwan et al., Reference McEwan, Fisher, Selman and Penhale1970), free triiodothyronine (free T3) and thyroxine (T4) concentrations. Free T3 was measured in year 1 using a free T3 kit (Siemens Medical Solutions Diagnostics, Tarrytown, NY, USA) on a Centaur Analyzer (Bayer Healthcare LLC, Diagnostics Division, Tarrytown, NY, USA). In year 2, the kit and analyser were Abbott Diagnostics (Berkshire, England, UK) and Abbott Diagnostics Architect Ci 8000, respectively. Thyroxine concentrations were measured using a T4 Dri kit (Microgenics Corporation, Fremont, CA, USA) on an Olympus AU640 analyser (Olympus UK Ltd, Middlesex, UK). Records of lamb and ewe mortality were kept throughout the study. If an ewe could not raise its own lambs, her data and that of her offspring were included in the analysis only up to parturition.
Statistical analysis
Owing to the unbalanced nature of the experimental design, quantitative data were analysed using the residual maximum likelihood (REML) procedure in GenStat (Genstat for Windows, 11th Edition; VSN International Ltd, Oxford, UK). The model used evaluated the main effects of plane of nutrition in EP, plane of nutrition in MP, selenium supplementation and year of study, in a factorial design. All possible two-way interactions of main effects were examined and then removed from the model if non-significant. Mean comparisons were made with least significant differences (LSD at P < 0.05). Maternal data were adjusted for the effect of ram and ewe breed, while lamb sex was included for the analyses of litter weight. For offspring data, the individual dam and sire of the lamb were fitted as random effects while ram breed, ewe breed, lamb sex, litter size, field and age of lamb were included as fixed effects, where appropriate. Categorical data were analysed by binary logistic regression using LogXact (LogXact8; Cytel Inc., Cambridge, MA, USA). The models used for both maternal and offspring traits were as previously described for continuous data. Behaviour data were analysed using Stata survival analysis on the lamb latencies (Stata 9 for Windows; StatCorp LP, TX, USA), and the Tobit method (Amemiya, Reference Amemiya1973) for the analysis of the frequency of presentation and duration of behaviours.
Results
There were no interactions between nutritional treatments; therefore, only main effects of plane of nutrition in EP and MP are presented in this paper.
One-year-old ewes
Live weight and body condition score
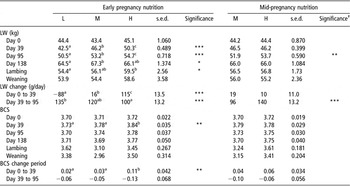
Increasing the plane of nutrition from day 0 to day 39 post-mating resulted in increases in average LW (P < 0.001), BCS (P < 0.01) and in LW and BCS changes (P < 0.001) during EP (H > M > L; Table 2). Between days 40 and 90, whilst ewes offered diet L-EP had greater LW gains (P < 0.001) than ewes offered diet H-EP, the differences in LW between the groups remained, albeit at a lower level, until lambing (P < 0.05). At weaning, the differences in LW between treatments L-EP and H-EP were not significant (P > 0.05). From MP onwards, EP diets had no residual effects on BCS or on BCS change (P > 0.05).
Effect of plane of nutrition of 1-year-old ewes in early and mid-pregnancy on live weight (LW), body condition score (BCS) and on LW and BCS change throughout the study

s.e.d. = standard error of difference.
Nutrition provided: low (L), medium (M) or high (H) as compared to predicted metabolizable energy requirements for maintenance.
a,b,cWithin a row, means without a common superscript letter differ (P < 0.05).
*Significant at the 5% level, **significant at the 1% level, ***significant at the 0.1% level.
†There were no statistical interactions between plane of nutrition in early and mid-pregnancy.
Increasing plane of nutrition between days 40 and 90 resulted in increases in average ewe LW at day 90 (P < 0.01) and in LW change for that period (P < 0.001). There were no effects of MP diets on BCS (P > 0.05). MP nutrition had no significant effects on ewe LW or BCS at either lambing or weaning (P > 0.05).
Foetal and placental development
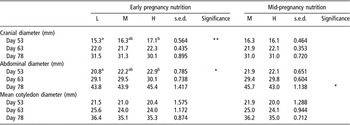
Foetuses carried by dams offered diet L-EP in EP had smaller cranial (P < 0.01) and abdominal (P < 0.05) diameters on day 53 of gestation compared with H-EP ewes, with M-EP ewes intermediate (Table 3). These differences were not present on day 63 or day 78 (P > 0.05). EP nutrition had no effects on cotyledon diameter (P > 0.05). MP diets affected foetal development with foetuses from ewes offered diet M-MP having bigger abdominal dimensions than foetuses from H-MP ewes on day 78 of gestation (P < 0.05).
Effect of plane of nutrition of 1-year-old ewes in early and mid-pregnancy on plasma progesterone concentrations, foetal growth and placental development

s.e.d. = standard error of difference.
Nutrition provided: low (L), medium (M) or high (H) as compared to predicted metabolizable energy requirements for maintenance.
a,bWithin a row, means without a common superscript letter differ (P < 0.05).
*Significant at the 5% level, **significant at the 1% level.
Plasma progesterone concentrations
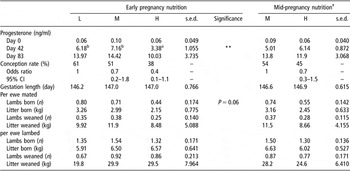
Plasma progesterone concentrations of ewes prior to mating (day 0) were close to zero for all animals (Table 4). Pregnant ewes offered diet H-EP in EP had lower plasma progesterone concentrations than L-EP and M-EP ewes on day 42 (P < 0.01). There were no differences in plasma progesterone concentrations throughout gestation between ewes offered either of the MP diets (P > 0.05).
Effect of plane of nutrition of 1-year-old ewes in early and mid-pregnancy on conception rate, length of gestation and lamb output per ewe mated and lambed

s.e.d. = standard error of difference.
Nutrition provided: low (L), medium (M) or high (H) as compared to predicted metabolizable energy requirements for maintenance.
a,bWithin a row, means without a common superscript letter differ (P < 0.05).
†There was no statistical significance between treatments.
Ewe reproductive performance and parturition data
The incidence of abortion and of mortality in ewes was not affected by plane of nutrition in EP with average values of 2% and 9%, respectively (P > 0.05). There were no significant differences (P > 0.05) in conception rates between EP treatments (Table 4). The number of lambs born on a per ewe mated basis tended (P = 0.06) to be lowest for ewes offered diet H-EP compared with ewes offered diets L-EP or M-EP. Plane of nutrition in EP had no significant effects on either the number or weight of lambs weaned per ewe (P > 0.05).
Plane of nutrition in MP had no effects on conception rate, number of lambs born per ewe mated, lamb output (number and weight of lambs weaned) per ewe, ewe mortality or abortion incidence (P > 0.05).
Lamb viability and performance
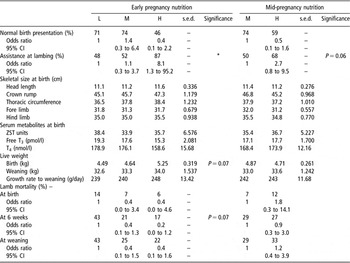
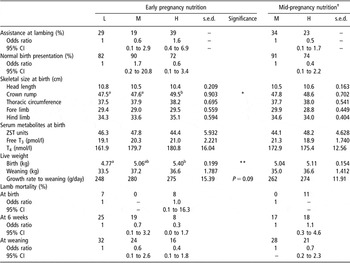
The proportion of normal birth presentations was not affected by EP treatments (P > 0.05; Table 5). However, lambs born from ewes offered diet H-EP required more assistance at lambing than lambs born from ewes offered diets L-EP or M-EP (P < 0.01). In addition, H-EP lambs tended to be heavier at birth (P = 0.07) than L-EP and M-EP lambs. Lamb growth rate from birth to weaning was not significantly affected by plane of nutrition in EP (P < 0.05). The incidence of lamb mortality at 6 weeks of age tended to be greater for lambs born from dams offered diet L-EP (P = 0.07).
Effect of plane of nutrition of 1-year-old ewes in early and mid-pregnancy on lambing ease, skeletal size, concentrations of serum metabolites, live weighs and lamb mortality rates to weaning

s.e.d. = standard error of difference; ZST = zinc sulphate turbidity.
Nutrition provided: low (L), medium (M) or high (H) as compared to predicted metabolizable energy requirements for maintenance.
*Significant at the 5% level.
MP nutrition had no significant effects (P > 0.05) on birth presentation, birth weight, serum metabolites at birth, skeletal size, lamb growth rate or on mortality, although there was a tendency for ewes offered diet H-MP to require more assistance (P = 0.06) at lambing than ewes offered diet M-MP.
Two-year-old ewes
Live weight and body condition score
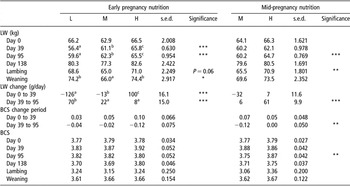
Increasing the plane of nutrition from day 0 to day 39 resulted in increases in LW (P < 0.001) and in LW change (P < 0.001) during the treatment period (H > M > L; Table 6). Despite ewes offered diet L-EP gaining more weight than M-EP and H-EP ewes (P < 0.001), these differences were sustained during MP (P < 0.001). Ewes offered diet M-EP tended to be lighter than L-EP and H-EP ewes at lambing (P = 0.06), a trend that was sustained to weaning (P < 0.05).
Effect of plane of nutrition of 2-year-old ewes in early and mid-pregnancy on live weight (LW), body condition score (BCS) and on LW and BCS change throughout the study

s.e.d. = standard error of difference.
Nutrition provided: low (L), medium (M) or high (H) as compared to predicted metabolizable energy requirements for maintenance.
a,b,cWithin a row, means without a common superscript letter differ (P < 0.05).
*Significant at the 5% level, **significant at the 1% level, ***significant at the 0.1% level.
Increasing the plane of nutrition in MP resulted in increases in average LW at day 90 (P < 0.001), BCS on day 90 (P < 0.01) and on LW (P < 0.001) and BCS (P < 0.01) change during the treatment period. At lambing, H-MP ewes were heavier (P < 0.01) than M-MP ewes, although there were no significant differences between treatments at weaning (P > 0.05).
Foetal and placental development
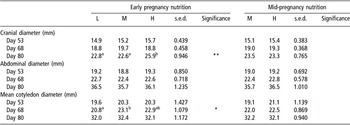
Foetuses carried by ewes offered diet H-EP had bigger cranial diameters than foetuses from ewes offered diet L-EP or M-EP on day 80 (P < 0.01) of gestation (Table 7). There were no differences between EP treatments in abdominal diameters (P > 0.05). Ewes offered diet L-EP had smaller cotyledon diameters on day 68 than ewes on diet M-EP, with H-EP ewes intermediate (P < 0.05). Dietary treatments during MP had no effects on foetal or placental development (P > 0.05).
Effect of plane of nutrition of 2-year-old ewes in early and mid-pregnancy on plasma progesterone concentrations, foetal growth and placental development

s.e.d. = standard error of difference.
Nutrition provided: low (L), medium (M) or high (H) as compared to predicted metabolizable energy requirements for maintenance.
a,bWithin a row, means without a common superscript letter differ (P < 0.05).
*Significant at the 5% level, **significant at the 0.1% level.
Plasma progesterone concentrations
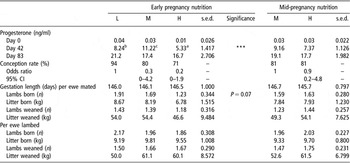
Plasma progesterone concentrations of ewes prior to mating (day 0) were close to zero for all animals (Table 8). Progesterone concentrations on day 42 of gestation were affected by plane of nutrition during EP, with pregnant ewes offered diet H-EP having lower plasma progesterone concentrations than ewes on diet M-EP, with L-EP ewes intermediate (P < 0.001). MP treatments had an effect on plasma progesterone concentration on day 42 with ewes offered diet M-MP having lower progesterone concentrations than H-MP ewes (P < 0.05).
Effect of plane of nutrition of 2-year-old ewes in early and mid-pregnancy on conception rate, length of gestation and lamb output

s.e.d. = standard error of difference.
Nutrition provided: low (L), medium (M) or high (H) as compared to predicted metabolizable energy requirements for maintenance.
a,b,cWithin a row, means without a common superscript letter differ (P < 0.05).
***Significant at the 0.1% level.
Ewe reproductive performance and parturition data
Plane of nutrition in EP had no significant effect (P > 0.05) on conception rate (Table 8). The number of lambs born per ewe mated tended to be highest (P = 0.07) in ewes offered diet L-EP compared with ewes offered diets M-EP or H-EP. Gestation length and litter size per ewe lambed were not affected by EP diets (P > 0.05). There were no abortions recorded during the study for 2-year-old ewes. Mortality rates for the ewes were not affected by diets (P > 0.05) and had a mean value of 3%. EP nutrition had no effect on either the number or weight of lambs weaned per ewe (P > 0.05). Plane of nutrition in MP had no effects on any of the previous parameters (P > 0.05).
Lamb viability and performance
There were no differences between treatments (P > 0.05) in the proportion of abnormal birth presentations, lambing assistance required or lamb serum concentration of immunoglobulins, free T3 or T4 at birth, in either EP or MP (Table 9). Lambs born from ewes offered diet H-EP were heavier (P < 0.01) at birth and had longer crown-rump lengths (P < 0.05) than L-EP lambs. These lambs also tended to have higher growth rates than L-EP lambs (P < 0.09). Lamb mortality rates up to weaning were not affected by treatments (P > 0.05).
Effect of plane of nutrition of 2-year-old ewes in early and mid-pregnancy on lambing ease, skeletal size, concentrations of serum metabolites, live weighs and lamb mortality rates to weaning

s.e.d. = standard error of difference; ZST = zinc sulphate turbidity.
Nutrition provided: low (L), medium (M) or high (H) as compared to predicted metabolizable energy requirements for maintenance.
a,bWithin a row, means without a common superscript letter differ (P < 0.05).
*Significant at the 5% level, **significant at the 1% level.
†There was no statistical significance between treatments.
Maternal and neonatal behaviour
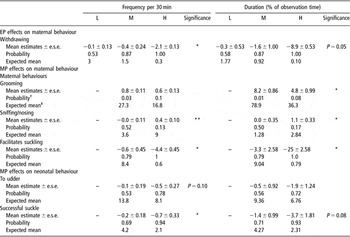
Plane of nutrition in EP affected the frequency and duration of the negative maternal behaviour ‘ewe withdraws from lamb’ with ewes offered diet L-EP performing this behaviour more frequently (P < 0.05) and for longer periods of time (P = 0.05) than ewes on diet M-EP or H-EP (Table 10). Lamb neonatal behaviours were not affected by plane of nutrition during EP (P > 0.05).
Effect of plane of nutrition of 1-year-old ewes in early (EP) and mid-pregnancy (MP) on the frequency and duration of maternal and neonatal behaviour at parturition

Nutrition provided: low (L), medium (M) or high (H) as compared to predicted metabolizable energy requirements for maintenance.
Mean estimates and estimated standard errors (e.s.e.) are on the latent scale; *significant at the 5% level, **significant at 1% level.
Probability: probability of not presenting the behaviour; expected mean: expected duration if all ewes present the behaviour.
Plane of nutrition in MP affected the duration of the maternal behaviour ‘grooms lamb(s)’, with ewes offered diet M-MP spending more time performing this behaviour than H-MP ewes (P < 0.05). This was concomitant with these ewes (M-MP) sniffing/nosing their lamb less frequently (P < 0.01) and for shorter periods of time (P < 0.05), while the behaviour ‘facilitates suckle’ was shown more frequently (P < 0.05) and for longer periods of time (P < 0.05). With regard to lamb neonatal behaviour, lambs born from ewes offered diet M-MP tended to show the behaviour ‘to udder’ more frequently (P = 0.10) than H-MP lambs. Accordingly, these lambs showed a higher frequency (P < 0.05) and duration (P = 0.08) of the behaviour ‘successful suckle’ compared with H-MP lambs. There were no differences between treatment groups in the latency to perform the behaviours by the lambs (P > 0.05).
Discussion
Early pregnancy nutrition
In the present study, there was a downward trend, which approached significance, in the number of lambs born per ewe mated as the plane of nutrition increased, in both 1- and 2-year-old ewes. This was concomitant with a non-significant but potentially important effect of EP diets on conception rate and with a smaller non-significant downward trend for number of lambs born per ewe lambing. The mechanism behind the negative relationship between post-mating feed intake and lamb output per ewe may be via peripheral plasma progesterone concentrations. Parr et al. (Reference Parr, Davis, Miles and Squires1993) proposed that increased food intake is related to increased metabolic clearance rates of progesterone, due to increased blood flow to the gut and liver. Progesterone has a major role in embryo survival and maintenance of pregnancy, through the control of maternal secretion of nutrients, growth factors and enzymes required for embryo development (reviewed by Ashworth, Reference Ashworth1995). In this study, a closer examination of plasma progesterone concentrations at the end of the EP period showed a positive association with conception rate (P < 0.001) and with the number of lambs born per ewe lambed (P < 0.05), for both 1- and 2-year-old ewes (associations between progesterone and reproductive parameters were tested by regression analysis taking account of dam age). This gives an indication that lower progesterone concentrations (found in treatment H-EP in both age groups) have the potential to affect embryo mortality in the early stages of gestation. Indeed, Parr et al. (Reference Parr, Davis, Fairclough and Miles1987) reported that pregnancy rates of ewes fed a high ration post-mating were reduced compared with ewes fed medium or low rations. However, when exogenous progesterone was given, pregnancy rates significantly increased in ewes fed the high ration, with no effect in medium- or low-ration ewes.
Previous work has indicated that plane of nutrition affects conception rates in primiparous but not multiparous ewes (Annett and Carson, Reference Annett and Carson2006). This is the first study to indicate that sensitivity to plane of nutrition in EP may also extend to 2-year-old biparous ewes. Annett (Reference Annett2004) reported that plasma progesterone levels of primiparous ewes are significantly lower than that of multiparous ewes and that for both age groups there is an inverse relationship between plane of nutrition and peripheral progesterone concentrations. However, this has not been related to decreased conception rates in the multiparous ewes (Annett and Carson, Reference Annett and Carson2006; Muñoz et al., Reference Muñoz, Carson, McCoy, Dawson, O’Connell and Gordon2008a). A closer examination of the data in the present study showed that plasma progesterone levels of 1- and 2-year-old ewes at day 42 differed (average of 5.4 and 8.2 ng/ml, respectively; s.e.d. 0.709, P < 0.001). Nevertheless, the increased sensitivity to lower peripheral progesterone concentrations shown by young 1- and 2-year-old ewes may be related to the overall mean level of the hormone. Considering the previously mentioned study of Muñoz et al. (Reference Muñoz, Carson, McCoy, Dawson, O’Connell and Gordon2008a), where progesterone concentrations for adult ewes averaged 7.5, 6.4 and 5.7 ng/ml for the three nutritional treatments, L-EP, M-EP and H-EP, respectively, and the results from the present study, in particular average progesterone levels for the H-EP treatments in 1- and 2-year-old ewes (3.4 and 5.3 ng/ml, respectively), there seems to be an indication that there is a minimum progesterone concentration necessary for embryo survival, and that while overfeeding mature ewes depresses progesterone concentration, the level of the hormone remains high compared to younger ewes. Parr et al. (Reference Parr, Davis, Fairclough and Miles1987) proposed a progesterone threshold for satisfactory conception of 2 ng/ml on day 12 of gestation of mature ewes, although the highest conception rates were noted for progesterone levels of 4–5 ng/ml.
The current study is the first to document the effects of EP nutrition on foetal size at various stages of pregnancy and subsequent lamb viability in 1- and 2-year-old ewes. This demonstrates that even in the early stages of embryonic life, when direct nutrient requirements for conceptus growth are negligible (Robinson et al., Reference Robinson, Sinclair and McEvoy1999) maternal nutrient intake still exerts direct influences. The present study indicates the long-term nature of foetal growth retardations associated with low planes of nutrition in EP in 1- and 2-year-old ewes, leading to reductions in foetal size measured in MP and continuing through to reductions in lamb birth weight. In contrast, when mature ewes were offered a low plane of nutrition in EP, the foetal growth retardation effects manifested at day 57 of gestation were no longer evident at day 68, showing capacity for compensatory growth (Muñoz et al., Reference Muñoz, Carson, McCoy, Dawson, O’Connell and Gordon2008a). These differences may occur due to a higher sensitivity or to a reduced ability of immature sheep to compensate for nutritional restriction or surplus in a period of specific demand. Nutritional influences during MP that affect placental development and consequently foetal growth rate are well documented (Kelly, Reference Kelly1992, Heasman et al., Reference Heasman, Clarke, Stephenson and Symonds1999; Redmer et al., Reference Redmer, Wallace and Reynolds2004). EP mechanisms have been less studied. In very early stages of embryo development, maternal nutrition (Walker et al., Reference Walker, Hartwich and Seamark1996) and hormone levels (Kleemann et al., Reference Kleemann, Walker and Seamark1994) have been reported to influence the allocation of cells between the inner cell mass (foetus) and the outer cell mass (placenta). Alterations in cell allocation at this stage change the trajectory of foetal growth, with a fast growth trajectory increasing the foetal demand for nutrients (reviewed by Godfrey and Robinson, Reference Godfrey and Robinson1998).
In the present study, 1-year-old ewes offered high-plane diets in EP gave birth to heavier lambs, which required more assistance at lambing. This is the first study to report the effect of EP and MP nutrition on the incidence of dystocia. There is a well-established link between birth weight and the incidence of dystocia in ewes (Grommers et al., Reference Grommers, Elving and Vaneldik1985; Dwyer et al., Reference Dwyer, Lawrence, Brown and Simm1996). However, dystocia is not related simply to birth weight. Grommers et al. (Reference Grommers, Elving and Vaneldik1985) identified birth presentation as the most significant factor influencing the incidence of parturition difficulty. Normal birth presentations in the current study most certainly influenced the amount of assistance required at lambing, but were not directly affected by plane of nutrition in EP. Also, pelvic dimension of the ewe may also have contributed to the incidence of dystocia (McSporran and Wyburn, Reference McSporran and Wyburn1979), as the differences found in primiparous ewes were not encountered in biparous ewes. However, although long and stressful deliveries have been associated with neonatal death in lambs (Dwyer et al., Reference Dwyer, Lawrence, Brown and Simm1996), in the present study, a high plane of nutrition was not associated with increased lamb mortality at birth or at 1 week of age.
In the present study, low-plane diets in EP were associated with a higher frequency and duration of primiparous ewes withdrawing from their lamb. These findings correspond with those of Dwyer et al. (Reference Dwyer, Lawrence, Bishop and Lewis2003) who found that primiparous 2-year-old ewes submitted to a moderate nutritional restriction (35%) throughout the whole of pregnancy showed deficits (reduction in total grooming time) in maternal care in comparison to ewes with adequate levels of feeding. To our knowledge, this is the first study to quantify the effects of differential planes of nutrition in EP and MP periods on the expression of maternal and neonatal behaviours at parturition in 1-year-old ewes.
One-year-old ewes offered low-plane diets in early gestation tended to have greater incidences of lamb mortality at 6 weeks of age. Reduced lamb survival following maternal undernutrition during pregnancy has been previously described (Vincent et al., Reference Vincent, Williams and Hill1985; Holst et al., Reference Holst, Killeen and Cullis1986; Hinch et al., Reference Hinch, Lynch, Nolan, Leng, Bindon and Piper1996) and it may be related to different factors in the present study. For example, lambs born to ewes offered low-plane diets in EP had the lowest birth weights and therefore could potentially have impaired thermoregulatory ability (Clarke et al., Reference Clarke, Yakubu and Symonds1997). From a maternal point of view, primiparous ewes in the present study were lighter during pregnancy and at lambing, as a result of EP treatments. There is a positive correlation between LW of dams in MP and lamb mortality to weaning, associated with heavier ewes having heavier placentas and consequently heavier birth weights (Kelly, Reference Kelly1992). Lighter ewes could also have their milk production potential impaired due to a reduction in udder weight and mammary development, and consequently, reduced colostrum and milk yield (Mellor, Reference Mellor1987). Additionally, there was a small indication of poorer maternal behaviour in ewes on low-plane diets, which potentially could play a role in the reduced survivability of these lambs, as lamb survival is crucially dependent on the adequate expression of maternal care from the ewe (Nowak et al., Reference Nowak, Porter, Levy, Orgeur and Schaal2000).
Mid-pregnancy nutrition
In the present study, despite 1- and 2-year-old ewes responding to nutritional regimes imposed during MP, the birth weights of their offspring were not affected. For 2-year-old ewes, this is not surprising as in several studies where maternal nutrient restrictions were imposed between early and mid-gestation and in mid- to late gestation, lamb birth weights at or near term were unaffected (for review see Redmer et al., Reference Redmer, Wallace and Reynolds2004). However, in 1-year-old ewes, there was a downward trend in foetal size as plane of nutrition in MP increased, although there were no effects on birth weights. It is interesting to compare these findings with the over-nourished adolescent ewe model of Wallace et al. (Reference Wallace, Luther, Milne, Aitken, Redmer, Reynolds and Hay2006) who reported reduced foetal growth and birth weight due to impaired placental development. In the present study there were no significant differences on placental development between MP treatments (no differences in cotyledon diameter), which is consistent with the lack of effect on birth weight at term. The differences between studies may most likely be explained by the level of the moderate and high-plane treatments given to the ewes in each trial. The diets offered in our study provided maternal growth rates of ~100 and ~150 g/day during the MP period for the medium- and high-plane diets, respectively, compared with the ~55 and ~300 g/day gained by the ewes from Wallace’s study (Reference Wallace, Bourke, Aitken and Cruickshank1999). Nevertheless, the planes of nutrition used in the current study are more appropriate to the range likely to be applicable in commercial production systems.
One-year-old ewes offered moderate plane diets in MP were associated with improved maternal behaviour at parturition, with ewes spending more time grooming their lambs and being more receptive to the lamb suckling than ewes offered high-plane diets. Furthermore, ewes offered high-plane diets showed more negative behaviour than moderate plane ewes. These findings could be related with these ewes requiring more assistance with lamb delivery. Ewe grooming behaviour is affected by birth difficulty, with an increase in the amount of intervention required to deliver a lamb resulting in an increase in the time taken for the ewes to start to groom the lamb (Dwyer et al., Reference Dwyer, Lawrence, Bishop and Lewis2003). Additionally, lambs born from ewes offered high-plane diets had poor offspring behaviour. Lamb neonatal behaviour in this case could be a response to poor maternal behaviour and consequently poor ewe–lamb bonding formation (Nowak, Reference Nowak1996). However, these data are consistent with results described by Muñoz et al. (Reference Muñoz, Carson, McCoy, Dawson, O’Connell and Gordon2008a) for adult ewes, who found a positive effect of medium-plane diets on offspring behaviour at parturition, although no differences in maternal behaviour were observed. These differences in maternal behaviour could be explained by parity, which has been reported to affect the expression of maternal behaviour at parturition with adolescent ewes displaying more inappropriate movements when lambs attempt to suckle than mature ewes (O’Connor et al., Reference O’Connor, Lawrence and Woodgush1992).
Conclusion
Altering the plane of nutrition in EP, where treatments were more severe than in MP, had greater effects on ewe reproduction and offspring performance. In 1-year-old ewes, a low plane of nutrition in EP was associated with higher prolificacy, although dams were lighter at parturition and presented poor maternal behaviour. Their offspring were lighter at birth and had higher incidences of mortality at 6 weeks. Similar findings were recorded in 2-year-old ewes. A medium plane of nutrition in 1-year-old ewes in MP was associated with larger foetuses in mid-gestation, and improved maternal and lamb behaviour at parturition.
Acknowledgements
The authors thank D. McBride and the Ulster Hospital for the analysis of thyroid hormones. Also, D. Irwin, E. Doyle and S. Wilson for technical assistance and the laboratory staff at the Veterinary Science Division for the laboratory analyses. This study was supported by Programme Alβan, the European Union Programme of High Level Scholarships for Latin America, scholarship no. E04D047780CL and the Department of Agriculture and Rural Development of Northern Ireland.