





1. Introduction
The recirculating flow behind three-dimensional bluff bodies in a steady uniform flow is a complex phenomenon, arising from the separation of boundary layers developing along the body and the subsequent closure further downstream. The region between the separation and the closure is characterised by a reversed flow impinging on the base of the body. At a larger Reynolds number, both the closure region and the reversed flow exhibit strong unsteadiness, leading to significant differences between mean and instantaneous flow structures, particularly for three-dimensional bluff bodies (Bearman Reference Bearman1997).
An insightful theoretical description was provided by Gerrard (Reference Gerrard1966), focusing on cylindrical bodies, where the closure is primarily governed by the two-dimensional Bénard–von Kármán global instability. This mechanism results, on average, in a recirculating region organised into two counter-rotating eddies with slow motion. For three-dimensional bluff bodies having a blunt rectangular base that are the focus of this article, there is no such dominated global near wake dynamics governing the closure mechanism. The literature rather reports an interplay of the identified global dynamics, such as pumping or breathing, a pair of anti-symmetric periodic modes, a pair of steady asymmetric modes and free shear layer instabilities (see for instance Podvin et al. (Reference Podvin, Pellerin, Fraigneau, Bonnavion and Cadot2021) for a categorisation of these dynamics based on three-dimensional proper orthogonal decomposition). One of the most remarkable features is the bistable dynamics, when the wake switches randomly from a steady asymmetric mode to the other one. As shown by Grandemange et al. (Reference Grandemange, Gohlke and Cadot2013b ), the waiting time between two switches is 3 orders of magnitude larger than that of the typical flow characteristic time based on the uniform incoming velocity and the body base height. In the following, the mean flow topology will refer to that of the wake locked in a steady asymmetric mode and not to the very long time averaging that would restore the flow geometry despite the permanent asymmetry of the wake. It is only very recently that Zampogna & Boujo (Reference Zampogna and Boujo2023) theoretically confirmed the steady instability observed experimentally by Grandemange, Gohlke & Cadot (Reference Grandemange, Gohlke and Cadot2012) and numerically by Evstafyeva, Morgans & Dalla Longa (Reference Evstafyeva, Morgans and Dalla Longa2017) in the laminar regime, resulting in an asymmetry towards the long axis direction of the rectangular base (or equivalently to a steady symmetry breaking with respect to the small axis of the base). Their result is in total agreement with the observation of Grandemange et al. (Reference Grandemange, Gohlke and Cadot2013a ) about the wake asymmetry direction dependence on the aspect ratio of the base, thus demonstrating the persistence of the steady instability of Zampogna & Boujo (Reference Zampogna and Boujo2023) to larger Reynolds number. It also makes very clear that the steady asymmetric modes of the turbulent wake are reminiscent of a flow bifurcation in the laminar regime.
The three-dimensional mean flow of the recirculating region has been subjected to different topological interpretations, and there is still not a definitive consensus. The large eddy simulation (LES) of Krajnović & Davidson (Reference Krajnović and Davidson2003) reported a vortex ring for the recirculating flow and a pair of counter-rotating longitudinal vortices downstream of the closure, confirming and complementing the previous results obtained experimentally by Duell & George (Reference Duell and George1999) on the same geometry. The vortex ring and the pair of longitudinal vortices were reported later in a LES by Rouméas et al. (Reference Rouméas, Gilliéron and Kourta2009). Bistable dynamics was not mentioned for these works, but an asymmetry in the recirculating flow was observed in the vertical direction.
With the evidence of the steady asymmetric modes by Grandemange et al. (Reference Grandemange, Gohlke and Cadot2013b
), the ring vortex should be tilted and associated with a base pressure gradient. Accordingly, the presence of a tilted low-pressure torus was confirmed both for wider than tall bodies (Lucas et al. Reference Lucas, Cadot, Herbert, Parpais and Délery2017; Dalla Longa, Evstafyeva & Morgans Reference Dalla Longa, Evstafyeva and Morgans2019; Fan et al. Reference Fan, Xia, Chu, Yang and Cadot2020) with a horizontal base pressure gradient and taller than wide bodies (Rao et al. Reference Rao, Minelli, Zhang, Basara and Krajnović2018, Reference Rao, Zhang, Minelli, Basara and Krajnović2019; Dalla Longa et al. Reference Dalla Longa, Evstafyeva and Morgans2019) with a vertical base pressure gradient. Rao et al. (Reference Rao, Minelli, Zhang, Basara and Krajnović2018) and Booysen, Das & Ghaemi (Reference Booysen, Das and Ghaemi2022) investigated the flow structure in cross-wind and showed that the ring tilts toward the leeward edge as the yaw is increased. The pair of counter-rotating longitudinal vortices downstream of the closure is also often reported but its origin remains unclear. While in McArthur et al. (Reference McArthur, Burton, Thompson and Sheridan2016) its direction of rotation matches the negative lift of the body, and thus could be directly related to a momentum balance in the vertical direction of a volume containing the body, Rao et al. (Reference Rao, Minelli, Zhang, Basara and Krajnović2018, Reference Rao, Zhang, Minelli, Basara and Krajnović2019) reported, for a similar body and negative lift, a symmetrically opposed wake, i.e. with longitudinal vortices having opposite rotation to that of McArthur et al. (Reference McArthur, Burton, Thompson and Sheridan2016). It is also worth mentioning that, in Krajnović & Davidson (Reference Krajnović and Davidson2003), the direction of rotation of the longitudinal vortex pair also does not match the negative lift of the body. The idea that the longitudinal pair of vortices is related to the asymmetric recirculating flow was investigated by Evrard et al. (Reference Evrard, Cadot, Herbert, Ricot, Vigneron and Délery2016), Perry, Pavia & Passmore (Reference Perry, Pavia and Passmore2016) and Schmidt et al. (Reference Schmidt, Woszidlo, Nayeri and Paschereit2018) who proposed to connect the pair of vortices identified downstream of the closure to the interior of the separation leading to open vortex rings. With a different approach, Pavia et al. (Reference Pavia, Passmore, Varney and Hodgson2020), Khan et al. (Reference Khan, Pastur, Cadot and Parezanović2024) visualised the near wake using the
 $x$
component of the vorticity to colour the iso-surface of a
 $Q$
-criterion value. Their analysis leads to open recirculation torus interpretation as sketched in Perry et al. (Reference Perry, Pavia and Passmore2016) and Khan et al. (Reference Khan, Pastur, Cadot and Parezanović2024). Similarly, Booysen et al. (Reference Booysen, Das and Ghaemi2022) also reported longitudinal vortices at yaw originating from the windward portion of the vortex ring, but without giving any topological description.
The aim of the present paper is to characterise the three-dimensional recirculating flow spatial structure behind a body at different attitudes to answer the following questions. How does the pair of longitudinal vortices at the closure relate to the asymmetric recirculating flow? How does the recirculating flow adapt to the change in body attitude taking into account ground effects and affect the body aerodynamics? How accurate is the base pressure gradient to inform us about the mean recirculating flow organisation? Fan, Parezanović & Cadot (Reference Fan, Parezanović and Cadot2022) has produced for a taller than wide square-back Ahmed body an orientation diagram of the base pressure gradient in the attitude parametric spaces of pitch, yaw and clearance and identified discontinuous transitions. The taller than wide base has an aspect ratio of 1.11 that produces the
 $z$
-instability of the wake (following Grandemange et al.’s (Reference Grandemange, Gohlke and Cadot2013a
) definition). The
 $z$
-instability is a permanent asymmetry in the vertical direction. This is in accordance with the Zampogna & Boujo (Reference Zampogna and Boujo2023) prediction showing that the direction of the asymmetry appears along the major axis, in this case being vertical. The present contribution completes the work of Fan et al. (Reference Fan, Parezanović and Cadot2022) with a three-dimensional investigation of the velocity field. Our strategy is to explore the full attitude parametric space of Fan et al. (Reference Fan, Parezanović and Cadot2022) with an experimental methodology that provides partial information about the velocity field and to further complete the study with a computational methodology to obtain the full spatial information of the most relevant attitudes.
This paper is organised as follows: § 2 details the experimental (§ 2.1) and numerical (§ 2.2) methodologies providing the flow geometries, measurements techniques and computational modelling. Aerodynamic force coefficients obtained with both methodologies in the attitude space are compared in § 2.3 to validate the dual methodology strategy. Results in § 3 exploring the attitude parametric space are presented in three sections. The first, § 3.1, provides visualisations of the three-dimensional recirculation flow structure, the second, § 3.2, focuses on the properties of the reversed flow (direction and intensity) and finally the third, § 3.3, investigates the four categories of unsteady transitions between different wake orientations. These results will be discussed in § 4 to clarify: (§ 4.1) the topology of the mean separation closure and recirculating flow structure for the body aligned with the wind, with the aim to understand the closure mechanism; (§ 4.2) the adaptation of the recirculation structure to the body attitude and its consequences for body aerodynamics; (§ 4.3) the presence of the steady instability in the body attitude space; (§ 4.4) the role of the static ground in shaping the recirculating flow structure. Finally, § 5 concludes the paper.
2. Methodologies
2.1. Experimental set-up
2.1.1. Model geometry and wind tunnel
The experimental set-up is identical to that of Fan et al. (Reference Fan, Parezanović and Cadot2022), where the model geometry is a square-back Ahmed body, as depicted in figure 1, with dimensions
 $L=560$
,
 $W=180$
and
 $H=200$
mm. The body is supported by four cylinders of 15 mm diameter, with adjustable front and rear clearances. The radius of the rounding of the forebody is 70 mm. The rectangular base is taller than wide, with an aspect ratio
 $H/W=1.11$
. Two interchangeable afterbodies (see figure 1
 $a$
) having the same external dimensions but with either a flat back (the baseline geometry) or a rear cavity are tested. The cavity is produced by pushing the rectangular base inwards towards the body, to create a depth of
 $d=70$
mm
 $=0.35H$
, with four sides of thickness
 $e=5$
mm. The depth has been chosen to suppress the steady instability as recommended in Evrard et al. (Reference Evrard, Cadot, Herbert, Ricot, Vigneron and Délery2016) and Lucas et al. (Reference Lucas, Cadot, Herbert, Parpais and Délery2017).
Sketch of the experimental set-up showing the isometric view (
 $a$
) of the model, with base pressure taps marked as dots, a side view (
 $b$
) and a top view (
 $c$
). The detail in (
 $a$
) is the afterbody with a rear cavity. The two coordinates systems (
 $oxyz$
) and (
 $OXYZ$
) are shown at two attitudes in (
 $b,c$
), where the dashed line represents the body at the wind aligned attitude. The two particle image velocimetry measurement planes,
 $X^*=0.5$
and
 $y^*=0$
, are highlighted with green and blue colours, respectively in (
 $a,b,c$
).

As shown in figure 2, the model is placed on two motorised elevators (Standa 8MVT100-25-1) to control independently the clearances of the front and rear axles with a resolution of
 ${5}\,{\mu } \textrm {m}$
. This system, with two degrees of freedom, allows to adjust independently the clearance
 $C$
measured at mid-distance between front and rear axles and the pitch angle
 $\alpha$
(see figure 1
 $b$
). This assembly is mounted on a turntable driven by a motorised rotation stage (Standa 8MR 190-90-59) to control the yaw angle
 $\beta$
(see figure 1
 $c$
) with a precision of
 $0.02^\circ$
. In this paper, the mid-clearance is set at
 $C=20$
mm, thus the body attitude is only varied in yaw and pitch (
 $\beta , \alpha$
).
Detailed set-up of the wind tunnel test section, showing the model mounting in side view (
 $a$
) and the rear view (
 $b$
).

Two coordinate systems will be used to present the results. The system (
 $oxyz$
) is associated with the force balance and rotates with the yaw
 $\beta$
. Its origin
 $o$
is at the centre of the body base, as indicated in figure 1(
 $b{,}c$
). The
 $z\hbox{-}$
direction is normal to the ground, the
 $x$
-direction is parallel to the ground and the
 $y$
-direction, normal to the lateral sides, completes the direct trihedral. The other coordinate system (
 $OXYZ$
) is fixed (see figure 1
 $b{,}c$
) and associated with the test section. The
 $X$
-direction is aligned with the incoming uniform wind, the
 $Z$
-direction is normal to the ground and the
 $Y$
-direction completes the direct trihedral. The two origins,
 $O$
and
 $o$
, coincide for the body positioned at the wind aligned attitude
 $(\beta =\alpha =0^\circ )$
.
Experiments are carried out in a blowing wind tunnel having a test section
 $1.2$
m wide by
 $0.6$
m high and
 $2.4$
m long (see figure 2). The free-stream turbulence intensity is lower than
 $1\,\%$
, and the blockage ratio is
 $4.9\,\%$
for the body at the wind aligned attitude. When the body is not in the test section, the ground boundary layer thickness based on
 $99\,\%$
of the free-stream velocity is
 $\delta _{0.99}=9$
mm at the location of the front of the body. Reference pressure
 $p_\infty$
and dynamic pressure
 $q_\infty$
are obtained in the test section ahead the body with a Furness Control FCO560 precision manometer. In the following, the dynamic pressure is set to
 $q_\infty =150$
Pa, corresponding to a wind tunnel speed
 $U_\infty =16$
m s–1 and Reynolds number
 $Re=U_\infty H/ \nu \approx 2.1\times 10^5$
, where
 $\nu$
is the kinematic viscosity of the air at ambient temperature.
The height of the body
 $H$
and the free-stream velocity
 $U_\infty$
are chosen as length and velocity scaling units, respectively. For the remainder of the paper, any quantity such as
 $a^*$
with an asterisk represents those non-dimensional units. For example, the non-dimensional time is defined as
 $t^*=tU_\infty /H$
, and the non-dimensional ground clearance is
 $C^*=C/H$
.
2.1.2. Force measurements
The six-component force balance (F/T Sensor: Gamma IP65, manufactured by ATI Industrial Automation) is supporting the two elevators and rotates with the rotary stage. It thus measures the three components
 $f_x$
,
 $f_y$
,
 $f_z$
in the coordinate system (
 $oxyz$
) as depicted in figure 1(
 $b{,}c$
). In the ground vehicle context,
 $f_x$
would be the aerodynamic drag opposite to the vehicle motion,
 $f_y$
the side force perpendicular to the motion and parallel to the ground and
 $f_z$
the lift force perpendicular to the ground. The model frontal area
 $S=H \times W$
is used to calculate the force coefficients
 \begin{equation} c_i=\frac {f_i}{q_\infty S} (i=x, y, z). \end{equation}
The force balance resolution is 0.025 N for
 $f_x$
,
 $f_y$
and 0.05 N for
 $f_z$
, which translates to
 $5\times 10^{-3}$
for
 $c_x$
,
 $c_y$
, and
 $10 \times 10^{-3}$
for
 $c_z$
. However, mean force balance measurements show a better resolution than that of the manufacturer. It has been checked through calibrated mass weight measurements in the
 $x$
component to be 0.005 N, say 0.001 in drag coefficient.
2.1.3. Pressure measurements
The base pressure is measured at 20 locations, as shown in figure 1(
 $a$
). The pressure is measured with a Scanivalve ZOC33/64PX pressure scanner placed inside the body. Tubes connecting taps and scanner never exceed 50 cm, leading to a natural low pass filtering having a cutoff frequency of approximately 50 Hz. The pressure data are low pass filtered with a moving window of duration 50 ms equivalent to
 $t_{{w}}^*=3.95$
, corresponding to a cutoff frequency
 $f_{{c}}=20$
Hz, i.e.
 $f_c^*=0.25$
. The sampling frequency is 1 kHz per channel. The reference pressure
 $p_\infty$
of the test section is used to compute the instantaneous pressure coefficient
 \begin{equation} c_p=\frac {p-p_\infty }{q_\infty }. \end{equation}
The base suction coefficient
 $c_b$
is computed from the average of the
 $N=20$
pressure taps at the base
 \begin{equation} c_b=-\frac {1}{N} \sum _{i=1}^{N} c_{pi}. \end{equation}
The base suction coefficient is always positive and follows trends similar to those for the drag coefficient
 $c_x$
of the model (Roshko Reference Roshko1993). The pressure scanner accuracy has been estimated in Fan et al. (Reference Fan, Parezanović and Cadot2022) to
 $\pm 0.5$
Pa, which translates to
 $\pm 0.005$
in terms of mean pressure coefficient or base suction coefficient. Following the same method as Fan et al. (Reference Fan, Parezanović and Cadot2022), the four pressure taps (A, B, C, D) indicated in red in figure 1(
 $a$
) are used to compute the two components of the base pressure gradient.
 \begin{align} g_y=\frac {(c_p({B})+c_p({D}))-(c_p({A})+c_p({C}))}{2\delta y^*} ,\end{align}
 \begin{align} g_z=\frac {(c_p({A})+c_p({B}))-(c_p({C})+c_p({D}))}{4\delta z^*} .\end{align}
2.1.4. Velocity measurements
A stereo particle image velocimetry (stereo-PIV) system from LAVISION is used to investigate the wake. It includes a Litron dual pulse laser (Nd: YAG,
 $2 \times 100$
mJ) and a pair of high-speed Phantom cameras (VEO 340L) with a resolution of 1600
 $\times$
2560 pixels. The set-up acquires image pairs at a rate of 15 Hz. The size of the interrogation window is
 $48 \times 48$
pixels with an overlap of
 $75\,\%$
. The measurements are performed in two planes for a given body attitude: one at a fixed cross-section of
 $X^*=0.5$
(displayed as the green sheet in figure 1), and the other at
 $y^*=0$
which is perpendicular to the model base, i.e. that rotates with the yaw attitude (displayed as the blue sheet in figure 1). The
 $48 \times 48$
pixels of the interrogation window correspond to a physical size of
 $0.04 H \times 0.04 H$
in the plane
 $X^*=0.5$
and of
 $0.06H \times 0.06H$
in the plane
 $y^*=0$
.
The following results are based on three campaigns of stereo-PIV measurement. A first campaign explores 50 body attitudes (
 $\beta , \alpha$
) for which 600 snapshots are recorded for each attitude during 40 s to obtain the mean velocity field in the planes
 $X^*=0.5$
and
 $y^*=0$
. Synchronised stereo-PIV and base pressure measurements are conducted at 4 body attitudes in a second campaign. For these specific attitudes where unsteady wake transitions occur, each acquisition records 1500 snapshots during 100 s, and again, repeated twice to have the velocity field in both planes
 $X^*=0.5$
and
 $y^*=0$
. The last campaign explores 9 attitudes with identical measurements to the first campaign but with the body equipped with a rear cavity.
2.2. Numerical set-up
There is no attempt in the simulation to reproduce exactly the experimental conditions. The reason for this choice is based on the following two considerations: (
 $i$
) to avoid resolving the boundary layer along all the test section’s walls with wall-resolved LES which would greatly increase the computational cost, (
 $ii$
) to avoid regenerating the mesh for each yawing condition which would not guarantee mesh consistency between cases, potentially introducing additional errors when comparing different yaw angles. Consequently, the computational domain is made much larger than the wind tunnel test section. The following sections introduce the computational model and numerical method. Details of the mesh generation and validation are provided in the Appendix.
2.2.1. Computational model
The model is placed in a domain with a cross-section of
 $20H\times 10H$
(see in figure 3). The front face of the body is located at a distance of
 $10H$
from the domain inlet, and the downstream length between the rear face of the body and the domain outlet is
 $30H$
. The ratio of the Ahmed body cross-section to the domain cross-section is 0.1 %, small enough to neglect blockage effects. The boundary conditions at the null-yaw attitude were specified according to SAE J2966 (2017) as follows: a uniform velocity for the inlet; pressure outlet for the outlet; no-slip wall condition for the body and the stationary ground; slip wall condition for the top and sidewalls. At the yaw attitude (
 $\beta \neq 0$
), the boundary condition of the windward sidewall is modified to a velocity inlet, while that of the leeward sidewall is changed to a pressure outlet. In addition, to determine the ground boundary layer thickness, a case was conducted for an empty computational domain without the model. The ground boundary layer thickness is
 $\delta _{0.99}^{\textit{LES}}=6$
mm at the location of the front of the body that is smaller than the thickness of
 $\delta _{0.99}=9$
mm obtained for the experiment. Supported by the extensive validation reported, we believe that this difference is not critical for the development of the flow.
Computational domain and boundary conditions in side view (
 $a$
) and front view (
 $b$
).

2.2.2. Numerical method
In this study, wall-resolving LES (WRLES) is employed to investigate the flow around the three-dimensional bluff body. The LES equations are discretised using the open-source finite volume solver ELEMENTS-v4.1.1 (Engys® 2023), which is built upon OpenFOAM. Turbulence at subgrid-scale levels is modelled using the wall-adapting local eddy-viscosity model (Nicoud & Ducros Reference Nicoud and Ducros1999). The unsteady incompressible Navier–Stokes equations are solved using the pressure implicit with splitting of operators for pressure-linked equations), which combines the pressure-implicit with splitting of operators and semi-implicit method for pressure-linked equations algorithms. Both spatial and temporal terms of the governing equations are discretised with second-order schemes.
For all the cases in this study, a time step of
 $\Delta t^*=\Delta tU_\infty /H=0.004$
is used to ensure the Courant–Friedrichs–Lewy number to be approximately one in more than 95 % of the domain. All simulations are initialised from a quiescent state. After an initial five flow passages corresponding to 200
 $H/ U_\infty$
(a flow passage duration from the inlet to the outlet of the domain is 40
 $H/ U_\infty$
), flow quantities and forces are averaged over the subsequent fifteen passages, i.e. for a duration of 600
 $H/ U_\infty$
.
2.3. Experiment vs. computation in the attitude space
Experiments are conducted for 50 body attitudes with the objective to extract the mean flow properties of the near wake. These attitudes are marked with filled circle symbols in figure 4 which are superimposed to the transition diagram of Fan et al. (Reference Fan, Parezanović and Cadot2022). Using the same notations as Fan et al. (Reference Fan, Parezanović and Cadot2022), each of the regions I, II, III and V in this attitude space corresponds to an orientation of the base pressure distribution asymmetry, also referred to as a state. It is characterised by the mean vertical gradient component
 $\overline {g_z}= G_z$
that is positive in regions II and V and negative in region I. The states are thus denoted
 $P_z$
and
 $N_z$
for positive and negative in the
 $z$
(vertical) direction. In region III, the base pressure distribution asymmetry is dominantly horizontal (the
 $y$
-direction) with a positive value, thus denoted
 $P_y$
. The thin blue and red lines represent continuous transitions from one state to the other while the magenta stripe locates regions with high fluctuations, exclusively observed in
 $g_z$
. It is also a transitional region, but discontinuous and related to a bi-stable dynamics involving the two states belonging to both sides of the stripe. The star symbols in figure 4 are attitudes where the fluctuations are locally maximum; these attitudes are chosen to investigate the flow field during the unsteady transitions between the I–II, I–III and I–V regions. For these attitudes with a star symbol, the flow field measurement is coupled with synchronised base pressure distribution measurement.
Force components and base suction coefficients obtained for the experiment, using the correction factor
 $C_i/C_i^{\textit{WT}}$
(see 2.6), and LES, at different body attitudes.

Body attitudes investigated with both experiments and LES. The
 $(\alpha , \beta )$
parametric space is superimposed to the transition diagram reported in Fan et al. (Reference Fan, Parezanović and Cadot2022) (see the text).

The LES are computed for the 10 attitudes marked with cyan filled circles in figure 4. All
 $C_b^{\textit{LES}}, C_x^{\textit{LES}}, C_y^{\textit{LES}}$
values obtained from the LES were systematically smaller in absolute value than those obtained directly from the wind tunnel measurements. Since the LES geometry has no blockage effect compared with the wind tunnel experiment, we felt it appropriate to apply the classical blockage correction to all experimental coefficients. In the following,
 $C_x, C_y, C_z$
and
 $C_b$
denote the corrected values of the experimental coefficients of drag, side force, lift and base suction coefficient, respectively, using the formula
 \begin{equation} C_i = C_i^{\textit{WT}} \left ( 1-\frac {A_{{m}}(\alpha , \beta )}{A_{{t}}}\right )^2, \end{equation}
where
 $i=x,y,z,b$
, the superscript WT denotes the value measured in the wind tunnel,
 $A_{{m}}$
is the projected area of the model depending on the body attitude and
 $A_{{t}}=1.2\,\text{m} \times 0.6\,\text{m}$
the wind tunnel cross-test section. Table 1 lists the experimental and LES coefficients for the 10 attitudes as well as the applied correction factor as defined in (2.6). The LES validation can be globally appreciated for all attitudes with the plots in figure 5 comparing the four coefficients of the simulation with those of the experiments. On each plot, we show a dashed line trend that is a linear fit for figure 5(
 $a{-}c$
) and an affine fit for figure 5(
 $d$
). Despite a dispersion of 7 % maximum off the trend, the drag coefficients in figure 5(
 $a$
) are quite consistent. A better correspondence is obtained for the base drag in figure 5(
 $b$
) with a smallest dispersion of 3 % maximum off the trend and only 4 % systematic overestimate for the LES. We ascribe this poor correlation of the total drag to vibrations in the
 $x$
-component of the force signal excited by the flow unsteadiness and to the high aerodynamic sensitivity of the smooth body nose separations. The side force coefficient in figure 5(
 $c$
) is also satisfactory but with a larger systematic overestimate of 10 %. It is important to stress that the trend of the agreement is respected in a linear fashion for these coefficients. However, the lift coefficient shows a clearly lower value for the computed flow than for the experimental flow in figure 5(
 $d$
). We believe that the discrepancies in the aerodynamic coefficients can primarily be attributed to differences in the flow caused by the blockage in the wind tunnel, the sensitive smooth separations and reattachment on the forebody and the ground boundary layer thickness upstream of the body that is 6 mm in the simulation against 9 mm in the experiment. Nevertheless, although the force coefficients may differ, we will see later that the experimental flow change around the body base with the change of attitude is accurately retrieved by the LES.
Comparison of the aerodynamic coefficients from experiments and the LES: (
 $a$
) drag; (
 $b$
) base suction; (
 $c$
) side force and (
 $d$
) lift.

3. Results
3.1. Mean structure of the recirculating flow vs. body attitude
Figure 6 shows representations of the three-dimensional mean flow computed by the LES, either visualised using the
 $Q$
-criterion in figure 6(top), or with few streamlines seeded at the base in figure 6(bottom). At the wind aligned attitude in figure 6(
 $a$
) the flow at the base is dominated by the N
 $_z$
state, as expected by the transition diagram in figure 4. Figure 6(
 $a$
, top) shows a clear pair of longitudinal vortices, noted here as
 $V^+$
and
 $V^-$
, forming outside the recirculating region. Interestingly, if these two longitudinal vortices were to be produced by a three-dimensional effect, resulting from a lift created on the body (see the lifting line theory in Batchelor (Reference Batchelor2002) for instance), this lift would have to be positive to be consistent with the vortex pair rotation, while the lift coefficient at
 $(\beta = 0^\circ , \alpha =0^\circ )$
given in table 1 is actually negative. Although the simulation shows difficulties to predict lift, as commented in figure 5(
 $d$
), the experiment confirms a negative lift at the same attitude in table 2. A negative lift is also reported for similar bodies in the experiments of Grandemange et al. (Reference Grandemange, Gohlke and Cadot2013b
) and Evrard et al. (Reference Evrard, Cadot, Herbert, Ricot, Vigneron and Délery2016). Far wake vortex pair rotation that does not match the lift sign is also found in Krajnović & Davidson (Reference Krajnović and Davidson2002) and Rouméas et al. (Reference Rouméas, Gilliéron and Kourta2009). This apparent inconsistency will be discussed in § 4.1 . The streamlines inside the separated region, seeded just above the bottom trailing edge of the base, evidence a recirculating torus in figure 6(
 $a$
, bottom). Such a torus is generally observed using an iso-Cp visualisation surface as previously reported in Krajnović & Davidson (Reference Krajnović and Davidson2003), Rouméas et al. (Reference Rouméas, Gilliéron and Kourta2009), Grandemange et al. (Reference Grandemange, Gohlke and Cadot2013b
), Rao et al. (Reference Rao, Minelli, Zhang, Basara and Krajnović2018, Reference Rao, Zhang, Minelli, Basara and Krajnović2019), Dalla Longa et al. (Reference Dalla Longa, Evstafyeva and Morgans2019) and Fan et al. (Reference Fan, Xia, Chu, Yang and Cadot2020). The two mean flow representations of figure 6(
 $a$
) do not show any connections between the toroidal flow and the longitudinal vortices
 $V^+$
and
 $V^-$
, which questions some topological sketch attempts of the recirculating region reported in the literature (Evrard et al. Reference Evrard, Cadot, Herbert, Ricot, Vigneron and Délery2016; Perry et al. Reference Perry, Pavia and Passmore2016; Pavia et al. Reference Pavia, Passmore and Sardu2018; Schmidt et al. Reference Schmidt, Woszidlo, Nayeri and Paschereit2018; Pavia et al. Reference Pavia, Passmore, Varney and Hodgson2020; Khan et al. Reference Khan, Pastur, Cadot and Parezanović2024); this will be discussed later in § 4.1. From figure 4, it is observed that the opposite P
 $_z$
state should be triggered for the body pitched down at
 $\alpha =-1.5^\circ$
, keeping the yaw
 $\beta =0^\circ$
. This near wake reversal is seen in figure 6(
 $b$
, top), which is actually equivalent to a
 $\pi$
rotation around the
 $x-$
axis of the whole spatial structure of figure 6(
 $a$
, top). In the next figure 6(
 $c$
, top), when the body is at yaw with
 $\beta =+6^\circ$
and no pitch
 $\alpha =0^\circ$
, the vortex pair
 $V^+$
and
 $V^-$
still remains unambiguously observable. Compared with the attitudes with no yaw
 $\beta =0^\circ$
, the positive yaw has provoked a rotation of
 $\pi /2$
around the
 $x$
-axis of the whole flow structure separating from the rectangular base. This spatial structure is in agreement with the P
 $_y$
state predicted in figure 4, indicating an asymmetry of the base flow in the horizontal direction. The streamline visualisation in figure 6(
 $b{,}c$
bottom) confirms the presence of the torus at pitch and yaw attitudes, and with, again, no direct connections of the recirculating flow with the longitudinal vortices
 $V^+$
and
 $V^-$
.


Separated and recirculating mean flow visualisations at different body attitudes: (
 $a$
) wind aligned
 $(\beta =\alpha =0^\circ )$
, (
 $b$
) nose-down attitude
 $(\beta = 0^\circ , \alpha =-1.5^\circ )$
and (
 $c$
) with yaw at
 $(\beta = 6^\circ , \alpha =0^\circ )$
. In (
 $c$
), the windward side is on the right-hand side of the base. Top row (isometric view) and middle row (side view) show the isosurface of
 $Q^*=12.5$
, coloured by the longitudinal vorticity component
 $\varOmega _x^*$
; the bottom row are streamlines seeded close to the base surface.

Figure 6(
 $c$
) shows a system of longitudinal vortices surrounding the separated base flow. This system that appears with significant yaw originates from three-dimensional separations on the lateral body edges (similar system has been reported by McArthur et al. Reference McArthur, Burton, Thompson and Sheridan2018; Rao et al. Reference Rao, Minelli, Zhang, Basara and Krajnović2018; Booysen et al. Reference Booysen, Das and Ghaemi2022) and will be detailed at the end of this section. While each of these longitudinal structures appears smooth in the mean flow, the pair of longitudinal vortices
 $V^+$
and
 $V^-$
is in contrast significantly noisy, indicating a lack of convergence due to dominating turbulent motions at the separation closure.
The experimental PIV technique provides measurements of the three velocity components in the two perpendicular planes, as shown in figure 7(
 $a{,}b$
) for the wind aligned attitude. Two foci can be identified in the
 $X^*=0.5$
plane of figure 7(
 $a$
) and two centres of rotation in the
 $y^*=0$
plane of figure 7(
 $b$
). These four specific points denoted with cross symbols in figure 7(
 $a{,}b{,}c$
) are assumed to be at the intersections of the recirculation torus evidenced in figure 6(bottom) with the two perpendicular measurement planes. Using the full three-dimensional data of the LES, it is possible to extract a vortex line, made from local centres of rotation which are identified with the eigenvector method (Sujudi & Haimes Reference Sujudi and Haimes1995; Haimes & Kenwright Reference Haimes and Kenwright1999). This is shown as the vortex red line in figure 7(
 $c$
) that evidences the recirculating torus. The same technique was used in Rao et al. (Reference Rao, Minelli, Zhang, Basara and Krajnović2018). The low pressure at the base in figure 7(
 $c$
) indicated by the blue region is actually facing the part of the vortex line that is the closest to the base. In opposition, the highest pressure region indicated by the red colour is facing the part of the vortex line the further apart from the base. This is in agreement with the analyses of Lucas et al. (Reference Lucas, Cadot, Herbert, Parpais and Délery2017), Rao et al. (Reference Rao, Minelli, Zhang, Basara and Krajnović2018), Dalla Longa et al. (Reference Dalla Longa, Evstafyeva and Morgans2019) and Ahmed & Morgans (Reference Ahmed and Morgans2022, Reference Ahmed and Morgans2023).
Mean flow characteristic for the baseline body attitude (
 $\beta =0^\circ$
,
 $\alpha =0^\circ$
): (
 $a,b$
) experimental velocity fields on the
 $X^*=0.5$
plane (
 $a$
) and
 $y^*=0$
plane (
 $b$
); (
 $c$
) LES simulation showing the identified recirculating torus (the vortex core is highlighted with a red thick line) and the base pressure coefficient distribution. The white dashed line in (
 $a$
) denotes the isoline
 $U^*=0$
, while white crosses are used to facilitate references between the two pictures.

Figure 8(
 $a{,}b{,}c)$
presents the mean velocity field for the three pitch angles
 $\alpha =-1.5^\circ , +1.5^\circ$
and
 $+2.6^\circ$
respectively without yaw,
 $\beta =0^\circ$
. There is a visual aid at the end of each row to spot the corresponding body attitude in the transition diagram of figure 4. From a negative pitch angle (figure 8
 $a$
) which selects a P
 $_z$
state, nosing up the body as shown in figure 8(
 $b$
) introduces an additional downwash velocity into the external flow of the recirculating bubble. This additional negative vertical velocity component is clearly visible comparing the upper part of the velocity field in figure 8(
 $a$
, middle) with figure 8(
 $b$
, middle). This downwash induces a top/down reversal of the whole recirculating flow structure together with the base pressure distribution in figure 8(
 $a{,}b$
, right) and forces the base flow to be in the N
 $_z$
state in figure 8(
 $b$
). However, this mechanism no longer applies at larger nose-up angles, as shown in figure 8(
 $c$
) for
 $\alpha =+2.6^\circ$
, where a P
 $_z$
state is again observed. The new reversal at large pitch angles from an N
 $_z$
to a P
 $_z$
state can be attributed to a ground effect caused by the boundary layer separation at the proximity of the bubble end. A ground separation is actually already visible in figure 8(
 $b$
, middle) at the approximated location marked with an
 $S$
, and it is even more pronounced in figure 8(
 $c$
, middle) with diverging streamlines leaving the wall. This separation likely generates enough upwash to reverse the recirculation to the P
 $_z$
state from the N
 $_z$
state, which would naturally be selected by a positive pitch in the absence of the ground separation. The recirculation torus identified as the red vortex lines in figure 8(right) tilts following the pressure gradient orientation in a such way that the gradient is always oriented from where the torus part is the closest to the base (the blue region of the base) to where the torus part is the further apart to the base (the red region of the base).
Mean flow characteristics at
 $\beta =0^\circ$
for three pitch attitudes: (
 $a$
)
 $\alpha =-1.5^\circ$
; (
 $b$
)
 $\alpha =+1.5^\circ$
; (
 $c$
)
 $\alpha =+2.6^\circ$
. Experimental velocity fields in the
 $X^*=0.5$
plane (left) and
 $y^*=0$
plane (middle); LES with the identified torus (vortex core highlighted by a red thick line) and base pressure coefficient distribution (right). The black point in the thumbnail (far right) is used as a visual aid to locate the body attitude from the transition diagram of figure 4. See figure 7 for the colour scales of the velocity
 $U^*$
and the pressure coefficient
 $C_p$
.

We now look at the near wake with yaw attitudes. At
 $\beta =+6^\circ$
, the cross-flow component in the horizontal direction becomes a dominant feature, as can be seen in the mean velocity field for
 $\alpha =-1.5^\circ$
and
 $\alpha =0^\circ$
in figure 9(
 $a{,}b$
, left), respectively. For these 2 cases, the cross-flow component that was vertical at
 $\beta =0^\circ$
has now rotated towards the horizontal direction due to the flow deviation along the leeward side of the body. In contrast, for the large nose-up attitude in figure 9(
 $c$
, left), the cross-flow in the recirculating region remains globally vertical despite the imposed yaw, and looks similar to a P
 $_z$
state with no yaw, as in figure 8(
 $a$
). This vertical orientation is clearly associated with the separation on the ground observable at the point
 $S$
in figure 9(
 $c$
, middle). The separation likely creates again sufficient upwash to force a P
 $_z$
state of the wake. It is thus plausible that, at this moderate yaw, the steady instability of the recirculating bubble persists such that the ground separation is able to select its P
 $_z$
state. The recirculation torus is still identifiable at this moderate yaw as can be seen in figure 9(right). In figure 9(
 $a$
,
 $b$
, right), the tilt orientation of the torus, initially vertical with no yaw, has rotated towards the horizontal direction. We can see a good correlation between the global orientation of the reversed cross-flow localised inside the white dashed lines in figure 9(left) and both the orientations of the base pressure gradient and the tilt orientation of the torus in figure 9(right).
Details as for figure 8. Yaw at
 $\beta =+6^\circ$
for three pitch attitudes: (
 $a$
)
 $\alpha =-1.5^\circ$
; (
 $b$
)
 $\alpha =0^\circ$
; (
 $c$
)
 $\alpha =1.5^\circ$
. The windward side is on the right-hand side of the base (
 $Y^*\gt 0$
).

As shown in the next figure 10, the pitch angle has almost no effect on the recirculating flow topology when the body is yawed at a larger angle
 $\beta =+12^\circ$
. The cross-flow from the leeward side becomes obviously stronger in figure 10(left), forcing the two foci inside of the recirculation region to move to the windward side. In the
 $y^*=0$
plane (figure 10, middle), a shorter recirculation bubble length can be seen from the case
 $\beta =6^\circ$
. The main noticeable observation is that the strong separation on the ground observed in figure 9(
 $c$
, middle) at
 $\beta =+6^\circ$
is considerably reduced in figure 10(
 $c$
, middle) by increasing the yaw at a given pitch. As a consequence, the P
 $_z$
state is not observable anymore. This is in accordance with the boundary shape of region II in figure 4 where the P
 $_z$
state is observed for positive pitch, and we can conclude that the P
 $_z$
state in region II is triggered by the separation on the ground. The torus becomes more difficult to identify at large yaw, as shown in figure 10(right). Nevertheless, conclusions from above still hold with a tilt orientation of the torus aligned with both the base pressure gradient and the reversed cross-flow.
Details as for figure 8. Yaw at
 $\beta =+12^\circ$
for three pitch attitudes: (
 $a$
)
 $\alpha =-1.5^\circ$
; (
 $b$
)
 $\alpha =0^\circ$
; (
 $c$
)
 $\alpha =1.5^\circ$
. The windward side is on the right-hand side of the base (
 $Y^*\gt 0$
).

We have reported so far about the spatial properties of the recirculating region of the base separation, but some classical longitudinal structures induced by yawing the body are also visible in figure 9(left) at
 $\beta =+6^\circ$
, and figure 10(left) at
 $\beta =+12^\circ$
. These structures, that are external to the recirculating bubble, originate from the three-dimensional separation on the lateral edges as can be seen in the LES flow visualisation of figure 11. The organisation of these main structures does not seem to be influenced by the recirculation state, at least in the near wake region we are studying. There are two structures originating from the windward side denoted
 $W_1$
and
 $W_2$
; while
 $W_1$
is the three-dimensional separation along the lateral edge,
 $W_2$
is related to a separation on a forebody edge (Ahmed & Morgans Reference Ahmed and Morgans2023). We can see two other main structures on the leeward side,
 $L_1$
due to the three-dimensional separation along the top lateral edge and
 $L_2$
originating from the bottom forebody edge. Except from
 $W_2$
that is out of the PIV fields, these main structures can be easily identified in the experimental flow for the same attitude in figure 10(
 $b$
, left). We can see that pitching down the body in figure 10(
 $a$
, left) produces equivalent
 $W$
structures but at the bottom edge. At the smaller yaw
 $\beta =+6^\circ$
in figure 9(left), the distinction between
 $W_1$
and
 $W_2$
is less evident;
 $L_1$
is observable and
 $L_2$
appears at the bottom edge of the PIV field in figure 9(
 $b$
,
 $c$
, left). Finally, the two vortices
 $V^+$
and
 $V^-$
originating from the base separation have the same configuration as for
 $\beta =+6^\circ$
shown in figure 6(
 $c$
).
Visualisation from the leeward (
 $a$
) and windward (
 $b$
) side of the flow around the body at yaw attitude
 $\beta =12^\circ , \alpha =0^\circ$
through the isosurface of
 $Q^*=12.5$
coloured by the longitudinal vorticity component
 $\varOmega _x^*$
.

The next section analyses all the investigated configurations displayed in figure 4 to address more quantitatively the effect of the body attitude on the tilt orientation of the recirculation torus and its relationship with the base pressure gradient. The rear cavity effect will be also introduced to evaluate the steady instability role on the tilt orientation of the recirculation torus at non-aligned attitudes in pitch and yaw.
3.2. Reversed flow characterisation with body attitudes and rear cavity effect
In order to obtain a global quantification of the body attitude on the recirculating flow topology, we compute the conditionally averaged velocity components
 $\langle U^* \rangle _{{R}}$
,
 $\langle V^* \rangle _{{R}}$
and
 $\langle W^* \rangle _{{R}}$
within the reversed flow region defined as the region where
 $U^*\lt 0$
in the
 $X^*=0.5$
plane. It actually corresponds to the spatial averaging inside the
 $U^*=0$
contour displayed with the dashed white line in figures 8(left), 9(left) and 10(left).
Figure 12(
 $a$
) compares the cross-flow component orientation of the reversed flow, given by the angle
 $\theta _{{R}} = \arctan ({\langle W^* \rangle _{{R}}}/{\langle V^* \rangle _{{R}}}) $
with the orientation of the base pressure gradient, given by
 $\theta _{{b}} = \arctan ({G_z}/{G_y})$
. We obtain globally a good correlation within the full range of investigated attitudes, indicating that
 $\theta _{{R}} \approx \theta _{{b}}$
. These results confirm the base pressure gradient as a good topological indicator of the three-dimensional recirculating flow even with varying body attitude, providing the orientation of the reversed flow or equivalently, the tilt orientation of the recirculation torus. The correlation of the modulus are discussable in figure 12(
 $b$
), while the experiment seems to indicate that large reversed cross-flow velocity is associated with large base pressure gradient, the LES does not show any tendency.
Relationship between the base pressure gradient and the reversed flow obtained from the experimental (filled black circle) and the LES (red stars) datasets: (
 $a$
) orientation of the cross-flow component of the reversed flow
 $\theta _{{R}}$
(see text) vs. the base pressure gradient orientation
 $\theta _{{b}}$
; (
 $b$
) modulus of the cross-flow component of the reversed flow vs. the modulus of the base pressure gradient.

Figure 13 presents, in filled circle symbols, the variation of the reversed flow components with the change of the attitude in pitch and yaw. As the steady
 $z$
-instability mainly affects the vertical orientation of the wake, the vertical component of the reversed flow
 $\langle W^* \rangle _{{R}}$
(displayed with blue colour) is expected to be the relevant quantity to identify transitions. The non-trivial variation of
 $\langle W^* \rangle _{{R}}$
(filled blue circle) with change of pitch attitude
 $\alpha$
at
 $\beta = 0^\circ$
in figure 13(
 $a$
) reveals the presence of the steady instability and the different selected states observed crossing successively regions V, I, II of figure 4. Similarly with yaw variations, we can identify the different wake states crossing (
 $i$
) regions I and III at
 $\alpha = 0^\circ$
in figure 13(
 $b$
), (
 $ii$
) regions V and III at
 $\alpha =-1.5^\circ$
in figure 13(
 $c$
) and (
 $iii$
) regions I, II, III at
 $\alpha =+1.5^\circ$
in figure 13(
 $d$
). The
 $\langle V^*\rangle _R$
component (red filled circles) that remains close to zero at
 $\beta = 0^\circ$
in figure 13(
 $a$
) has a general trend of increasing with yaw, except for region II in figure 13(
 $d$
), where a P
 $_z$
state is forced by the ground separation, as discussed in the previous section. Apart from region II in figure 13(
 $d$
), the
 $\langle U^*\rangle _R$
component (black filled circles) only shows a slight monotonous decrease with yaw or pitch.
Experimental velocity components of the mean reversed flow (see text)
 $\langle U^* \rangle _{{R}}$
,
 $\langle V^* \rangle _{{R}}$
and
 $\langle W^* \rangle _{{R}}$
: (
 $a$
) varying pitch attitude at
 $\beta =0^\circ$
; (b) varying yaw attitude at
 $\alpha =0^\circ$
; (c)
 $\alpha =-1.5^\circ$
and (d)
 $\alpha =+1.5^\circ$
. The filled circle symbols represent the data for the Ahmed body, and the empty circle symbols are data for the model with a rear cavity. A reminder of the transition diagram (figure 4) indicates the corresponding attitude variations at the centre of the figure.

These plots in figure 13 also contain some cases with a rear cavity known to suppress the steady instability (Evrard et al. Reference Evrard, Cadot, Herbert, Ricot, Vigneron and Délery2016; Lucas et al. Reference Lucas, Cadot, Herbert, Parpais and Délery2017), they are shown with the empty circle symbols. The effect of the rear cavity on the wake can be visualised in figure 14, showing the mean velocity fields in the
 $X^*=0.5$
plane for 9 attitudes. These velocity fields can be directly compared with those of figures 7(left), 8(left), 9(left) and 10(left) performed at identical attitudes with no rear cavity.
Experimental mean velocity field in the
 $X^*=0.5$
plane of the model with cavity at
 $\beta =0^\circ$
(left),
 $\beta =6^\circ$
(middle) and
 $\beta =12^\circ$
(right) for three pitch attitudes: (
 $a$
)
 $\alpha =-1.5^\circ$
; (
 $b$
)
 $\alpha =0^\circ$
; (
 $c$
)
 $\alpha =1.5^\circ$
. The windward side is on the right-hand side of the base (
 $Y^*\gt 0$
). See figure 7 for the colour scales of the velocity
 $U^*$
.

The suppression of the steady instability is very clear for
 $\beta =0^\circ$
, especially with the wind aligned attitude in figure 14(
 $b$
, left) where the cross-flow in the recirculating region fully preserves the base symmetries, in agreement with a non-tilted recirculating torus as reported by Lucas et al. (Reference Lucas, Cadot, Herbert, Parpais and Délery2017). When the pitch is slightly varied around this attitude, we find a quasi-linear relationship between the pitch angle and
 $\langle W^* \rangle _{{R}}$
, displayed with empty blue circle symbols in figure 13(
 $a$
). However, we can see that a large upwash wake (
 $\langle W^* \rangle _{{R}}\gt 0$
) is more likely to be produced with a negative pitch than a large downwash wake (
 $\langle W^* \rangle _{{R}}\lt 0$
) with a positive pitch, and we can reasonably attribute the difference between the two opposite pitches
 $\alpha =\pm 1.5^\circ$
of figure 14(
 $a$
, left) and figure 14(
 $c$
, left) to the ground. In the latter case having a large positive pitch, the recirculation bubble is simply constrained by the horizontal ground, with the impossibility to re-orientate with an increased positive pitch. We do not think that a significant ground separation occurs in figure 14(
 $c$
, left), but the appearance of a clear upwash wake at same pitch
 $\alpha =+1.5^\circ$
with the yaw
 $\beta =+6^\circ$
in figure 14(
 $c$
, middle) results from a ground separation as for the case with no cavity in figure 9(
 $c$
) at the same attitude. As a consequence, the reversed flow components are very similar at the attitude
 $(\beta =+6^\circ ,\alpha =+1.5^\circ )$
in figure 13(
 $d$
) whether there is a rear cavity or not. The same observation is made for the two other pitches
 $\alpha =0^\circ ,-1.5^\circ$
at
 $\beta =+6^\circ$
in figure 14(
 $a{,}b$
, middle) that look very similar to figure 9(
 $a{,}b$
)(left) and with reversed flow components very similar in figure 13(
 $b{,}c$
) whether there is a rear cavity or not. Actually, the main difference in the cross-flow fields comparing figure 9(left) and figure 14(middle), is the total absence of foci for the rear cavity. Together with the little difference in the reversed flow components we may conclude that the steady instability is already attenuated by yawing the body at
 $\beta =+6^\circ$
and that creating a rear cavity has reduced effect at this yaw.
At the largest yaw
 $\beta =+12^\circ$
, we find the flow with cavity (figure 14 right) to be rather similar to the flow without rear cavity (figure 9 left), confirming the finding of Fan et al. (Reference Fan, Parezanović and Cadot2022) that for these body attitudes there is no evidence for the steady instability in the wake anymore. In other words, the recirculating flow asymmetry of the Ahmed body at large yaw is a direct consequence of its attitude, and thus governed by the flow around the base separation. A last remark about the comparison of the recirculation cross-flow with and without the rear cavity is that, for a given body attitude, the external flow outside the recirculating region (region with yellow to red colours in all velocity fields) is almost identical whether a rear cavity is present or not, or whether the recirculation is subjected to the steady instability.
Characterisation of the four typical unsteady transitions identified in figure 4 with (left) time series of the vertical component of both the base pressure gradient and reversed flow, conditionally averaged velocity field in
 $y^*=0$
plane with
 $g_z\lt 0$
(middle) and
 $g_z\gt 0$
(right): (
 $a$
) transition I–II
 $_\alpha$
at
 $(\beta , \alpha )=(0^\circ , 2.3^\circ )$
; (
 $b$
) transition I–II
 $_\beta$
at
 $(\beta , \alpha )=(2.5^\circ , 1.25^\circ )$
; (
 $c$
) transition I–III at
 $(\beta , \alpha )=(1.5^\circ , 0.25^\circ )$
; (
 $d$
) transition I–V at
 $(\beta , \alpha )=(0^\circ , -0.15^\circ )$
. Same colour scale as in figure 7 for the velocity
 $U^*$
.

3.3. Recirculation dynamics for attitudes with wake fluctuation crisis
We now turn to the flow properties during the unsteady transitions triggered by the body attitudes located in the stripe enclosing region V in figure 4. For this purpose, synchronised acquisition of the base pressure distribution and PIV is performed for 4 attitudes chosen to be a local maximum of the fluctuation of
 $g_z$
in the attitude parametric space. These attitudes are marked with green stars in figure 4 and their flow properties are summarised in figure 15 and table 2.
In figure 15(left) we show time series of the vertical components of the base pressure gradient and the reversed flow. For all attitudes, the very good correlation between these two quantities is due to the recirculating flow that keeps a torus spatial structure during the dynamics, where the dynamics of its tilt orientation explains the correlation between
 $g_z$
and
 $\langle W \rangle _R$
. At each attitude, statistics are separated following the sign of
 $g_z$
to produce two conditional means, denoted with superscripts N and P whether the gradient is respectively negative or positive. Conditional velocity fields are shown in figure 15(middle, right), and their corresponding aerodynamics coefficients in table 2.
We can easily see in table 2 how the lift coefficient
 $C_z$
is impacted by the wake; all
 $C_z^{{P}}$
systematically have a lower value than
 $C_z^{{N}}$
. The difference is approximately 0.022–0.025 for the I–II
 $_\alpha$
, I–II
 $_\beta$
and I–III transitions and 0.045 for the I–V transition. For comparison, Bonnavion & Cadot (Reference Bonnavion and Cadot2018) obtained a difference of 0.04 for both transitions similar to I–III and I–V but their geometry has a boat tail.
As concluded in the previous section, all attitudes in region II are associated with ground separation. The transitional attitudes I–II
 $_\alpha$
and I–II
 $_\beta$
are respectively reported in figure 15(
 $a{,}b$
). The ground separation is equivalently visible for the two conditional mean velocity fields in figure 15(
 $a{,}b$
, right). There is thus no intermittent behaviour alternating between attached and detached flow on the ground to relate to the wake fluctuation. The fluctuation crisis at these attitudes is then rather a consequence of the steady instability with a compensation effect where the wake downwash produced by the positive pitch is cancelled by the upwash of the ground separation, leading to a lack of state selection. The attitude I–II
 $_\alpha$
presents different base suctions whether it is an N or a P state, in accordance to the drag coefficients. It is found that the P state presents a smaller base suction by 2 % and drag by 1 % than the N state in table 2. It is worth mentioning that, for this large positive pitch, the lift coefficient reported in table 2 is positive for both states.
The two next transitional attitudes, denoted I–III and I–V are not associated with ground separation, which can indeed be checked in both velocity fields in figure 15(
 $c{,}d$
), respectively. There is no significant difference in either the base suction or the drag coefficient at the attitude in yaws I–III in table 2, but we can observe a difference by 3 % of base suction and 2.3 % of drag at the attitudes I–V. It is found that the N state has a lower base suction and drag that the P state, as in Bonnavion & Cadot (Reference Bonnavion and Cadot2018) and Fan et al. (Reference Fan, Parezanović and Cadot2022). It is the opposite tendency of the I–II
 $_\alpha$
attitudes where the N state has more drag, as commented above, but the lift coefficient is now negative for both states. It appears that the cases behave oppositely between I–II
 $_\alpha$
and I–V because their lift coefficients are opposite.
4. Discussion
4.1. Mean separation closure and recirculating flow structure
The near wake shown in figure 6(
 $a$
) features two longitudinal vortices (
 $V^+$
and
 $V^-$
) at the mean separation closure. This mean structure is similar to some steady separated flow closures proposed by Délery (Reference Délery2013) that are topologically admissible, such as the sketch in figure 16(
 $a$
). In this scenario, the separated flow surface (represented with red colour in figure 16
 $a$
) rolls up into two longitudinal vortices forming a three-dimensional closure of the separated bubble, similarly to the mean flow structure of figure 6(
 $a$
). It is remarkable that these vortices cannot be simply related to the circulation created around the body as for the classical tip vortices of lifting surfaces (see the lifting line theory, as for instance in Batchelor (Reference Batchelor2002)). At the attitude of figure 6(
 $a$
), the lift coefficient reported in table 1 is negative, which would imply, in the framework of the lifting line theory, a pair of longitudinal vortices of opposite rotations to what is observed for
 $V^+$
and
 $V^-$
. It is likely that the circulation of these vortices is produced by the wake itself as a consequence of the steady instability and more specifically by the recirculating flow asymmetry. This typical asymmetry, observed in figure 7(
 $b$
) for the N
 $_z$
state, is sketched in figure 16(
 $b$
) with the blue streamlines projected on the symmetry plane,
 $y=0^*$
. The three-dimensional flow surface separated from the rectangular base edge is shown with red colour, as in figure 16(
 $b$
). The separated surface closes downstream, forming two longitudinal vortices with rotations consistent with the observation of figure 6(
 $a$
). The recirculating flow asymmetry should then produce a positive circulation
 $\varGamma$
, which is indeed checked by computing the circulation on the separatrix contour
 $\mathscr{C}$
(the dividing streamlines leaving the body at the base and reattaching in the flow as defined in Roshko (Reference Roshko1993) and Balachandar, Mittal & Najjar (Reference Balachandar, Mittal and Najjar1997)). The circulation on this contour is found to be
 $\varGamma ^*=0.365$
in the LES and 0.372 in the experiment for the N
 $_z$
state at the wind aligned attitude. It is worth mentioning that the circulation of each longitudinal vortex (measured for the LES data at
 $x^*=1.5$
by surface integration of the longitudinal vorticity) is 0.149 for
 $V^+$
and –0.154 for
 $V^-$
, meaning that approximately 60 % of the initial circulation
 $\varGamma ^*$
has been dissipated into incoherent motions by turbulence during the roll-up. To complete the discussion about the circulation produced by the recirculating flow asymmetry, we detail next the equilibrium properties of the mean dividing streamline contour
 $\mathscr{C}$
first introduced by Sychev (Reference Sychev1982) and then studied by Roshko (Reference Roshko1993) and Balachandar et al. (Reference Balachandar, Mittal and Najjar1997) for two-dimensional bluff bodies. As by definition there is no mean momentum flux through the separatrix, the momentum budget provides in the vertical direction
(
 $a$
) Topologically admissible separation surface from Délery (Reference Délery2013). (
 $b$
) Three-dimensional sketch attempt of the N
 $_z$
state at the
 $\beta =\alpha =0^\circ$
attitude measured in figure 7 featuring the recirculating torus displayed with a thick grey line. Blue streamlines show the reversed flow in the plane
 $y^*=0$
. The base pressure gradient
 $\boldsymbol{g}$
is also referring to plane
 $y^*=0$
. The separated bubble is closed with a pair of vortices (
 $V^+,V^-$
), as in (
 $a$
) with circulations originating from the circulation
 $\varGamma$
of the asymmetric recirculating flow.

 \begin{equation} -\oint _\mathscr{C} C_p {\textrm d}x^* - \oint _\mathscr{C} 2\overline {w'^{*2}} {\textrm d}x^*- \oint _\mathscr{C} 2\overline {u'^*w'^*} {\textrm d}z^* = 0, \end{equation}
where the viscous stress contribution has been neglected due to the large Reynolds number of the flow. The terms of (4.1) are, from left to right, the net force coefficient on the contour
 $\mathscr{C}$
of pressure
 $C_{f_p}=-\oint _{\mathscr{C}} C_p {\textrm d}x^*$
, Reynolds normal stress
 $C_{f_{\tau _{zz}}}=-\oint _{\mathscr{C}} 2\overline {w'^{*2}}{\textrm d}x^*$
and Reynolds shear stress
 $C_{f_{\tau _{xz}}}=-\oint _{\mathscr{C}} 2\overline {u'^*w'^*} {\textrm d}z^*$
. The pressure and fluctuating velocity correlations are shown in figure 17(
 $a{-}c$
) and their corresponding integrant in figure 17(
 $d$
). It can be seen that, since
 $-\oint _{\mathscr{C}} 2\overline {u'^*w'^*} {\textrm d}z^*\approx 0$
, the equilibrium is exclusively realised through the two normal stresses including a negative pressure force (
 $C_{f_p}\lt 0$
) and a positive normal Reynolds stress (
 $C_{f_{\tau _{zz}}}\gt 0$
). It is clear that the positive circulation
 $\varGamma$
of the contour
 $\mathscr{C}$
discussed above, that would have produced a positive pressure force in a potential flow framework making use of the Kutta theorem, has no relation to the mean pressure force exerted on the contour
 $\mathscr{C}$
of the real mean recirculating flow including large turbulent fluctuations.
Terms contributing to the momentum bubble equilibrium in the vertical
 $z$
-direction in (4.1) obtained for the wind aligned attitude (
 $\beta =\alpha =0^\circ$
) of the LES with (
 $a$
) pressure, (
 $b$
) Reynolds normal stress and (
 $c$
) Reynolds shear stress, where the factor
 $-\rho$
has been omitted. (
 $d$
) The three integrants of (4.1) along the closed path
 $\mathscr{C}$
extracted from values at the white line shown in (
 $a,b,c$
).

We would like to mention that a steady separated flow closure with two vortices is a common feature of ventilated supercavities (Cox & Layden Reference Cox and Layden1957; Franc & Michel Reference Franc and Michel2005) where gas is injected at the rear of the body in a uniform liquid flow. At low Froude number, a steady gas bubble attached at the rear of the body closes with two hollow vortices evacuating the injected gas. On the contrary to the present case, the steady flow around the cavity can be described using a potential flow theory, such that the buoyancy force of the gas cavity is balanced by the pressure force resulting from a circulation in the liquid flow induced by gravity.
One may eventually wonder how the topology of the mean flow emerges from the time-averaged dynamics. For example, the portion of the recirculating torus located near the base exhibits the most steady properties and likely resembles the mean flow, except in cases of a bistable dynamics, as discussed by Pavia, Passmore & Sardu (Reference Pavia, Passmore and Sardu2018)). In contrast, the opposite side of the torus shows significant deviations from the mean due to high Reynolds shear stress (see figure 17
 $a{,}b{,}c$
). This high-stress region is associated with the growth of the turbulent mixing layer and the shedding of vortex loops. It is also where the pair of counter-rotating longitudinal vortices forms (see the top and middle rows in figure 6
 $a$
, which correspond to figure 17
 $a{,}b{,}c$
). These longitudinal vortices arise from the tilting process of the vorticity, initially oriented perpendicular to the main flow near the base. This tilting process likely occurs unsteadily within the high Reynolds stress region during vortex loop shedding events, as observed in the LES by Lucas et al. (Reference Lucas, Cadot, Herbert, Parpais and Délery2017) and Dalla Longa et al. (Reference Dalla Longa, Evstafyeva and Morgans2019). In such a scenario, the mean counter-rotating longitudinal vortices would represent the time-averaged trace of the two roots of each shed vortex loop, which accumulate constructively over time.
4.2. Recirculation effect on the body aerodynamics at different attitudes
It is found that the recirculation structure sketched in figure 16(
 $b$
) seems globally preserved and rotates around an axis perpendicular to the base when the attitude is changed. This is quantitatively suggested by the base pressure gradient and the reversed flow, which remains almost entirely within the same plane (hereafter referred to as the w-plane) as indicated by
 $\theta _b \approx \theta _R$
in figure 12(
 $a$
) for all attitudes. The pitch can induce a
 $\pi$
rotation of the w-plane, as observed between figures 6(
 $a$
) and 6(
 $b$
). The yaw can induce a
 $\pi /2$
rotation of the w-plane, as observed in figures 6(
 $a{,}b$
) and 6(
 $c$
). In addition, the separation on the ground observed for sufficiently large positive pitch, (region II in figure 4) can also reorientate the recirculation structure into a P
 $_z$
state similar to figure 6(
 $b$
).
Figure 18 shows LES results for a body attitude where
 $\theta _B=42^\circ$
and
 $\theta _R=45^\circ$
. Both axes defining the w-plane,
 $z^*_w$
and
 $y^*_w$
, have been rotated by
 $\theta _B$
. The pressure coefficient distribution exhibits reasonable symmetry with respect to the
 $y^*_w$
direction in figure 18(
 $a$
). In the far wake, the white dashed line passing through the centres of the two longitudinal vortices in figure 18(
 $b$
) is not perpendicular to the
 $y^*_w$
direction, indicating a twist deformation of the structure compared with what is shown in figure 16(
 $b$
). We can see very different symmetry properties, especially close to the base due to the presence of the tilted torus between the w-plane streamlines in figure 18(
 $c$
) and those of the perpendicular plane in figure 18(
 $d$
). Further downstream, the symmetry observed close to the base in figure 18(
 $d$
) is lost, as expected by the twist deformation identified in figure 18(
 $b$
). The fact that the structure in figure 16(
 $b$
) is not strictly preserved under rotation with body attitude variation can be understood by considering the external flow variation around the separation. For instance, the cross-flow on the windward side may force the two longitudinal vortex centres to lie in a vertical plane. Similar rotations of the mean structure illustrated in figure 16(
 $b$
) have been observed in the case of axisymmetric bodies, initially reported as a planar symmetry by Mittal (Reference Mittal1999), and later studied through base pressure distributions in Rigas et al. (Reference Rigas, Oxlade, Morgans and Morrison2014) and Zhu, Rigas & Morrison (Reference Zhu, Rigas and Morrison2025), and velocity fields in Grandemange, Gohlke & Cadot (Reference Grandemange, Gohlke and Cadot2014) and Gentile et al. (Reference Gentile, Schrijer, Van Oudheusden and Scarano2016, Reference Gentile, Van Oudheusden, Schrijer and Scarano2017). In most of these studies, the body attitude never exceeded
 $1^\circ$
. For rectangular bases and larger body attitudes, it is likely that a similar structural dynamics persists, indicating a universal property of three-dimensional body wakes.
The LES results at body attitude
 $\beta =6^\circ , \alpha =-1.5^\circ$
. Panels show (
 $a$
)
 $C_p$
distribution at the base; (
 $b$
) longitudinal vorticity in the plane
 $x_B^*=2$
; (
 $c$
) flow field and
 $C_p$
in the w-plane; (
 $d$
) flow field and
 $C_p$
in the plane perpendicular to the w-plane. In these plots, the coordinate system (
 $x_B^*, y_B^*,z_B^*$
) is attached to the base, meaning that the direction
 $x_B^*$
is perpendicular to the base and that directions
 $y_B^*, z_B^*$
are parallel to the base.

Regarding the consequence for body aerodynamics, the recirculating flow structure is always observed to take the shape of a tilted torus influencing the pressure gradient at the base, as can be seen in figure 17(
 $a$
). This justifies the presence of a negative base pressure gradient at
 $x^*=0$
around
 $z^*=0$
. This base pressure gradient affects the pressure of the rear lateral sides of the body. In the case presented in figure 17(
 $a$
), the tilted torus reduces the pressure at the top rear side and increases the pressure at the bottom rear side, thus creating an additional positive lift on the body. Due to its rotation with the attitude, as shown in figure 18(
 $c$
), the recirculation flow structure can affect both lift and side force components.
When the body attitude is set at values corresponding to large wake fluctuations, experiencing positive and negative vertical base pressure gradient components (i.e. any attitudes in the magenta stripe in figure 4), the tilted torus orientation and the base pressure gradient are instantaneously correlated, as shown in figure 15. It is found that, only for transition types I–II
 $_\alpha$
and I–V (see table 2) does the base suction (or drag) show significant differences when the base pressure gradient is positive or negative. Interestingly, the correlation between the gradient orientation and drag (or base suction) is opposite for the two transitions. While the N state has larger drag and base suction at the I–II
 $_\alpha$
transition, it has lower drag and base suction at the I–V transition. However, for both cases, the state with minimum drag is characterised by minimum lift in absolute value. It is likely that the recirculation effect on the body side forces, as discussed in the previous paragraph, modifies the drag through an induced drag mechanism, where a weaker cross-flow force determines a lower drag.
4.3. Steady instability and body attitude
Based on a comparison of force coefficients with and without the rear cavity, Fan et al. (Reference Fan, Parezanović and Cadot2022) concluded that the region in attitude space where the steady instability is present encompasses regions I, V, II and partially region III at small yaw angles, as shown in figure 4. This conclusion is supported by the flow field investigation with the rear cavity, presented in figure 14. The observed similarity in the cross-flows within the recirculating region, with and without the cavity, at
 $12^\circ$
yaw supports the absence of the steady instability in these cases. Here, the asymmetry of the inner separated flow is directly caused by the body attitude and is therefore governed by the flow around the base separation, which appears unaffected by the presence of a rear cavity. In contrast, the
 $6^\circ$
yaw cases show differences in cross-flows that suggest an attenuation of the steady instability in region III. Meanwhile, the
 $0^\circ$
yaw cases confirm the suppression of the steady instability, as indicated by the absence of the tilted torus.
4.4. Ground effect on the wake
It was shown that a ground flow separation is observed with large pitch attitudes (see for instance figure 8
 $b{,}c$
, figure 9
 $c$
and figure 15
 $a{,}b$
). The adverse pressure gradient at the wall, responsible for the boundary layer separation, is easily identified in figure 17(
 $a$
). The star symbol at approximately
 $x^*=0.5$
locates the lowest pressure at the ground level, after which the pressure rises abruptly downstream until
 $x^*=1.2$
. This region of positive pressure gradient has the potential to produce a flow separation, provided that the gradient is sufficiently large and/or the boundary layer momentum sufficiently small. A clear reduction of the velocity near the ground and
 $x^*=0$
can be seen in figure 8, by pitching up the body from
 $\alpha =-1.5^\circ$
in figure 8(
 $a$
) to
 $\alpha =2.6^\circ$
in figure 8(
 $c$
). In addition to larger momentum deficit of the boundary layer, the recirculation region gets closer to the ground, thus increasing the adverse pressure gradient strength. Ground separation is then unavoidable at large positive pitch attitudes. Yawing the body at a given pitch can also trigger the ground separation, as observed between regions I and II (transition I–II
 $_\beta$
). The wide ground separation presented in figure 9(
 $c$
) is produced by applying a yaw
 $\beta =6^\circ$
to the body in figure 8(
 $b$
). This is a consequence of the base suction increase with yaw, a well-known property of Ahmed bodies that is confirmed in Fan et al. (Reference Fan, Parezanović and Cadot2022) for this geometry, where the base suction approximately doubles in the range
 $\beta =[0^\circ , 15^\circ ]$
. A larger base suction implies a lower pressure in the recirculating region, therefore, a larger adverse pressure gradient on the ground. A yaw increase is susceptible to triggering ground separation, which is likely to happen for transitions I–II
 $_\beta$
. However, this effect can be counterbalanced by a momentum increase in the boundary layer due to the windward inflow as yaw is increased. This is what possibly explains the reason why the ground separation at
 $+6^\circ$
yaw in figure 9(
 $c$
) becomes hardly noticeable at
 $+12^\circ$
yaw in figure 10(
 $c$
), with a constant pitch of
 $\alpha =1.5^\circ$
. This yaw effect is better quantified with the LES visualisation of the time-averaged wall shear stress on the ground in figure 19. A ground separation is clearly identifiable for the three different yaws, and the intermediate
 $+6^\circ$
yaw shows the widest separation.
The time-averaged wall shear stress on the ground coloured by the streamwise shear stress
 $\tau _{x}^* = ({1}/{\textit{Re}}) ({{\textrm d}U^*}/{{\textrm d}z^*})|_{z^*=0}$
from LES for body attitudes
 $\beta =0^\circ$
(
 $a$
),
 $\beta =6^\circ$
(
 $b$
),
 $\beta =12^\circ$
(
 $c$
) and
 $\alpha =1.5^\circ$
. The red line represents the iso-value
 $\tau _{x}^* =0$
and surrounds a region of reverse flow, where
 $\tau _{x}^* \lt 0$
. In (
 $b$
) and (
 $c$
), the windward side is on the right-hand side of the base. The black point in each thumbnail is used as a visual aid to locate the body attitude from the transition diagram of figure 4.

The ground separation might impact studies with automotive application. The realistic boundary condition for vehicles is a moving ground with the same speed as the uniform wind with thus no boundary layer at the wall. The absence of a boundary layer on the ground makes flow separation unlikely. It is speculated that region II in the diagram of figure 4 would become obsolete with realistic road conditions and that all unsteady transitions of type I–II would not exist. We performed a final calculation as a preliminary check of the attitude shown in figure 19(
 $b$
). As illustrated in figure 20, applying the moving-ground boundary condition effectively suppresses the ground separation and the P
 $_z$
state of the wake. It produces instead a pattern similar to that observed in region III as in figure 9(
 $a{,}b$
) where no separation is observable on the static ground.


5. Conclusion
This work explored the mean flow structure of the recirculating region at the rear of a rectangular vertical base body under varying pitch and yaw attitudes. Both experiments and numerical simulations were conducted on the same body geometry for complementary purposes: the experiments allowed for efficient exploration across the attitude space but provided only partial velocity field data, while the simulations offered full spatial flow information, although limited to a smaller set of body attitudes.
The ten simulations at different pitch and yaw combinations satisfactorily reproduced all variations observed in the experiments, including base pressure, aerodynamic forces, wake orientation and ground separation. The aerodynamic coefficients also showed good agreement with the experimental data, with base suction predicted most accurately and lift coefficient predictions showing the greatest deviation.
Regardless of attitude, the mean recirculating flow structure consistently took the form of a tilted vortex ring, reproducing a base pressure gradient in the direction of the tilt. The base pressure gradient, evaluated with only four measurements, is therefore confirmed to be a good indicator of the recirculating flow structure. The vertical tilt of the vortex ring is linked to the steady instability mode, which is selected either by the body’s attitude or by ground separation. In the latter case, a vertical tilt persists even at large yaw angles. When ground separation is minimal or absent, the vortex tilt shifts to a horizontal orientation under yaw.
The findings of Fan et al. (Reference Fan, Parezanović and Cadot2022) regarding the region of the attitude space where the steady instability is responsible for the inner flow asymmetry are also confirmed by the present study.
The mean topology of the recirculating flow’s closure has been clarified. It consists of a pair of longitudinal vortices formed by the roll-up of the separation surface that bounds the recirculating region. These vortices are directly linked to the circulation associated with the flow asymmetry. Together, the vortex pair and the tilted ring provide a complete view of the spatial structure of the mean flow separation at the rectangular base. Although deformed by the external flow as the body attitude changes, this structure remains generally consistent and globally rotates around the axis perpendicular to the base.
The study also highlighted the dominant role of the ground boundary layer. Since the recirculating region is a low-pressure region, the ground boundary layer beneath the separation closure is subjected to an adverse pressure gradient, leading to an upwash that may promote the selection of a steady asymmetric mode associated with a positive vertical base pressure gradient. A natural extension of this work is to explore the attitude space using a moving ground, this task will be carried out exclusively through LES. This will help determine which bistable transitions persist in pitch and yaw under realistic ground conditions for ground vehicles.
Acknowledgements
The authors would like to thank J. Taramasco for his careful reading of the manuscript. The experimental set-up benefited from the invaluable contributions of both the mechanical and electrical workshops of the University of Liverpool. The computations were enabled by resources provided by the National Academic Infrastructure for Supercomputing in Sweden (NAISS), partially funded by the Swedish Research Council through grant agreement no. 2022-06725.
Funding
Y.F. wishes to thank the China Scholarship Council (CSC No. 202006260028) for the doctoral financial support. This work was supported by the National Natural Science Foundation of China (No. 52372360), National Key R
 $\&$
D Program of China (No. 2022YFE0208000) and Shanghai Key Lab of Vehicle Aerodynamics and Vehicle Thermal Management Systems (No. 23DZ2229029). This work has been supported by the Khalifa University of Science and Technology under Award No. RIG-2023-024.
Declaration of interests
The authors report no conflict of interest.
Appendix. Computational mesh and validation
This appendix shows the details of the mesh used in this study. Three unstructured hexahedral-dominant meshes were constructed using helyxHexMesh in ELEMENTS to evaluate mesh sensitivity. For the Ahmed model at
 $(\beta = 0^\circ , \alpha =0^\circ )$
, the coarse, medium and fine meshes consisted of approximately 32.43, 59.89 and 88.50 million cells, respectively. Figure 21 displays the details of the medium mesh at both horizontal and vertical planes. The near-wall prism layers are highlighted in the zoomed views of the front and rear sections of figure 21(
 $c$
). To fully resolve the boundary layer on the no-slip wall, the first cell in the wall-normal direction of the prism layers is placed at
 $y^+\lt 1$
. Here,
 $y^+ = nu_\tau /v$
is the dimensionless wall distance, where,
 $n$
is the distance of the first cell height from the wall and
 $u_\tau$
is the friction velocity. For WRLES, grid spacing values of
 $\Delta s^+ = \Delta s u_\tau /v = 50-130$
,
 $\Delta l^+ = \Delta l u_\tau /v = 15-30$
,
 $n_y=10-30$
are recommended (Choi & Moin Reference Choi and Moin2012). Here,
 $\Delta s$
and
 $\Delta l$
are the grid spacings in the streamwise and spanwise directions, respectively, and
 $n_y$
is the number of grid points stretched in the wall-normal direction for prism-layer cells. Table 3 shows the mean grid spacing in the wall-normal, the streamwise and lateral directions for three sets of meshes. The mesh was refined by increasing the global cell count while maintaining the time-averaged
 $y^+$
of approximately 0.4 and a constant prism-layer count (
 $n_y=25$
). Figure 22 shows that the time-averaged
 $y^+$
remains below unity in almost all regions, except at the front corner regions, where the maximum values are still limited to
 ${y^+}=2$
. The medium and fine meshes are well below the recommended limits for
 $\Delta s^+$
and
 $\Delta l^+$
, except for a slight exceedance of
 $\Delta l^+$
in the medium mesh. In contrast, the coarse mesh exceeds both thresholds. In this work,
 $\Delta s^+$
is equal to
 $\Delta l^+$
i.e. the cells are isotropic in the streamwise and spanwise directions.
Medium mesh details: (
 $a$
) the horizontal plane at
 $z^*=0.6$
; (
 $b$
) the vertical plane at
 $y^*=0$
; and (
 $c$
) a zoomed view of the prism layer.

The time-averaged
 $y^+$
in the model.

Mesh sensitivity was evaluated using time-averaged drag coefficient
 $C_x$
, base suction coefficient
 $C_b$
and recirculation region length
 $L_r^*$
, as shown in table 3. Differences in these metrics between the fine and medium meshes are all within
 $1.0\,\%$
, which are much smaller than those between the coarse and medium meshes. Thus, the medium mesh is employed in the work for 10 body attitudes, see detailed comparison between the experiment and computation in § 2.3.
Mesh sensitivity study – time-averaged flow metrics.


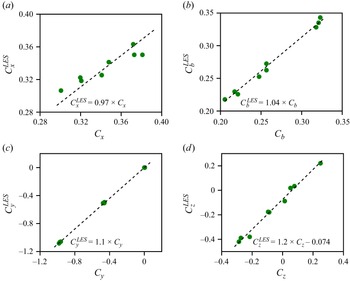


 Open access

