Introduction
Background
Pediatric fractures represent a significant portion of emergency department admissions, and distal forearm fractures account for 18% of all pediatric fractures. Reference Naranje, Erali, Warner, Sawyer and Kelly1 A significant portion of these fractures are diagnosed as torus and greenstick fractures. Reference Patel, Statuta and Ahmed2 These fractures are peculiar to children and usually occur after a simple mechanism of injury, such as falling on an outstretched hand. Since majority of the patients may be properly discharged with a wrist splint, rapid distinction between fracture types could potentially save time and resources. Bedside point-of-care ultrasound (POCUS) is used as a part of diagnostic algorithms to detect or rule out pediatric fractures because it is fast, accurate, non-invasive, low cost, and does not emit ionizing radiation. Reference Douma-den Hamer, Blanker and Edens3 Bedside POCUS may be used as an auxiliary diagnostic tool to detect the presence and type of fracture, and for conservative treatment of patients with no or only torus fractures, similar to soft tissue injuries. Reference Snelling4,Reference Handoll, Elliott, Iheozor-Ejiofor, Hunter and Karantana5
Importance
Handheld ultrasonography (USG) devices (HHU) have started to take place in clinical practice due to their portability and significantly lower purchasing cost when compared to conventional bedside USG devices. Since HHU devices cost for a small portion of conventional ultrasound systems, they have been developed by many companies and contribute to make bedside ultrasound evaluation available to all physicians. Furthermore, these devices also offer a low-cost solution in the under-graduate and graduate medical education ultrasound curriculum. Reference Baribeau, Sharkey and Chaudhary6–Reference Dinh, Fu, Lu, Chiem, Fox and Blaivas8 It has proven that these devices may be applicable during physical examination and provide a broader and more accurate assessment when used by medical students during their internship and residency periods. Reference Andersen, Viset, Mjølstad, Salvesen, Dalen and Haugen9,Reference Ojeda, Colbert and Lin10
A strong correlation has been shown between images of HHU devices and conventional devices in the studies performed for POCUS practices. Reference Bennett, De Vita and Mezzasalma11,Reference Chetioui, Masia and Claret12 The use of HHU has also been defined for basic POCUS practices in pediatric emergency medicine, and it was observed that it is less frightening and better tolerated by children due to the small size of the devices and the familiarity of children with smartphones. Reference Thavanathan, Woo and Hall13
There are limited number of studies about use of HHU devices for diagnosis and management of the fractures. It was found in a previous study investigating the diagnostic accuracy of HHU in proximal femur fractures or acute hip arthritis that HHU and radiography have comparable diagnostic accuracy. Reference Akimoto, Kobayashi, Maita, Osawa and Kato14 The use of these devices for identification and management of pediatric fractures have not been completely assessed.
Goals of this Investigation
The aim of this study was to investigate the efficiency of HHU devices for detection of simulated pediatric bone fractures sonographically by Emergency Medicine residents. The primary objective of this study is to evaluate the accuracy and performance of HHU for diagnosis of pediatric fractures. Furthermore, the evaluation of the use of HHU in the training and education of Emergency Medicine residents in the simulation model created is another aim of this study.
Methods
Study Design
This observational simulation study (Ethics approval protocol number: 2022/10, approval date: 26.05.2022) was initiated after the approval of the University of Health Sciences Fatih Sultan Mehmet Education and Research Hospital Ethics Committee (Istanbul, Turkey).
Selection of Participants
Physician participants were Emergency Medicine residents at a one-year academic Emergency Medicine residency program at Fatih Sultan Mehmet Education and Research Hospital. All physicians were familiar with the use of ultrasound for other clinical applications, such as for the dynamic visualization of central line placement and the focused assessment with sonography for trauma examination. Written informed assent and consent were obtained from all participants. At the onset of training, all participants took an eight-question test that was developed by authors to assess baseline knowledge. After the pre-test, all (n = 26) participants underwent a two-hour didactic training course. Lectures were presented in slide show format using a program with numerous ultrasound videos, images, and other multimedia. The training program consisted of skeletal system USG and pediatric fracture models combined with practical training on each other and simulated fracture models. After the training, the pre-training test was re-administered as a post-test to evaluate the knowledge gained in the course. Participants (n = 26) who completed the post-test with 80% success were included in the study.
Settings
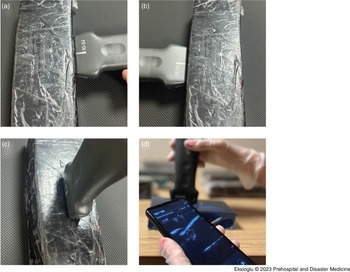
Model Construction—The simulation model which was previously developed by Snelling was used in this study. Reference Snelling15 Turkey bones, white vinegar, food-grade gelatin, and plastic cups were used to construct a basic pediatric fracture model. Turkey bones were cooked, the flesh of the bones was removed, and they were mechanically broken to form transverse, oblique, and fragmentary fracture models. The remaining bones were soaked in white vinegar for approximately two to four weeks. Axial force was applied to these bones, of which hydroxyapatite structures were dissolved and made more flexible, and a torus and green tree fracture model was created by bending them sideways and breaking from one side. Food-grade gelatin was dissolved in boiling water (10g per 100mL) and poured into containers, and food coloring was added to thicken the gelatin color. One-half of dried bones were soaked into the gelatin, which had cooled at room temperature and refrigerated for approximately four hours to completely harden. The solidified gelatin was then carefully taken from the container to allow screening from all directions (Figure 1).
(A)(B)(C) Ultrasound Probe Positioned on Bone Models for Accurate Imaging. (D) Ultrasound Image Showing an Oblique Fracture.

Model Evaluation—An HHU device, Sonosite İViz US (FUJIFILM Sonosite, Inc.; Bothell, Washington USA) that provides high-resolution, real-time ultrasound images was used in the study. The settings of the device were explained to all participants (n = 26). The participants tried to define the fracture models created in the ultrasound simulation model with the HHU device after device orientation (Figure 2). The information about the fracture model was not shared with the participants. The participants were asked to identify if there is a fracture, and the fracture type if a fracture was detected. The participants took clip images at each step during the review of simulation models and saved them to an external memory. The participants were asked to interpret the presence and the type of the fracture on the images. The order of fracture models was changed in each participant. The probe holding technique, the ability of the participants to obtain adequate images, appropriate gain and depth, correct positive/negative interpretations of the image, and the time to create and recognize the image were evaluated by the researchers and recorded.
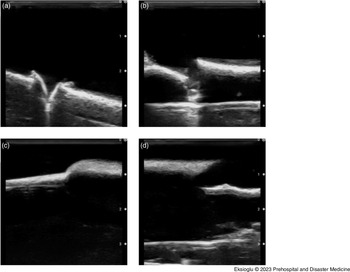
Ultrasound Images of Bone Models Depicting Different Fracture Types.
(A) Ultrasound Image Showing a Turkey Bone Greenstick Fracture, Presenting Irregularity in Bone Contour and Alignment. (B) Ultrasound Image Displaying an Oblique Fracture with a Diagonal Fracture Line Across the Bone. (C) Ultrasound Image Illustrating a Buckle Fracture with Outward Bulging Cortex, Presenting Cortical Bulging Indicating the Buckle Fracture. (D) Ultrasound Image Showcasing a Transverse Fracture with a Clear Disruption and Horizontal Fracture Line.

The following statement about the model being viewed as a teaching tool was presented to the residents: “This model will be a useful teaching tool for learning about ultrasound identification of pediatric forearm fractures.” There were five answer options: “Strongly Agree,” “Agree,” “Not Sure,” “Disagree,” or “Strongly Disagree.” The rate of each answer was detected.
Data Analysis
The conformity of the variables to the normal distribution was examined through the Shapiro-Wilk test. Continuous variables were expressed as mean (standard deviation [SD]), median (minimum: maximum) values, and categorical variables were expressed as n (%). The Identical Sample t-test was used when normal distribution was in question, and Wilcoxon Sign test was used when there was no normal distribution in comparisons between two dependent groups. The Fisher’s Exact test was used to compare categoric variables. The inter-rater agreement test was used to evaluate the inter-rater validity, and the kappa value was calculated. The SPSS (IBM Corp. Released 2017. IBM SPSS Statistics for Windows, Version 25.0; Armonk, New York USA) program was used for statistical analysis and any P value below .05 (P <.05) was considered statistically significant.
Results
Twenty-six (26) Emergency Medicine residents were included in the study. Each participant examined four different fractures and one normal bone structure in simulation models. Probe holding technique was evaluated correctly in all of the residents (100%) who participated in the study. Among the participants, 88.5% of the residents who had participated in the study were found sufficient to know the features of the HHU device and to adjust the appropriate gain and depth.
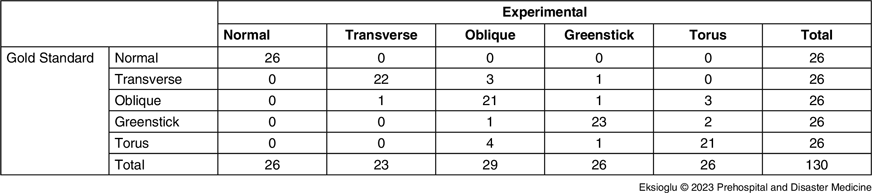
All participants (100%) recognized the normal bone model and the fracture, regardless from the fracture type. The sub-analyses of the fracture models revealed that the correct recognition rates of transverse and oblique fractures were 84% and 80%, respectively, and the correct recognition rates of greenstick and torus fractures were 88% and 80%, respectively. The consistency analysis between the practitioners revealed that the weighted kappa value was 0.707, and it was included in the substantial agreement category (Table 1).
Cohen’s Kappa for Interrater Reliability

Note: Inter rater agreement, weighted kappa = 0.707; P = .014.
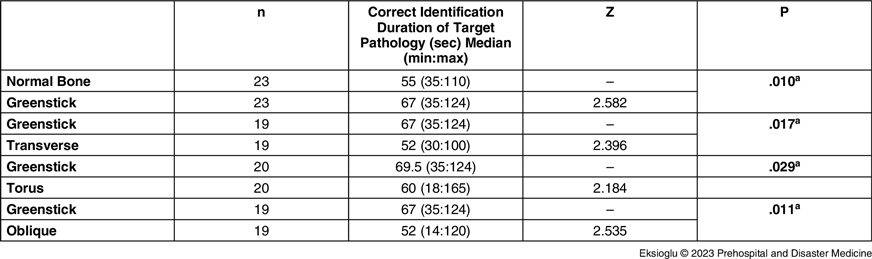
The mean duration to recognize the target pathology in the simulation models was 59.27 (SD = 18.59) seconds on the normal bone. The review of the fracture models revealed that the average of the correct diagnosis durations of transverse and oblique fractures was 53.64 (SD = 19.71) seconds and 55.14 (SD = 27.11) seconds, and the average recognition durations of the target pathology in greenstick and torus fractures were found 78.57 (SD = 30.45) seconds and 57.81 (SD = 29.59) seconds. The review on duration to identify the target pathology in fracture models revealed that the identification duration of greenstick fracture model was significantly longer (78.57 [SD = 30.45] seconds) than other models. The comparison of resident groups who had identified both models correctly revealed that the correct recognition time of the greenstick fracture was statistically significantly longer than the other groups (Table 2).
Comparison of Recognition Times in Resident Groups who have Identified Both Models Correctly

a Wilcoxon signed Rank test.
It was determined when the association between months of residency in the emergency department and the correct diagnosis of fracture models that there was no statistically significant association between the duration of residency and the correct diagnosis of fracture types (P >.05).
After sonographic review of the models, 24 of the 26 participants (92.3%) “Strongly Agreed” (65.4%) or “Agreed” (26.9%) that this model would be a useful teaching tool for learning to identify pediatric distal forearm fractures with ultrasound; however, 7.7% of the participants stated, “I’m Not Sure.”
Discussion
The findings of this study suggest that HHU may be useful in the diagnosis of pediatric forearm fractures and in USG training of Emergency Medicine residents. When the necessity of child volunteers in the evaluation of pediatric fractures is considered, it is not always easy to simulate these fractures in an educational setting. The ultrasound model that was created in this study was made of easily available, low-cost materials that facilitate the identification of different pediatric fracture types. Reference Snelling15,Reference Heiner and McArthur16 The absence of surrounding tissues such as muscle, fat, and fascia allowed sonographic examinations to focus on the bone component. The anatomical resemblance of turkey leg bones to the radius bones of two- and eight-year-old children makes them a suitable alternative for medical education, research, and training purposes. Reference Gindhart17
All participants in this study recognized the fracture in all models, regardless of type in the examinations. This study shows that Emergency Medicine residents can rule out pediatric bone fractures with HHU with a standard training. Previous studies have shown that ultrasound examinations performed by clinicians with two hours of standard training can be used to rule out long bone fractures. Reference Marshburn, Legome and Sargsyan18–Reference Snelling, Jones and Moore20 Weinberg, et al reported a sensitivity rate of 50% and a specificity rate of 95% for ulna fractures, and a sensitivity rate of 71% and a specificity rate of 85% for radius fractures in the USG examinations of the children with forearm fractures performed by emergency physicians who received one-hour USG training. Reference Weinberg, Tunik and Tsung21 Bedside HHU may have the potential to be a valuable aid in enhancing physical examination, particularly in pediatric injuries. It was detected when evaluation duration of the images by HHU is considered that intact bone was correctly identified in an average of one minute and optimal images were created in other bone models. The HHU may be useful in pediatric patients to rule out fractures in less than one minute and avoid unnecessary consultation and X-rays when combined with physical examination and history in a crowded emergency department setting.
It was found that it is easy to teach sonographic findings of pediatric fractures to Emergency Medicine residents with basic ultrasound experience in this simulation model adapted through HHU. Acquiring HHU skills was simple and easily accomplished during the trial period. The majority of participants agreed that the simulation model would be a useful teaching tool for learning about identification of pediatric fractures sonographically. Studies show that HHU devices show promising results in medicine and residency training. It was detected in a previous study that the use of these devices was found to be easy and valuable for improving 3D anatomy identification skills by first-year medical students. Reference Ireson, Warring and Medina-Inojosa22 Other studies have proven that physical examination may be extended in a feasible and accurate way when HHU is used during internship and residency in medical education. Reference Andersen, Viset, Mjølstad, Salvesen, Dalen and Haugen23,Reference Ojeda, Colbert and Lin24
When previous studies performed with standard POCUS devices in pediatric fractures were reviewed that USG was comparable to X-ray in terms of duration with a superior diagnostic value. Reference Katzer, Wasem, Eckert, Ackermann and Buchberger25–Reference Snelling, Jones, Keijzers, Bade, Herd and Ware27 Rowlands, et al showed in their study to detect whether forearm fractures could be excluded by USG in the children that pediatric emergency physicians were able to diagnose forearm fractures in children with a sensitivity of 91.5% and a specificity of 87.6% after a short training program. Reference Rowlands, Rippey, Tie and Flynn28 In another cross-sectional study examining the test performance characteristics of POCUS for non-angulated distal forearm injuries in children, the sensitivity of POCUS for distal forearm fractures was 94.7% (95% confidence interval [CI] = 89.7–99.8) and specificity 93.5% (95% CI = 88.6–98.5). Reference Poonai, Myslik and Joubert29 These studies evaluated the use of conventional car-based ultrasound technology in the evaluation of pediatric forearm fractures. The sensitivity of HHU was found 100% and the specificity was found between 90% and 95% in a study on the validity and reliability of a pocket-sized ultrasound in the diagnosis of distal radius fractures and evaluation of closed reduction quality. The inter-rater reliability between musculoskeletal radiologist and hand surgeon was reported as κ = 0.86 for diagnosis of the fracture and κ = 0.82 in determination of a satisfactory reduction in the study above. Reference Lau, Robertson, Motamedi and Lee30 The inter-rater reliability was found 70.7% for the diagnosis of fracture in Emergency Medicine residents with the same USG training and similar experience. Some fracture subtypes are misidentified on ultrasound despite good consensus. It is not always possible to determine the fracture subtype by ultrasonography in pediatric fractures. Reference Poonai, Myslik and Joubert29,31 However, it may be possible to avoid X-ray images in cases with an uncomplicated torus fracture or in whom no fracture is found on POCUS. In the present study, sonographic examinations were performed with HHU, and the participants were not experienced on the use of these hand-held devices. It can be predicted that these rates will increase with the wide-spread use of HHU in emergency medicine training.
Limitations
Each model represented either the radius or the ulna, rather than both being combined in gelatin. A limitation of the model used in this study is not simulating the radiolucent epiphysis on bone models; therefore, Salter-Harris fractures could not be represented.
Conclusions
Following a short two-hour training, Emergency Medicine residents were able to accurately identify normal bone structures and fractures, irrespective of fracture type. Notably, the duration of residency in the emergency department did not significantly affect the residents’ ability to achieve accurate results with HHU. The positive feedback received from the participants regarding the simulation model and HHU training further supports its utility as a valuable teaching tool for identifying pediatric distal forearm fractures with ultrasound. The simulation model, constructed from easily accessible and cost-effective materials, proved to be an effective aid in training Emergency Medicine residents in ultrasound-based fracture identification.
Conflicts of interest
There are no conflicts of interest to declare.