Worldwide, males are involved in about three times more car crashes than females (World Health Organization, 2002). Studies show that male drivers reported more traffic offenses and are involved in accidents related to these traffic offenses more than females (Simon & Corbett, Reference Simon and Corbett1996). Differences in traffic exposure between males and females are not enough to explain the differences between the sexes in accidentology. Risk-taking and traffic offenses better explain sex differences in traffic fatalities than the number of kilometers travelled (Waylen & McKenna, Reference Waylen and Mckenna2002).
Many psychologists indeed ascribe the male–female difference in risk-taking to sex stereotypes (Byrnes, Miller, & Schafer, Reference Byrnes, Miller and Schafer1999). Sex stereotypes refer to characteristics and traits which are associated with males and females within a given culture (Unger, Reference Unger1979). In France, as in other Western countries, masculinity is stereotypically associated with risk taking (Bem, Reference Bem1981; Gana, Reference Gana1995), and studies show that people conforming to masculine traits seem to have more risky practices than people conforming to feminine traits (Mahalik et al., Reference Mahalik, Locke, Ludlow, Diemer, Scott, Gottfried and Freitas2003). Indeed, research shows that masculine stereotype conformity has a greater effect than feminine stereotype conformity on self-reported risky behaviors in driving behaviors (Özkan & Lajunen, Reference Özkan and Lajunen2006), and in pedestrian behaviors (Granié, Reference Granié2009). Sex stereotypes seem to be more predictive of risky behavior than biological sex (Granié, Reference Granié2009). Indeed, a high level of masculinity is associated with a high level of offenses, aggressive violations and ordinary violations (Özkan & Lajunen, Reference Özkan and Lajunen2006), with a higher number of accidents and greater perceptual motor skills. A high level of femininity is associated with high safety skills, few accidents and offenses, lower aggressive violations and ordinary violations (Özkan & Lajunen, Reference Özkan and Lajunen2006). The association between masculinity and perceptual motor skills seem to suggest that “being a skillful driver” is seen as a masculine trait.
Since the dawn of the automobile era, driving has been perceived as a dirty, physical task, calling for masculine gender roles. In the same time females were stereotypically viewed as unable to manage stress when a quick decision is needed, as in driving activity (Berger, Reference Berger1986).
Some studies carried out in France show that adults and adolescents define female drivers as careful, compliant with traffic rules and having less severe traffic accidents than male drivers, although they are seen as unskilled drivers, having a lot of fender-bender accidents, and involved in an activity inconsistent with their social roles (Félonneau & Becker, Reference Félonneau and Becker2011; Granié & Papafava, Reference Granié and Papafava2011). In contrast, French adolescents define male drivers as skillful and involved in an activity consistent with their social roles, although careless and committing more offenses (Granié & Papafava, Reference Granié and Papafava2011). Degraeve, Granié, and Pravossoudovitch (Reference Degraeve, Granié and Pravossoudovitch2014) then confirmed these results on French adults from 16 to 85 years old. They showed that people perceive male drivers as skillful although impatient, reckless, uncivil, committing offenses and driving too fast, while they see female drivers as civic, careful, vigilant, and complying with traffic rules, although unskilled, dangerous, inattentive, and driving slowly. Four major dimensions differentiating male and female drivers arise from this study: driving skills, courtesy behind the wheel, compliance with traffic rules and risk avoidance in driving (Degraeve et al., Reference Degraeve, Granié and Pravossoudovitch2014).
These differentiated beliefs about the driving abilities of male and female have implications on male and female’s behaviors and may cause a stereotype threat effect on female drivers (Chateignier, Chekroun, Nugier, & Dutrévis, Reference Chateignier, Chekroun, Nugier and Dutrévis2011; Félonneau & Becker, Reference Félonneau and Becker2011; Yeung & von Hippel, Reference Yeung and von Hippel2008). Nevertheless, nothing is known about sex differences in the endorsement of the sex stereotypes associated with driving (SSAD).
The objective of the present study is therefore to explore the differences in endorsement of SSAD according to the driver’s sex and age. The hypothesis is that SSAD endorsement varies according to the participant’s sex and age in different ways depending on domains of the SSAD. Indeed Degraeve et al. (Reference Degraeve, Granié and Pravossoudovitch2014) showed that individuals promote their own sex group while they denigrate the out-group through the characteristics they associate with drivers of each sex group. Women, more than men, perceive male drivers as careless and female drivers as careful, while men, more than women, perceive female drivers as unskilled and male drivers as skilled. Furthermore, Granié and Papafava (Reference Granié and Papafava2011) showed that the male driver’s stereotype is stable from age eleven on, while the female driver’s stereotype appears to grow stronger with age.
Method
Materials
Measuring SSAD endorsement
To the best of our knowledge, no tool currently exists to measure SSAD endorsement. In order to explore sex and age differences, a questionnaire has been developed to measure the individual’s degree of endorsement of these stereotypes.
This questionnaire focuses on the four dimensions differentiating male and female drivers (Berger, Reference Berger1986; Chateignier et al., Reference Chateignier, Chekroun, Nugier and Dutrévis2011; Degraeve et al., Reference Degraeve, Granié and Pravossoudovitch2014; Félonneau & Becker, Reference Félonneau and Becker2011; Granié & Papafava, Reference Granié and Papafava2011): driving skills, courtesy behind the wheel, compliance with traffic rules and risk avoidance in driving (Degraeve et al., Reference Degraeve, Granié and Pravossoudovitch2014). The questionnaire was divided into two sections (male/female drivers). Based on the adjectives participants gave in the free association questionnaire used to describe male and female drivers in the study from Degraeve et al. (Reference Degraeve, Granié and Pravossoudovitch2014), 33 items in total were developed. These items were duplicated for male and female drivers and described characteristics of male/female drivers.
Several pre-tests were undertaken to improve comprehension of items among the targeted population. The purpose of these pre-tests was to determine whether the items that make up the experimental version of the questionnaire were clear, unambiguous and expressed in a language that is understood by the target population. Each section (male and female drivers) of the SSAD questionnaire was finally made up of 27 items on four dimensions of SSAD: 7 items concerning driving skills (e.g., “I think that males/females are skillful behind the wheel”), 7 items concerning compliance with traffic rules (e.g., “I think that males/females comply with speed limits”), 7 items concerning risk avoidance in driving (e.g., “I think that males/females avoid to adopt a risky driving”) and 6 items concerning courtesy behind the wheel (e.g., “I think that males/females are courteous drivers”). In each section, items were alternated among all the dimensions (compliance with traffic rules, driving skills, risk avoidance and courtesy). The order of the items was the same for both sections. As in the study from Chateignier et al. (Reference Chateignier, Chekroun, Nugier and Dutrévis2011), evaluations of male and female drivers were measured through the participants’ agreement with different statements on a seven-point scale (1 = “not agree at all”, to 7 = “strongly agree”).
Evaluations of male and female drivers
For each dimension, a score was calculated for male drivers and for female drivers by summing the scores of each item of the dimension. Finally 8 scores were obtained (4 scores concerning male drivers and 4 scores concerning female drivers). Scores ranged from 0 to 49 for the dimensions concerning driving skills, compliance with traffic rules, and risk avoidance (7 items in each dimension) and from 0 to 42 for the dimension concerning courtesy behind the wheel (6 items). The more the participants had a high score, the more they had a positive image of male or of female drivers on the corresponding dimension (males/females are skillful drivers, males/females are compliant with traffic rules, males/females avoid risk taking in driving, males/females are courteous drivers).
Stereotype endorsement
An index of stereotype endorsement was then calculated for each of the 4 dimensions of SSAD. As already used in a previous study on sex stereotypes in mathematics (Bonnot & Croizet, Reference Bonnot and Croizet2007), the index of stereotype endorsement was calculated for each of the 4 dimensions of SSAD, using the difference between participants’ evaluations of male and of female drivers. The endorsement index for each domain of SSAD corresponded to the rating of the sex group targeted by the stereotype after controlling for the rating of the other sex group Footnote 1 .
These evaluation indexes ranged from -49 to 49 for the dimensions concerning driving skills, compliance with traffic rules, and risk avoidance and from -42 to 42 for the dimension concerning courtesy behind the wheel. A score close to 0 meant that participant did not endorse the SSAD and evaluated male and female drivers similarly. The more the score was positive, the more the participant endorsed the stereotype (male driver as skilled, female drivers as courteous, risk avoider and compliant), the more the score was negative, the more the participant expressed a counterstereotyped belief (female drivers as skilled, male drivers as courteous, risk avoider and compliant).
Participants and procedure
In order to obtain the widest sample possible, we undertook a web-based collection using social networks. Only results from participants living in France were kept. The participants answered the questionnaire individually after giving their informed consent. The responses were anonymous, as the individuals were only identified by the day and time of completion of the questionnaire. The questionnaire was completed online by 291 licensed drivers (119 men and 172 women), from 18 to 64 years old. Their mean age was 36.36 years old (SD = 14.41). This questionnaire was presented to participants as a simple questionnaire concerning driving. The section on male drivers and the section on female drivers in the SSAD questionnaire were proposed in a counterbalanced order (i.e., 136 participants began with the section on male drivers and 155 began with the section on female drivers). In order to remain consistent with the age groups defined by the French Interministerial Observatory for Road Safety (French Interministerial Observatory for Road Safety, 2012) in the French traffic accident statistics, the participants were divided into three age groups: 18 to 24 years old (N = 94, 35 men and 59 women; M age = 21.95, SD = 1.59), 25 to 44 years old (N = 107, 44 men and 63 women; M age= 33.10, SD = 5.80) and 45 to 64 years old (N = 90, 40 men and 50 women; M age = 55.30, SD = 6.28).
Data analysis
Firstly, using Lisrel 8.8, confirmatory factor analysis (CFA) was conducted on each section of the SSAD questionnaire to insure the good factor structure of the questionnaire. Solutions were generated using maximum likelihood estimations. A model was considered as adequate if the comparative fit index (CFI) and the non-normed fit index (NNFI) were greater than or equal to .95, and if the root mean square residual (RMSEA) and the standardized root mean square residual (SRMR) were lower or equal to .08 (Hu & Bentler, Reference Hu and Bentler1999). Skewness and Kurtosis z-values were generated using SPSS 20.0 for each item of the questionnaire and the distribution was considered as normal if z-value was within -1.96 and +1.96 (Cramer & Howitt, Reference Cramer and Howitt2004).
Secondly, ANOVA and LSD post hoc were used to explore the effects of participants’ sex, participants’ age, and their interaction on participants’ evaluations of male and female drivers for each domain of SSAD.
Thirdly, ANOVA and LSD post hoc were used to explore the effects of participants’ sex, participants’ age, and their interaction on participants’ endorsement indexes for each domain of the SSAD.
Results
Analysis of the questionnaire structure
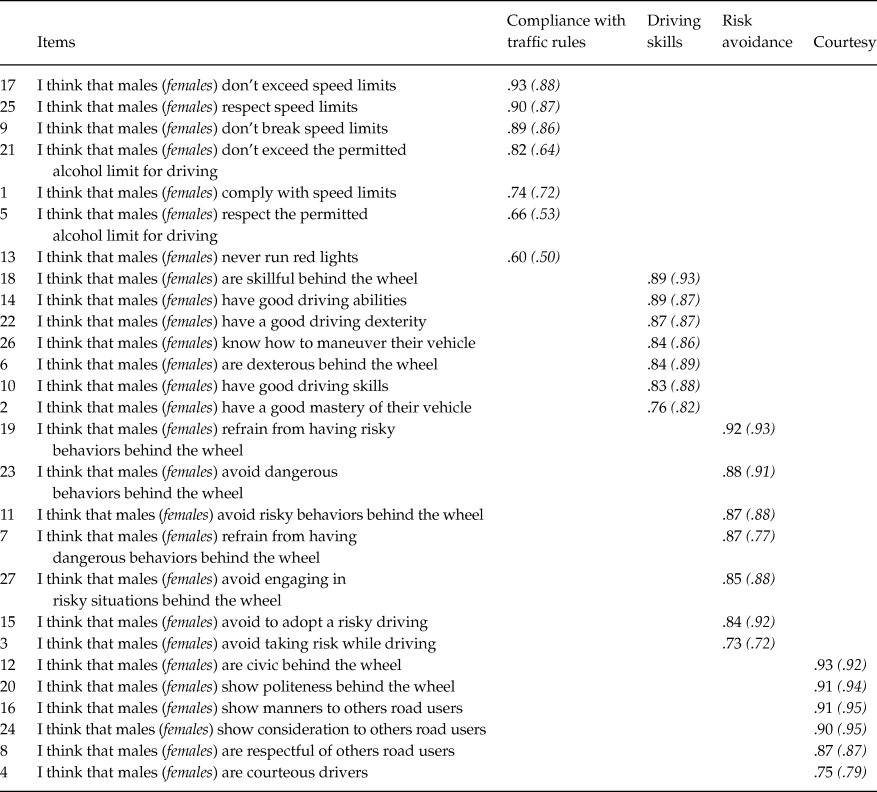
The results of the CFA conducted on the male-drivers section are presented in table 1. They support the hypothesized four-factor structure and all the standardized factor analysis loadings ranged from .60 to .93. Each fit statistic met the criteria for a good fitting model (Hu & Bentler, Reference Hu and Bentler1999): χ²/df = 2.08, p < .001, CFI = .99, NNFI = .98, SRMR = .04, RMSEA = .06, ECVI = 2.69, IFI = .99.
Confirmatory factor analysis of the male (and the female) drivers section

The results of the CFA conducted on the female-drivers section are presented in table 2. They support the hypothesized four-factor structure and all the standardized factor loadings ranged from .50 to .95. Each fit statistic met the criteria for a good fitting model (Hu & Bentler, Reference Hu and Bentler1999): χ²/df = 2.76, p < .001, CFI = .97, NNFI = .97, SRMR = .06, RMSEA = .08, ECVI = 3.43, IFI = .97.
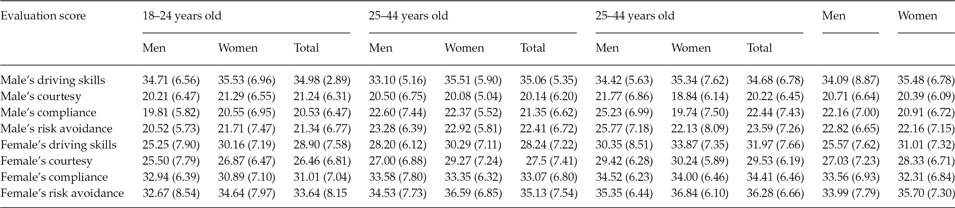
Means (and standard deviations) for each male and female drivers evaluation for each participant’s age and sex group

Results of the CFA supported the four-factor structure in each section of the questionnaire, so four endorsement indexes were computed: male’s driving skills (α = .93), female’s courtesy behind the wheel (α = .95), female’s compliance with traffic rules (α = .88) and female’s risk avoidance in driving (α = .94).
Evaluations of male drivers according to sex and age
ANOVA were carried out on the effects of participants’ sex (2) and age (3) for all the evaluations concerning male drivers: driving skills, courtesy behind the wheel, compliance with traffic rules and risk avoidance in driving. The means and standard deviations for each male driver’s evaluation for each participant’s age and sex group are presented in table 2.
ANOVA on the evaluation of male driver’s skills and male driver’s courtesy behind the wheel revealed no main effect of participants’ sex, participants’ age and participants’ age x sex interaction.
ANOVA on the evaluation of male drivers’ compliance with traffic rules revealed no main effect of participants’ age and participants’ sex, but a significant participants’ age x sex interaction (F(2, 285) = 4.50, p = .01, η p ² = .03). LSD post hoc analysis (p < .05) indicated that the men aged 45 to 64 evaluated male drivers as more compliant with traffic rules than the same-age women and the younger age-groups of both sexes did.
ANOVA on the evaluation of male driver’s risk avoidance revealed a significant main effect of participants’ age (F(2, 285) = 3.15, p < .05, η p ² = .02), but no participants’ sex or participants’ age x sex interaction. Post hoc analysis indicated that the 45–64 age-group evaluated male drivers as more risk avoiders than the 18–24 age-group did.
Evaluations of female drivers according to sex and age
ANOVAs were carried out on the effects of participants’ sex (2) and age (3) for all the evaluations concerning female drivers: driving skills, courtesy behind the wheel, compliance with traffic rules and risk avoidance in driving. The means and standard deviations for each female driver’s evaluation for each participant’s age and sex group are presented in table 2.
ANOVA on the evaluation of female driver’s skills revealed a significant main effect of participants’ sex (F(1, 285) = 17.76, p < .001, η p ² = .06), participants’ age (F(2, 285) = 7.74, p = .001, η p ² = .05), but no participants’ age x sex interaction. Post hoc analysis indicated that the women and the 45–64 age-group evaluated female drivers as more skillful than the men and the younger age-groups did.
ANOVA on the evaluation of female driver’s courtesy behind the wheel revealed a significant main effect of participants’ age (F(2, 285) = 5.11, p < .01, η p ² = .04), but no participants’ sex or participants’ age x sex interaction. Post hoc analysis indicated that the 45–64 age-group evaluated female drivers as more courteous behind the wheel than the younger age-groups did.
ANOVA on the evaluation of female’s compliance with traffic rules revealed a significant main effect of participants’ age (F(2, 285) = 4.97, p < .01, η p ² = .03), but no participants’ sex or participants’ age x sex interaction. Post hoc analysis indicated that the 18–24 age-group evaluated female drivers as less compliant with traffic rules than the older age-groups did.
ANOVA on the evaluation of female drivers’ risk avoidance revealed a significant main effect of participants’ sex (F(1, 285) = 4.14, p < .05, η p ² = .01), participants’ age (F(2, 285) = 3.10, p < .05, η p ² = .02), but no participants’ age x sex interaction. Post hoc analysis indicated that the women and the 45–64 age-group evaluated female drivers as more risk avoiders than men and the 18–24 age-group did.
Endorsement of SSAD according to sex and age
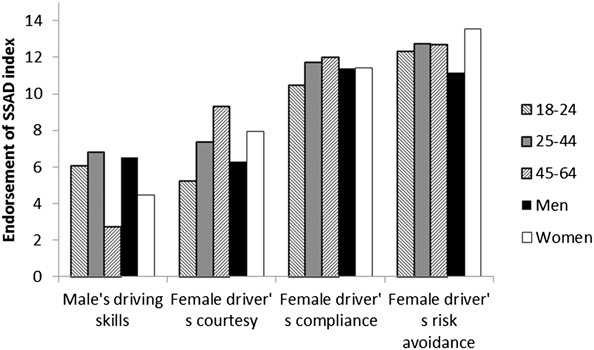
ANOVA were carried out on the effects of participants’ sex (2) and age (3) on all the indexes measuring endorsement of SSAD: male’s driving skills, female’s courtesy behind the wheel, female’s compliance with traffic rules and female’s risk avoidance in driving. The means and standard deviations for each endorsement index for each participant’s age and sex group are presented in figure 1.
Endorsement of SSAD index for each participant’s age and sex group.
The endorsement indexes corresponded to the difference between participants’ evaluation of male and of female drivers:
Male’s driving skills index = participants’ ratings for male’s minus female’s driving skills
Female driver’s courtesy index = participants’ ratings for female’s minus male’s courtesy behind the wheel
Female driver’s compliance index = participants’ ratings for female’s minus male’s compliance with traffic rules
Female driver’s risk avoidance index = participants’ ratings for female’s minus male’s risk avoidance

ANOVA on the stereotype endorsement index concerning male's driving skills revealed a significant main effect of participants’ sex (F(1, 285) = 5.32, p < .05, η p ² = .02), participants’ age (F(2, 285) = 6.95, p = .001, η p ² = .05), but no participants’ age x sex interaction. Post hoc analysis indicated that the men and the 45–64 age-group endorsed the stereotype on male’s driving skills more than the women and the younger age-groups did.
ANOVA on the stereotype endorsement index concerning female’s courtesy behind the wheel revealed a significant main effect of participants’ age (F(2, 285) = 4.36, p = .001, η p ² = .03), but no participants’ sex or participants’ age x sex interaction. Post hoc analysis indicated that the 45–64 age-group endorsed the stereotype on female driver’s courtesy more than the 18–24 age-group did.
ANOVA on the stereotype endorsement index concerning female's compliance with traffic rules revealed no main effect of participants’ age and participants’ sex, but a significant participants’ age x sex interaction (F(2, 285) = 3.49, p < .05, η p ² = .02). Post hoc analysis indicated that the women aged 45 to 64 endorsed the stereotype on female driver’s compliance more than the men of the same age and the 18–24 year-old women did.
ANOVA on the stereotype endorsement index concerning female's risk avoidance revealed a significant main effect of participants’ sex (F(1, 285) = 4.59, p < .05, η p ² = .02), but no participants’ age and participants’ age x sex interaction. Indeed, the women endorsed the stereotype on female driver’s risk avoidance more than the men did.
Discussion
The aim of the present study is to explore the effects of participants’ sex and participants’ age on the endorsement of female and male driver’s stereotypes among French adults.
A questionnaire measuring SSAD was therefore created. Results indicate that each section of the questionnaire (i.e., male and female drivers) is organized in the hypothesized four-factor structure: risk avoidance, driving skills, compliance with traffic rules, and courtesy behind the wheel. These results are in line with previous studies which have shown that these four dimensions differentiate stereotypes on male and female drivers (Berger, Reference Berger1986; Chateignier et al., Reference Chateignier, Chekroun, Nugier and Dutrévis2011; Degraeve et al., Reference Degraeve, Granié and Pravossoudovitch2014; Félonneau & Becker, Reference Félonneau and Becker2011; Granié & Papafava, Reference Granié and Papafava2011).
Concerning sex differences in the endorsement of SSAD, results show no sex differences in the endorsement of the stereotypes stating that females are more compliant with traffic rules and more courteous behind the wheel than males. Thus, both sex groups seem to agree on those aspects of female driver’s behavior: compliance with traffic rules and courtesy behind the wheel are perceived as higher among female drivers. However sex differences are found in the endorsement of the stereotype stating that female drivers are more risk avoiders than males and that male drivers are more skillful drivers than females. In both cases, this result is due to a sex difference in the score attributed to female drivers. Indeed women evaluate female’s risk avoidance higher than men do, while men evaluate female’s driving skills lower than women do. Thus, men denigrate female drivers for the stereotype concerning male drivers whereas women enhance female drivers for a stereotype concerning female drivers. These results are in keeping with research on sex stereotypes, and more generally on intergroup relations, which have shown how individuals seek positive distinctiveness by denigrating the out-group while promoting the in-group (Tajfel & Turner, Reference Tajfel, Turner, Worchel and Austin1986). Power-based gender stereotype approaches (Zemore & Fiske, Reference Zemore, Fiske, Eckes and Trautner2000) and the effects of social asymmetry between the sexes (Hurtig, Kail, & Rouch, Reference Hurtig, Kail and Rouch2002) can provide an additional understanding of these results. Thus, research has shown that the dominant position of the male group (Lorenzi-Cioldi, Reference Lorenzi-Cioldi1988) leads members of the socially dominated female group to over-promote the in-group (Rudman & Goodwin, Reference Rudman and Goodwin2004) and to defend their gender group identity more than males feel the need to.
Concerning age differences in the endorsement of SSAD, age differences are found in the stereotype concerning male’s driving skills and female’s courtesy behind the wheel. In both cases, this result is due to an increase with age in the score attributed to female drivers. More broadly, the increase with age in the score attributed to female drivers is observable for all the scores concerning female drivers. Conversely, only one score concerning male drivers change with age, with older participants perceiving male drivers as more risk avoiders than the younger participants do. These results are in keeping with previous research on sex stereotypes associated with driving, which have shown that the social representation of male drivers remains steady from the age of eleven, whereas the social representation of female drivers varies with age (Reference Degraeve, Granié and PravossoudovitchDegraeve et. al, 2014; Granié & Papafava, Reference Granié and Papafava2011). Driving is, from an early age, associated with male’s roles. Thus, male driver is the normative reference for drivers (Dontsov & Kabalevskaya, Reference Dontsov and Kabalevskaya2013), base on which, by differentiation and opposition, the typical behavior of female drivers is defined, being more ambivalent and heterogeneous due to the different identity issues for males and females.
In the present study, a questionnaire measuring four dimensions of SSAD is created. Although this questionnaire show good internal reliability and is able to measure the endorsement of stereotypes concerning male and female drivers without the participants’ having to compare them directly, some precautions must be taken in the use of the results. Indeed, we undertake a web-based survey, but only 63% of households have internet access at home in France (Deroin, Reference Deroin2010), mainly among the middle and upper socioprofessional categories, whereas socioeconomic status could influence perception of male and female drivers (Degraeve, Granié, Lo Monaco, & Pravossoudovitch, Reference Degraeve, Granié, Lo Monaco and Pravossoudovitch2015). Future research should confirm these results on a larger and more representative sample of the French population. Moreover, this questionnaire is not age specific. Indeed, when participants rate male and female drivers, the age that participants attribute to the driver is not taken into account and therefore not controlled. Future research should take this parameter into consideration, as it could potentially influence the participant’s endorsement of the different stereotypes for male and female drivers. Finally this SSAD questionnaire is made up of 54 items (27 items in each section) and may be too long for use with other self-reporting measures and lead to overly lengthy completion time. Future studies could create a shorter version that is capable of measuring SSAD with fewer items and use such a tool to measure driving-related stereotypes in the French population in order to study the influence of the endorsement of these stereotypes on other self-reporting measures such as driving self-efficacy and driving behaviors.