Cotton was a key sector in nineteenth century industrialization. During the Industrial Revolution, the industry demonstrated remarkable technological progress and productivity advance. Both the markets for its raw material and its finished products were global. At the same time, the industry remained very spatially concentrated. In 1800, the United Kingdom had 95 percent of the world's spindles, in 1850 it had 69 percent, and in 1900 still 58 percent (Farnie and Jeremy Reference Farnie, David, DouglasFarnie and Jeremy2004). The cotton industry accounted for 22 percent of British industrial value added and 50 percent of British merchandise exports in 1831; during the years 1780–1860 it sustained an average rate of total factor productivity (TFP) growth of 2.6 percent per year while contributing about a quarter of the economy's total TFP growth (Crafts Reference Crafts1985).
Even within the United Kingdom, the industry was highly localized and increasingly so. In 1850, Lancashire accounted for 66 percent of spindles and in 1903 that share had risen to 79 percent (BPP 1850; BPP 1903). Given that the cotton industry witnessed substantial change in terms of power technology, mechanization, and processing techniques, this locational persistence is quite remarkable. It is also well known and is a staple of accounts of the development of the industry. For example, Douglas Farnie (Reference Farnie1979) devotes a lengthy chapter to this phenomenon and its extensive historiography. He identifies a number of plausible hypotheses but recognizes the absence of a proper explanation. In fact, we lack any quantitative analysis that tackles an interrelated set of questions: Why was so much of the United Kingdom industry in Lancashire? Why did it stay there? Why did other areas of the United Kingdom, which had at least some of the characteristics believed to be attractive to the industry, fail to develop cotton textiles?
Given the role of cotton textiles in nineteenth century industrialization, explaining its location is clearly an important task for economic history. Recent historiographical trends add value to such an investigation. To begin the new economic geography, including models featuring the possibility of “geographical lock-in” such as Paul Krugman (Reference Krugman1991) or more recently Stephen Redding et al. (Reference Redding, Sturm and Wolf2011) has sparked an interest in location decisions. This has produced work such as Joan R. Roses’ (Reference Rosés2003) study of industrialization in Catalonia. Second, economists are now giving much attention to “directed technological change” (Acemoglu Reference Acemoglu1998) in which both natural endowments and market demand conditions are seen as driving decisions to develop new technologies. Here the key economic history reference is Robert Allen (Reference Allen2009). He emphasizes the joint role of cheap energy and high wages in directing the development of textiles technology during the British industrial revolution. In this context, understanding the interaction between factor prices, other locational characteristics, and choice of locations assumes added significance.
In this article, we try to account for the location of the United Kingdom cotton textiles industry in 1838 using a detailed statistical report that resulted from the implementation of the Factory Act (BPP 1839). The report was the most detailed ever published by the Factory Inspectors and gave information on the distribution of employment and the use of power both at the county level for all parts of the United Kingdom (including Ireland) and for individual towns. It has already been used for a number of statistical analyses about the nature of the industry within Lancashire (for example, Gattrell Reference Gatrell1977; Rodgers Reference Rodgers1960). However, no onehas used it to shed light on the spatial distribution of the cotton industry across Britain.
LITERATURE SURVEY
A good starting point is the classic study by Farnie (Reference Farnie1979, Ch. 2) who stated that: “The original advantages of Lancashire comprised its poverty, its climate, its water supply, its textile tradition and its mechanical inventions. The acquired advantages included its supply of coal, machinery and labour, its access to the markets of Liverpool and Manchester, its low transport cost, and its auxiliary industries” (1979, p. 46).
In Farnie's elaboration of these original advantages, “poverty”stood for the county's poor soils; “climate”involved the damp air that increased the pliability of cotton fibers and reduced the risk of breakages in the yarn;“water supply” denoted the abundance of fast-running streams that can provide water power. Overall, this represents an argument that original natural advantages were later augmented by investment and culminated in agglomeration advantages.
The same factors have been highlighted by other writers. The importance of Lancashire's proto-industrial traditions is emphasized by Mary B. Rose (Reference Rose and Rose1996). She does caution that the emergence of rural manufacturing in impoverished upland areas with poor-quality agricultural land was not an automatic precursor to industrial cotton manufactures. Nevertheless, she points out that there was an almost perfect geographic coincidence of eighteenth century fustian manufacture with the location of the modern cotton industry (1996, p. 15). Rose's account resonates both with Farnie's list of Lancashire's original advantages and with his acquired advantages in sustaining the location of the industry.
Many people have remarked on the eventual tendency of the cotton industry within Lancashire to locate on the coalfield in an era when coal was very expensive to transport over land. Rodgers (Reference Rodgers1960) represents a very strong version of the argument that the location of the industry was basically determined by the price of coal, an important intermediate input, at least once steam power took over from water power in cotton mills. Nick von Tunzelmann (Reference Von Tunzelmann, Langton and Morris1986) cited estimates that the transport cost for coal was about 2.5 pence per mile in the early 1840s which would have doubled the pithead price at a locationten miles away.
Theo Balderston (Reference Balderston2010) suggested that agglomeration advantages were the real secret of Lancashire's success and provides a long list of what these comprised including tacit knowledge, dense labor markets, specialist suppliers who inter alia lowered machinery costs, and the unique density of the Liverpool raw cotton market. This claim resonates with ideas from Alfred Marshall (Reference Marshall1919) and the new economic geography. One obvious feature of successful agglomerations is that they tend to bid up the price of labor but keep unit labor costs competitive through external economies of scale.
The ultimate importance of agglomeration advantages for Lancashire's success is generally agreed, as is the observation that, as steam power superseded water power, the industry became more spatially concentrated even within Lancashire itself. This process of further spatial concentration and agglomeration entailed a shrinking of the industry's geographical breadth rather than a move to completely new locations, although there were other areas with lower wages, cheap coal, access to ports, high humidity, etc. Nevertheless, older plants stayed in business into the second half of the nineteenth century by adopting auxiliary steam engines and by substituting steam engines for water wheels (Taylor Reference Taylor1949).
The nature of the original advantages resulting from climate and natural resources has proved contentious. In claiming that humidity was an important asset, Farnie was reasserting a traditional belief that had been strongly disputed and somewhat discarded following a critical analysis by H.W. Ogden (Reference Ogden1927). Ogden, along with Rollin Salisbury Atwood (Reference Atwood1928), argued that the real advantage was in the ready availability of soft water which was helpful for the finishing industries but also for the boilers of steam engines. In turn, this claim was vigorously attacked as a myth by H.B. Rodgers (Reference Rodgers1960), who stressed that pollution had negated any possible advantage from water quality.
Overall, no one is proposing that there is a single factor explanation for the dominance of Lancashire in cotton textiles. If anything, as with Farnie (Reference Farnie1979), we are presented with a “laundry list.” Only occasionally is there a sense of how much of an advantage or handicap a given attribute offered. For example, Farnie (Reference Farnie1979, p. 49) suggested that Lancashire's natural humidity could be seen as the equivalent of a 10 percent tariff. Rodgers argued that a mill located far enough from a coal mine so that it would pay twice the pithead price faced a cost penalty equivalent to a 20 percent wage increase (1960, p. 140). Instead, the annual saving from clean soft water for spinners and weavers was only equivalent to 5 percent of the cost of fuel (1960, p. 142). We do not, however, have an analysis which carefully examines the trade-offs between different locations. This is unfortunate because, as we shall see, Lancashire does not appear to have been uniquely blessed with any one cost advantage other than, eventually, the “acquired” benefits of agglomeration.
EMPIRICAL STRATEGY AND THEORETICAL FRAMEWORK
Our aim is to put these claims from historical narratives into a theoretical framework and confront them with statistical evidence. To this end, we first discuss more generally estimation methods before we provide a theoretical framework that specifies how the explanatory variables interact. Following the literature on location choice starting with Daniel McFadden (Reference McFadden and Karlquist1978) and Dennis Carlton (Reference Carlton and Wheaton1979), we consider the location choice of a profit-maximizing mill owner in nineteenth century Britain. The fact that we use here only one cross-section of data implies we must focus on the long-run determinants of location choice, because our data includes newly established mills as well as mills founded decades ago in the mid-eighteenth century. Hence, our results will reflect the effect of different factors on a mill owner's decision to produce at a particular location—by starting a new mill or by deciding to continue production in an existing mill. Because we have only one cross section, some of our results will suffer from the effect of omitted variables not reported at that time. In order to address this issue, our estimation allows for region-specific variation in constants (region fixed effects) and in the distribution of errors (clustered and heteroskedasticity-robust standard errors).
In modeling location choice, we assume first that a (current or prospective) mill owner can locate his plant in one of J possible locations, where we treat the location choices as independent of one another. In particular we use a Poisson model, which is, as shown by Paulo Guimaraes et al. (Reference Guimaraes and Woodward2003) observationally equivalent to conditional logit models, but much more tractable. The profit to a firm i (=1,.., 1823) of locating in j (=1, …148) can be described with an unobservable latent variable π* as

where the first is a deterministic part and the second a stochastic part. In equation (1), the letter x denotes a vector of location-specific variables at location j. (One might also want to include a vector of possible industry or firm-level characteristics, but we do not have those.) The decision maker now selects one out of the J mutually exclusive alternatives and we assume that the locations we observe in our data are those that maximize the profit π*. With this, the probability that we observe a cotton mill i at location j is

Hence, the probability of observing location choice j for mill i depends on the distribution of the stochastic part ε, given the (observed) deterministic part V. The Poisson estimator assumes that the expected number of mills at j, E(nj ) is independently Poisson distributed with region-specific mean as

Hence, we assume here that the decisions on plant location can be treated as independent across mill owners. We will estimate the vector of coefficients β in equation (3) using maximum likelihood. To ease the interpretation of estimation results, Kurt Schmidheiny and Marius Brülhart (Reference Schmidheiny and Marius Brülhart2011) note that for the Poisson-estimator the elasticity of the expected number of firms in location j, E(nj ), with respect to a change in the k-th locational characteristic xk of region j is simply given by its coefficient in the profit function:

We will make use of this property in our empirical analysis.
The next step is to formulate hypotheses about locational characteristics that would matter for location choice. In terms of equation (3), we therefore need to distinguish between various types of location characteristics, xjk . Some characteristics were already highlighted in the historical literature on the cotton industry, including access to water power, and humidity. The recent theoretical and empirical literature on location choice would call these “first nature” characteristics, because they can be treated as fixed. In addition, the literature highlights “second nature” factors, which are directly affected by (endogenous to) location choices and arise from the interaction between locations.
To understand how “first nature”and “second nature” characteristics play together, consider the simple framework proposed by Pierre-Philippe Combes et al. (Reference Combes, Mayer and Thisse2008, Chapters 4 and 12). They show that in a standard model with monopolistic competition, transportation costs and several inputs, total profits for a firm located in j can be formulated as a function of three groups of factors: variable costs, fixed costs, and benefits from market access. To keep things simple, we can assume that differences in variable costs mainly reflect differences in “first nature” characteristics between locations, while variations in fixed costs and market access are endogenous to earlier location choices. Hence they reflect “second nature” characteristics. Optimal location choice therefore involves searching for the place that maximizes profits with respect to variable and fixed costs and benefits of market access:
![\[
\begin{array}
Max(Profit) = Max[cm- - M -] j {J}
\end{array}
\](https://static.cambridge.org/binary/version/id/urn:cambridge.org:id:binary:20160927090728666-0634:S0022050714000874:S0022050714000874_eqn5.gif?pub-status=live)
where m stands for the marginal costs of some input factor, c and σ are parameters (both > 0), F stands for fixed costs and MP gives the benefits from access to markets that will increase in own market size and good access to neighboring markets.Footnote 1 In this case earlier location choices affect future choices because they change market sizes and the size of neighboring markets. Therefore, even if a location starts to become less attractive in terms of variable costs, the benefits from a large market (that comes from having a large installed capacity) can still outweigh this disadvantage.
For our analysis of the location of the cotton industry, we need to modify this theoretical framework to account for the effect of technological change. This change should have led to a relocation of cotton mills, as some “first nature” characteristics became less relevant (e.g., water power), while others (e.g., coal) started to become essential. However, fixed costs can delay or even prevent such relocation. The assumption that fixed costs are equal across locations, as in Head and Mayer (Reference Head and Mayer2004), would neglect that a considerable part of the fixed costs are typically sunk costs in the sense that they have been incurred in the past (such as costs for a building), and they are location-specific so that they cannot be recovered upon exit (Motta and Thisse Reference Motta and Jacques-FrançoisThisse1994). In the presence of sunk costs some fraction of fixed costs will now matter for a firm that considers relocating, even if fixed costs are perfectly equal across locations. More generally, this introduces an extra cost of relocation: the existence of sunk costs will dampen the impact of current or prospective changes in the differences in variable costs as well as market access between locations and will increase the impact of past differences (see appendix for a theoretical discussion).
In our context, consider the investment of a cotton mill owner into power equipment. A waterwheel installed in the past is tailor-made to the nearby river or stream and will have little resale value. However, a part of the old construction and machinery can be reused with the arrival of the new steam power technology or combined with it, saving the costs of relocation. For example, at the Quarry Bank Mill in Styal near Manchester, the first steam engines were installed in 1810 to provide auxiliary power to the existing water wheels and as a precaution against water shortages. After several decades the mill was still operational at its old location but nearly entirely steam powered.Footnote 2 In addition, the waterway infrastructure (canals, weirs, water reservoirs) put in place for the old water-power technology remained useful for the new steam power technology as well for two reasons: first, because steam engines needed access to water for feeding boilers and condensing steam (Holden Reference Holden1999), second, because waterways reduced the cost of transporting raw materials and finished products (Maw et al. Reference Maw, Wyke and Kidd2012).
To summarize, we see that there are three main types of locational characteristics that affect location choice: variable costs (or “first nature” characteristics) as well as fixed costs and benefits from market access (or “second nature characteristics”), which interact over time. In general, contemporaneous variation in all three types of factors should matter for location choice. However, past variations in operating profits can modify the impact of contemporaneous variation in variable costs due to two types of path dependency: first, there can be positive feedback effects due to market access as highlighted in new economic geography models in the wake of Krugman (Reference Krugman1991). Second, sunk costs can introduce another form of hysteresis in location choice that can delay relocation (similar to the mechanism discussed in Redding et al. (Reference Redding, Sturm and Wolf2011)). Without direct evidence on the extent of sunk costs, such an effect will always be implicit in the estimated effect of variable costs (or “first nature” characteristics) and market access. In particular, omitting sunk costs will bias these coefficients upwards. In the next section we now turn to empirical evidence on the effect of specific types of costs and market access effects.
DATA ON THE LOCATION OF THE BRITISH COTTON INDUSTRY AND ITS POTENTIAL DETERMINANTS
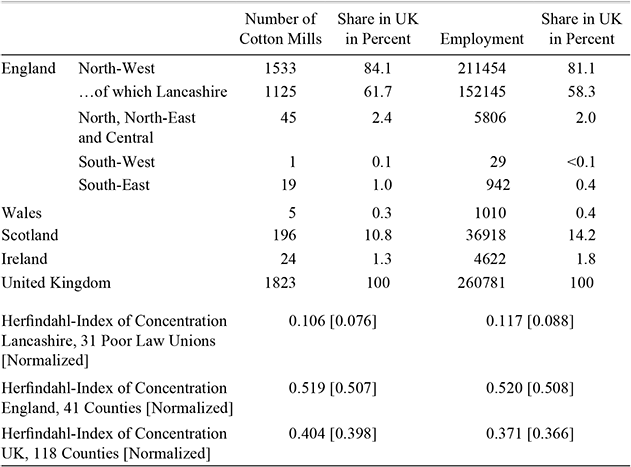
We seek to explain the location decisions which underlie the observed spatial distribution of mills and employment in the United Kingdom cotton textile industry in 1838. We consider employment in each county but also divide Lancashire into sub-divisions based on Poor Law Unions. Our dependent variable number of mills or employment at a given location is derived from the Factory Inspectors’ report for 1838 (BPP 1839). Table 1 provides descriptive statistics for the location of cotton mills and their employment, and Maps 1 and 2 show the substantial geographical variation in concentration.
By 1838 much of the industry was in the northwest, and a very high share in Lancashire alone, it was also highly concentrated at the county level. Many counties had no cotton textile employment at all. In fact 92 of the 148 locations in our data set have no cotton industry and even within Lancashire 10 of the 31 Poor Law Unions had no cotton mills or employment. On Maps 1 and 2 the “no cotton industry”areacovers most of Britain.
To measure local characteristics, we begin with aspects of what Farnie (Reference Farnie1979) called “original advantages”: poverty, climate, water flow, mechanical inventions, and water quality. Farnie suggests “poverty” as an attractor of cotton textiles. In a comparative advantage view of pre-industrial England, textiles were most likely to be found in areas with low agricultural incomes and low land values. As a proxy we used the land tax which was imposed in the 1690s for England and Wales and in the 1710s for Scotland and for which the valuations did not change thereafter (Ginter Reference Ginter1992). Valuations are reported for the individual parish as well as at the county level in BPP (1844b). These have been converted to a tax rate per acre using the areas reported in John George Bartholomew (Reference Bartholomew1904) and BPP (1862). As shown in Map 3, there is a clear gradient rising from north to south, with show relatively low land-values for Lancashire compared with southern England.
Given that we lack comparable data for Ireland, we provide another measure for the suitability of land for agriculture: ruggedness of the terrain. The data is provided by Nathan Nunn and Diego Pugaavailable at http://diegopuga.org/data/rugged/, which we recalculated to match historical counties and Poor Law Unions. There is a tight correlation (–0.66) between the log of early eighteenth century land tax rates and average terrain ruggedness. Similarly, if we exclude Ireland, the correlation between late eighteenth century wages in agriculture and average terrain ruggedness is also high (–0.56). Therefore, we use ruggedness for which we have data for all of the British Isles rather than land tax rates as our proxy for the suitability of land for agriculture to capture Farnie's notion of poverty as an “original advantage.”
The Location of the Cotton Industry in 1838

Notes:
North West is Cheshire, Derbyshire, Lancashire, and Yorkshire WR. North is Northumberland, Cumberland, Durham, Westmoreland, North East is Lincolnshire, Nottinghamshire, Yorkshire ER and yorkshire NR. Central is Warwickshire, Leicestershire, Northamptonshire, Huntingdonshire, Rutland, Cambridgeshire, Bedfordshire, Buckinghamshire, Oxfordshire, Hertfordshire, Middlesex, Berkshire. South East is Norfolk, Suffolk, Surrey, Essex, Kent. South West is Cornwall, Devon, Dorset, Gloucestershire, Hampshire, Herefordshire, Somerset Staffordshire, Worcestershire, and Wiltshire.
Source:
Factory inspectors’ report for 1838 (BPP, 1839).
To measure humidity, which Farnie (Reference Farnie1979) saw as the key aspect of climate, we use data on vapor pressure and on mean daily temperature averaged over 1901–2006, which permits calculation of an estimate of relative humidity.Footnote 3 The data is shown on Map 4. It is informative to see that the lowest estimated value of relative humidity is 83.5 percent—well above the 50–54 percent considered by Cecil H. Lander (Reference Lander1914) to be the minimum for cotton spinning. While levels of humidity do vary over the year and within a day, they typically stay well above this critical level at any time. In fact all locations in the United Kingdom met the required level. Lancashire observations are all very similar and lie just below the average for all of the British Islands. Moreover Lancashire has substantially lower levels of relative humidity than other parts on the Atlantic coast, notably western Ireland and the Southwest of England.
The Location of Cotton Mills in Britain 1838

The availability of suitable water flows is another aspect of nature which wecapture through modern data. We use data from the UK Hydrometric Register (2008), which provides basic statistical information on the average extent and volatility of water flows, based on 1,454 “gauging stations” across the United Kingdom in modern boundaries (including Northern Ireland but not the Republic of Ireland). Matching flow data for Ireland were obtained from Ireland's Environmental Protection Agency (EPA, at http://hydronet.epa.ie/) for 125 gauging sites. Most of the data is averaged over several decades, typically over periods of 30 to 50 years. For our purposes these data include two useful variables, namely the “mean flow” and the “q95.” The former gives the average water flow of rivers in cubic meters per second and the latter gives the flow which was equaled or exceeded for 95 percent of the time. The mean flow data ranges from values of below 1 cubic meter per second up to more than 89 in England and even 165 if we include Scotland, with an average of 4 and 6 cubic meters per second for England and the United Kingdom, respectively. Data on “q95” range from near zero to more than 42 cubic meters per second in the United Kingdom, with an average of 1.1 meters. Mean flow and q95 values for rivers in Lancashire, including the Irwell, Darwen, Mersey, or Ribble in Lancashire along which many of the early cotton mills were located, are typically above the English average. As shown in Map 5, Lancashire has good access to rivers with high mean flow levels, but it was not the only county so endowed.
The Location of Employment in the Cotton Industry in Britain 1838
Land Taxes in England, Wales and Scotland (Shilling Per Acre, CA 1700)
To assess Ogden's (Reference Ogden1927) argument, we also collected data on water quality, specifically on water hardness (the concentration of calcium carbonate (CaCO3)). Data for average total water hardness for about 2,500 sites across the United Kingdom was kindly provided by the Environmental Change Research Centre, UCL.Footnote 4 We complement this data with information from the Irish Water Framework Directive (WFD) River Basin District Management Systems, Working Group on Groundwater Guidance (2005). Again, we find considerable variation over space. Lancashire has moderately soft water.
To capture the idea of an earlier textile tradition as well as a location's technical capabilities to produce mechanical inventions, we use James Dowey's novel data set on the location of patent holders, weighted by their impact.Footnote 5 The variable (Patent Citations) is a location-specific index based on the number of patents that people resident at that locationhold, weighted by the number of times this patent was cited in the technology literature through 1862. The data set starts in the early seventeenth century and includes all patents relevant to the textiles industry in a broad sense. Dowey shows that it is important to de-trend this data to take into account that older patents would have a higher probability of being cited independent of their technical importance. We use only patents awarded up to 1815 to limit endogeneity issues. Many regions of Britain produced innovators. Before 1815, Lancashire was not a particularly innovative area, but it was near to regions with very high innovative activity.
Average Relative Humidity in Percent
Q95 (Water Flow Measured at Least 95 Percent of Time in mFootnote 3 /second) at Gauging Stations in the United Kingdom and Ireland
Next, let us consider several factors, which Farnie (Reference Farnie1979) termed the “acquired advantages”’ relevant to decisions about where to locate the cotton industry. This category must include coal because substantial effort is necessary to find and exploit a location's coal reserves and because the price of coal in a location reflects both how far it is from natural coal resources and the transport infrastructure. Cheap coal in Lancashire emerged as a supply response to industrial growth (Langton Reference Langton1979). Information exists for years close to 1842 and 1843 on coal prices paid by Poor Law Unions in England and Wales (BPP 1843) and in Scotland (BPP 1844a) and from Robert Kane (Reference Kane1845) for Irish regions. These data, displayed in Map 6, show a very wide range of prices. Coal was most expensive at Bradfield in Berkshire (40 shillings per ton). In rural southern England it was not uncommon to pay 30 shillings or more. The lowest price was 4 shillings and 2d at Leigh in Lancashire but prices only marginally higher were recorded at Poor Law Unions in Durham and Northumberland. Map 6 again shows the data at the county level and for Poor Law Unions within Lancashire. But how much of the variation in coal prices is due to variation in first nature? We cannot tell exactly, because the first comprehensive set of data on British coal deposits was collected by the Coal Commission for all known coalfields around 1870 (BPP 1871). From this source we estimated the amount of coal measured in statute tons in each of our 148 locations. Using this measure we find that about 20 percent of the variation in 1840s coal prices can be explained by local coal deposits as known in 1871. For example, the region with the highest estimated coal deposits (Carmarthenshire in Wales) shows around 1840 coal prices similar to the sample average, probably due to the fact that large-scale coal mining in the region started only in the 1850s. In addition, a measure of access to coal deposits taking into account transport costs based on von Tunzelmann (Reference Von Tunzelmann, Langton and Morris1986) can explain more than 50 percentof coal price variation. We take this as evidence that coal prices, which are the relevant variable facing a mill-owner, reflect geology to some extent but also indicate that cheap coal was an “acquired advantage.”
British Coal Prices (Shillings Per Ton, around 1842)
A simple way to capture foreign market access is to consider average distance to major ports weighted by the tonnage that they handled, based on the list of 12 principal ports in BPP (1854). An alternative is to restrict the measure of distance to Liverpool or London, the two most important ports when cotton took off. The literature on the location of the industry in Lancashire might even hypothesize that proximity to Liverpool would suffice given its ultimate dominance. It is obvious that measured in this way Lancashire is a county with excellent access to markets, but so are several counties close to London.Footnote 6
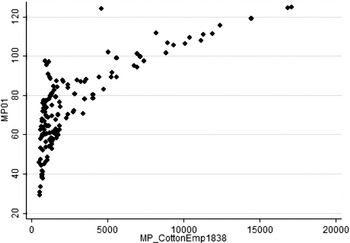
Next, we explore the role of benefits from agglomeration in terms of a proxy variable, domestic market access. These advantages which accrue from tacit knowledge, deep labor pools, dense networks of suppliers, etc.,are generally thought to have been important in the nineteenth century cotton industry (Hanlon Reference Hanlon2013; Leunig Reference Leunig2003; Broadberry and Marrison Reference Broadberry and Marrison2002). As a first approximation, the extent of external economies of scale might be captured by distance-weighted employment for which we could usethe Factory Inspectors’ Report (BPP 1839). However, such a measure is directly related to the variable that we are trying to explain, namely the number of cotton mills and their employment in 1838. To limit this problem of endogeneity, we note that a location's access to overall population around 1800 is highly correlated (with a correlation coefficient of about 0.77) to agglomeration in terms of cotton textiles employment in 1838 but can be regarded as exogenous to the number of mills and employment a generation later (see the scatterplot in Figure 1). Map 7 shows the resulting measure of market potential approximated by population in 1801. South East Lancashire clearly scores very highly in terms of market potential.
Lancashire may have benefited from agglomeration but its corollary was high wages. The only source that has a national scope for our period is the data on agricultural wages compiled by Arthur Lyon Bowley (Reference Bowley1900). Lancashire was clearly a relatively high wage location in the late 1830s, certainly compared with many agricultural areas of the United Kingdom. High wages were no doubt an endogenous result of the concentration of the industry and a cost to be accepted because it was compensated by high productivity rather than an advantage per se.Footnote 7
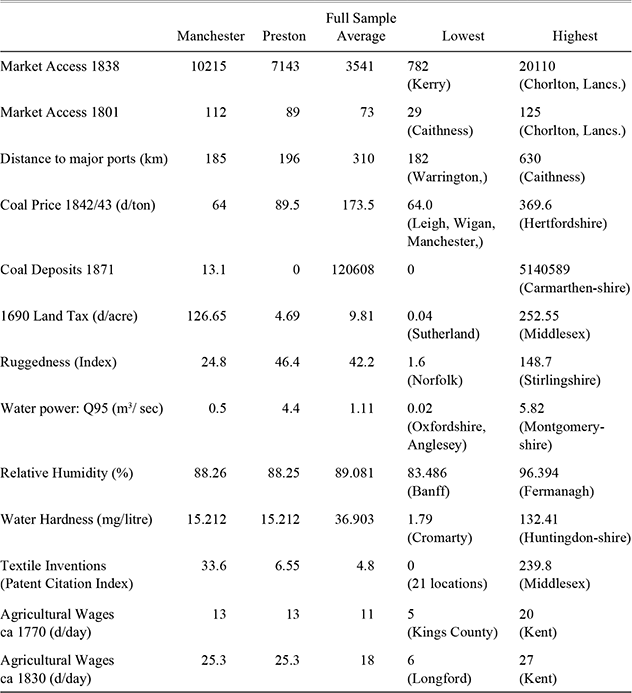
Table 2 summarizes this discussion of the data. We see that the Lancashire locations (Manchester and Preston) were well placed compared with the average of other locations in most respects. On the other hand, few Lancashire observations were best-placed on any single characteristic. Turning to Lancashire as a whole, the county has the location with the best score in terms of market access and coal prices but not for anything else.
Scatterplot of Market Potential (Population 1801) and Market Potential (Cotton Textiles Employment 1838)

EMPIRICAL RESULTS
Benchmark Results
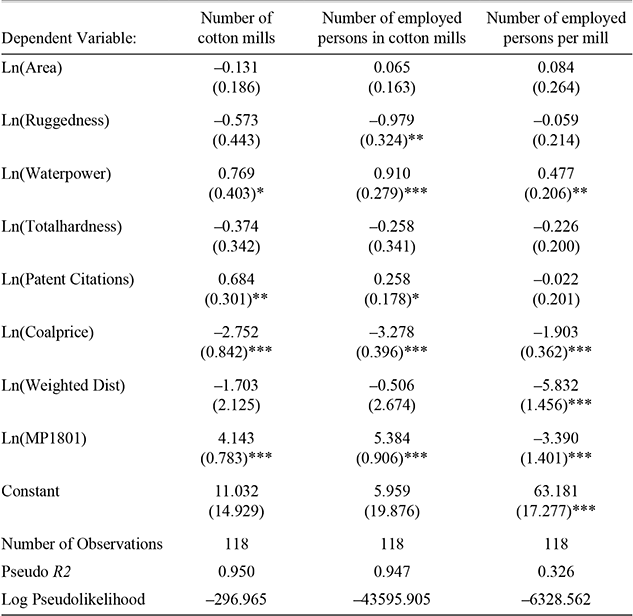
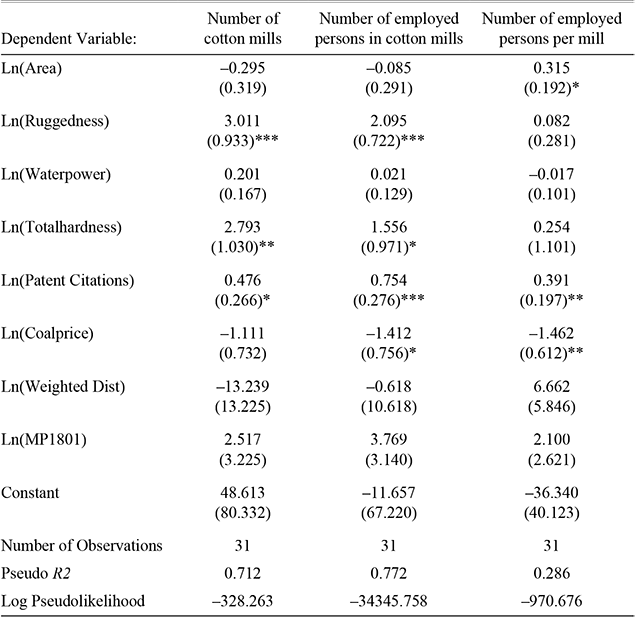
In this section we fit a Poisson model for the location of the cotton textiles industry across the British Islands according to the Factory Returns for 1838. We first estimate the expected number of cotton mills for each location as a function of locational characteristics as described above (Table 3, columns 1 and 2). Next, we estimate the expected number of employed persons in the cotton industry for each location (columns 3 and 4). Finally we estimate the expected number of employed persons per mill or average mill size, where in this last case the number of persons per mill is set to zero whenever there is no industry at a location (column 5). In each specification we add the (log of) area of various locations in kmFootnote 2 as a control to account for the fact that, if location choices were entirely random, smaller locations should always have fewer cotton mills than larger locations, ceteris paribus (Ellison and Glaeser Reference Ellison and Glaeser1997). We also add a set of region dummies and allow for regional variation in the distribution of errors (heteroskedasticity) in all specifications.
The Location of Cotton Mills in Britain 1838
Table 3 shows that a larger area seems to increase the likelihood of finding a mill and cotton industry employment but the effect is not always statistically significant, depending on the specification. A location's terrain as measured by its average ruggedness tends to have a large and significant effect. It is interesting to note that this variable only matters for the location of mills. If we interpret ruggedness as a measure of the unsuitability of land for agriculture, this lends strong support to Farnie's notion of poverty as an “original advantage.”Footnote 8 Our next finding is quite revealing: higher levels of average relative humidity appear to reduce a location's attractiveness for the cotton industry, not increase it. Although the effect is large it is never significantly different from zero in any estimation. It seems that humidity was not a determining factor. Similarly, the quality of water (hardness) does not matter much: the estimated coefficients are far from significant. This might be due to measurement problems because the quality of water varies substantially between neighboring locations, which we cannot perfectly capture. Therefore, we also provide results after dropping the humidity and hardness variables, which remain largely unchanged (compare columns 1 with 2 and 3 with 4).
Characteristics of Different Locations, C.1838

Notes:
North West is Cheshire, Derbyshire, Lancashire, and yorkshire WR. North is Northumberland, Cumberland, Durham, Westmoreland, North East is Lincolnshire, Nottinghamshire, yorkshire ER and yorkshire NR. Central is Warwickshire, Leicestershire, Northamptonshire, Huntingdonshire, Rutland, Cambridgeshire, Bedfordshire, Buckinghamshire, Oxfordshire, Hertfordshire, Middlesex, Berkshire. South East is Norfolk, Suffolk, Surrey, Essex, Kent. South West is Cornwall, Devon, Dorset, Gloucestershire, Hampshire, Herefordshire, Somerset Staffordshire, Worcestershire, and Wiltshire.
Source:
Factory inspectors' report for 1838 (BPP, 1839).
Poisson Model of Cotton Industry Location, Britain 1838
Notes:
North West is Cheshire, Derbyshire, Lancashire, and yorkshire WR. North is Northumberland, Cumberland, Durham, Westmoreland, North East is Lincolnshire, Nottinghamshire, yorkshire ER and yorkshire NR. Central is Warwickshire, Leicestershire, Northamptonshire, Huntingdonshire, Rutland, Cambridgeshire, Bedfordshire, Buckinghamshire, Oxfordshire, Hertfordshire, Middlesex, Berkshire. South East is Norfolk, Suffolk, Surrey, Essex, Kent. South West is Cornwall, Devon, Dorset, Gloucestershire, Hampshire, Herefordshire, Somerset Staffordshire, Worcestershire, and Wiltshire.
Source:
Factory inspectors' report for 1838 (BPP, 1839).
Next, we find that the availability of water power, measured here as proximity to rivers and streams with fast and steady water flow (water power: q95) exerted a strong influence. In all specifications, we find that good access to water power increases a location's probability of having a cotton industry, and also that it increases the expected size of that industry. Finally, we turn to the last aspect of Farnie's list of original advantages: a location's mechanical inventions. Our proxy, based on weighted patents issued before 1815, comes out with a strong positive coefficient, which is about as robust as our finding on access to water power. The elasticity of the expected number of cotton mills as well as the expected employment in any location with respect to this measure is between 70 and 80 percent. Obviously, there may still be an issue of endogeneity, if the incentive to innovate came from the existence of an industry, but we show at least that an earlier track record of innovation up to 1815 had lasting effects into the 1830s.Footnote 9
Turning to Farnie's “acquired advantages,” we first have a surprising result: a location's coal price has a negative but typically insignificant effect on the expected number of cotton millsthat is on the probability of finding a cotton mill at all. This is interesting because in 1838, the share of steam power in total installed power (measured in horse power) was already about 54 percent, and within Lancashire it was 73 percent. Therefore, we might have expected to find a much stronger effect of the coal price. This might be affected by the way we measure market access, because the price of coal and the size of an agglomeration in the 1830s might be positively correlated (Balderston Reference Balderston2010).Footnote 10 What we find is that the probability of finding a cotton mill at all seems to be much more affected by access to waterpower than access to coal. In contrast, the results in columns 3,4, and 5 show that coal prices had a strong impact on industry size, measured in terms of total employment and even more so employment per mill: while some part of the industry could survive with above average coal prices, dear coal apparently put a clear limit on the growth of the industry.Footnote 11 The average cotton employment at locations with above average coal prices is 83 (median is zero), while the average employment at locations with below average coal prices is 3737 (median is 243).
Distance to major ports did matter for the geography of the industry. This makes sense for an industry that was so heavily dependent on imported raw materials, and increasingly relied on foreign demand for its products. However, this effect is less robust than others, possibly because the location of large ports is again correlated with other factors such as market size. Interestingly, we see that the location of larger mills is much more strongly affected by distance to ports than mill location per se. This suggests that mills engaged in foreign trade (via both import and export markets) tended to be larger, which is in line with the recent literature on heterogeneous firms in international trade (Melitz Reference Melitz2003; Melitz and Redding Reference Melitz and Redding2012). Finally, we explore the effect of the size of agglomerations on the expected number of cotton mills and industry size. Using the sum of distance-weighted population as of 1801 across locations as a proxy, we find that agglomerations make it more likely to find a mill and correspondingly that such locations have higher total employment in this industry (columns 1–4). However, we also find that agglomerations are associated with a smaller average mill size, which is in line with earlier findings by Broadberry and Marrison (Reference Broadberry and Marrison2002) and Leunig (Reference Leunig2003). A notable fact about Lancashire's cotton industry was its network of a large number of small but highly specialized and interconnected firms.
ROBUSTNESS CHECKS AND EXTENSIONS
As a robustness check, we rerun our Poisson model with two alternative samples. First, we pool all 31 Poor Law Unions in Lancashire into one observation, the county of Lancashire (Table 4a). Second, we rerun the model for the 31 Poor Law Unions of Lancashire only (Table 4b).Footnote 12
Our results are reasonably robust to changes in regional aggregation, with some interesting exceptions. If we pool the Lancashire Poor Law Unions (Table 4a), we find that ruggedness has no significant effect on the location of cotton mills, a negative effect on employment, but again no detectable effect on the average size of mills. Variation within Lancashire (Table 4b), which is substantial, produces an opposite result. The coefficient on access to water power still has the expected positive sign but is no longer significant. Hence, the finding in Table 3 seems to be largely driven by variation across counties, similar to the finding on distance to ports. However, note that in Table 4b we have only 31 observations, which will reduce levels of statistical significance. The positive coefficient on water hardness within Lancashire is very likely to be spurious, as our data show very little variation across Poor Law Unions.Footnote 13 In comparison, our findings on the negative effect of coal prices and positive effects of innovative activity before 1815 and market access are rather robust to regional aggregation. Higher coal prices make it less likely that a location develops a cotton industry and notably limit the size of mills, while a strong tradition in innovation has the opposite effect. Good market access is a strong predictor for the development of an industry, but seems rather to increase the number of mills, while limiting their size, in line with our findings for the full sample.
Poisson Model of Cotton Industry Location, 118 Counties of Great Britain

* = Significance at the 10 percent level.
** = Significance at the 5 percent level.
*** = Significance at the 1 percent level.
Note:
Robust standard errors in parentheses.
Sources:
See text
Poisson Model of Cotton Industry Location, 31 Poor Law Unions of Lancashire 1838

* = Significance at the 10 percent level.
** = Significance at the 5 percent level.
*** = Significance at the 1 percent level.
Note:
Robust standard errors in parentheses.
Sources:
See text
Our findings cannot be interpreted without considering several important issues. So far we have neglected contemporary wages as a determinant of industry location. This may seem odd, given that wages accounted for a much higher share in total costs than either energy or cotton (see for example, Kane Reference Kane1845, p. 64). A first intuition would suggest that locations with lower wages should be particularly attractive to the industry and this may indeed have been one of Lancashire's original advantages.
For a mill owner in 1838, however, low wage labor could only be accessed in areas where the cotton industry was small or non-existent, in other words, only by foregoing agglomeration benefits. Table 3 shows that agglomeration exerted a strong positive effect on the location of cotton textiles. Theory predicts that successful agglomerations will pay higher wages and in modern data areas with high market potential pay more (Head and Mayer Reference Head and Mayer2006). Data from the 1906 Earnings Enquiry show that higher wages were paid to operatives in districts with larger cotton employment (Broadberry and Marrison Reference Broadberry and Marrison2002). A simple Ordinary Least Squares (OLS) regression suggests that the pattern of wage increases across locations (proxied by agricultural wages due to limits to data availability) is strongly positively affected by the size of the cotton textile industry.Footnote 14 So we can reasonably conclude that wages were endogenous to the size of a location's industry and that the estimated impact of market potential in Table 3 is less than the pure productivity effect of agglomeration because it is dampened by higher wages.
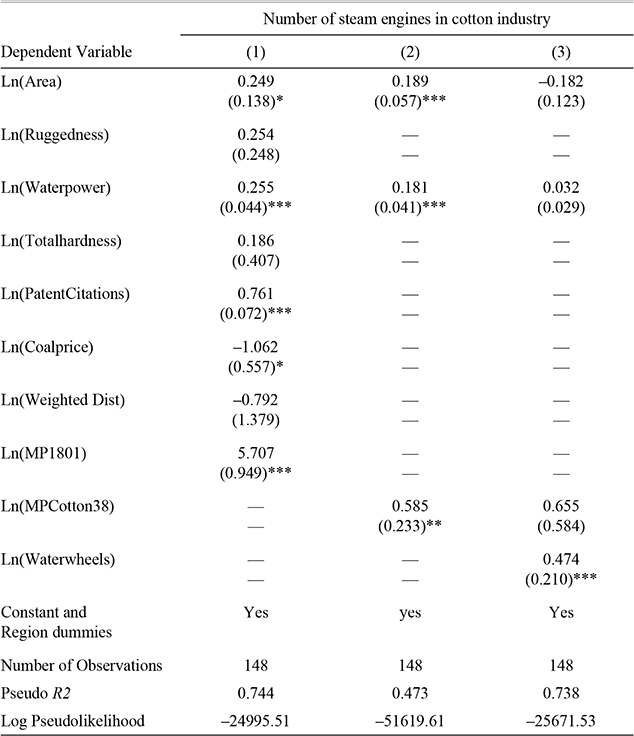
The reader should also consider that cotton was a very dynamic industry, characterized by substantial technological change and probably by high rates of firm and plant entry and exit. Although a panel would be desirable we only have one (albeit very detailed) cross-section of data, 1838. In particular, we argued above that market access and sunk costs can give rise to a geographical lock-in or path-dependency where previous cost advantages (for example, good access to water power) continue to exert an influence, even though technological change seemingly had rendered them irrelevant. One way to go further is to focus on one very particular finding from Table 3: We find that access to water power exerts a strong influence on the location and size of the cotton industry in 1838, while we know that at this time already more than one-half of all power (measured in hp) in the cotton industry was generated by steam engines. To make the point more explicit, we use the same set of variables as in Table 3 to estimate in Table 5 the expected number of steam engines across locations.
We find that the effect of access to water power on the probability of finding steam engines in the cotton industry is comparable to the effect of this factor on the probability of finding a cotton milleven after we control for all the other variables discussed before (Table 5, column 1). Clearly, this cannot reflect any direct effect of water, but suggests that other, indirect channels matter. In our theoretical section, we argued that three types of factors should affect location choices: variable costs, fixed costs (due to the effect of sunk costs),and benefits from market access, which interact over time. The benefits from having good access to water power in 1838 should have become more limited, while the benefits from having good access to coal should have become much more important. Moreover, we would expect to see this effect most strongly for the location of steam engines in the industry.

What then explains the strong effect of water on steam engines? We argued that past variations in local characteristics (such as better access to water decades ago) can modify the impact of contemporaneous variation in variable costs (better access to coal in 1838) due to two types of path dependency. First, there can be positive feedback effects because of market access, as highlighted in new economic geography models since Krugman (Reference Krugman1991). Second, sunk costs can introduce another, additional form of hysteresis in location choice that might delay relocation. In this context, it is noteworthy that our proxy for agglomeration (population in 1801 in neighboring regions) does not eliminate the significant coefficient on water power (compare Table 5, column 1). To investigate further, we can introduce a more direct measure using access to the employment in the cotton industry in 1838 in neighboring regions (ignoring endogeneity problems for the moment). Doing so reduces the estimated coefficient on water power somewhat but it stays positive and highly significant (Table 5, column 2). Given the endogeneity bias, the continuing effect of water poweris probably understated so we can conclude that path dependence due simply to agglomeration does not really explain our finding.
Finally we use the number of waterwheels in the cotton industry as a simple measure of the level of sunk costs in power equipment. Water power should have exerted an indirect effect on the location of steam engines because it had promoted the installation of waterwheels and auxiliary investment such as buildings and of course spinning or weaving machinery using power equipment. Insofar as these could be revamped using steam engines (Taylor Reference Taylor1949), their presence might dampen the incentive to relocate away from a location in response to contemporaneous differences in variable costs, like coal prices. As shown in Table 5, column 3, there is indeed strong evidence that such sunk costs mattered. Controlling for both access to markets and the number of waterwheels, which should capture the essence of the mechanism, the coefficient on access to water power for the number of steam engines across locations stays positive but it becomes statistically insignificant. We conclude that our results on the role of “original” and “acquired” advantages using cross-sectional data reflect much more than the contemporaneous variation across locations in 1838, including also some relevant interactions over time.
DISCUSSION
Clearly, Lancashire's dominance of the cotton textiles industry was not based on having the best position with regard to any of Farnie's “original advantages” and, in turn, none of these was a sufficient condition for cotton textiles to be present in 1838 (see our Maps and Table 2). For example, much of Scotland was better placed with regard to “poverty” and water power, most of Ireland in terms of humidity. Softer water was to be found in parts of Wales. Yet, most of these locations had no cotton mills. Often, however, they were remote, being quite far away from big population centers and large ports.
If there was a necessary condition for having a cotton textiles mill in 1838, a cheap source of power is the nearest candidate. Only 20 mills out of 1823 (7 of which were in Ireland) were in locations where both the price of coal was above average and also water flow was below average. Proximity to population and ports did not prevent a complete absence of cotton millsas was the case in Bedfordshire, Berkshire, and Buckinghamshire, each of which had high coal prices and weak water flows.
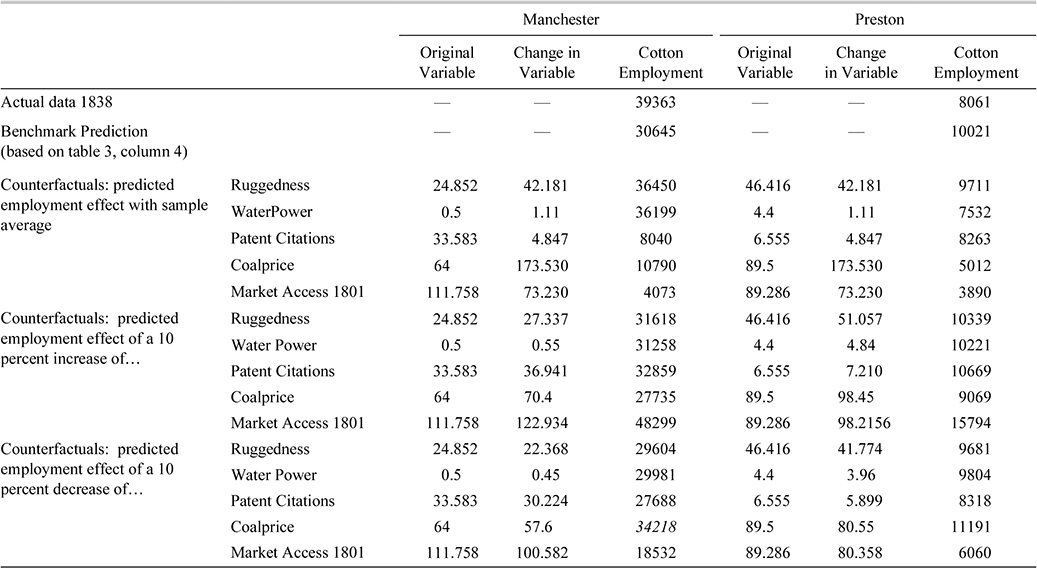
It seems that the cotton industry's preference from Lancashire stemmed from a combination of good first and second nature geography. In terms of what Farnie called “acquired advantages,” Lancashire benefited from cheap coal, proximity to ports, and excellent market access, which made it much more attractive to mill owners than the Celtic Fringes of the British Isles. Table 6 uses our regression results to explore these points and to provide some quantification of Lancashire's advantages. Using model 4 of Table 3, we investigate counterfactual changes in cotton textile employment to the statistically significant characteristics of Manchester and Preston.
We consider first the implications of counterfactuals in which observed characteristics are replaced one at a time by the sample average observation for the variable. The results for both Manchester and Preston show that bringing coal price and market access to their average values would have reduced employment by about 50 percent. In contrast, ruggedness has relatively weak effects and, for Manchester, the direction of change is the opposite. In terms of water power, as historians of the Lancashire cotton industry are well aware, Preston was a favored location but Manchester was not. The counterfactual prediction is that with average access to water power employment in Manchester would have increased significantly but in Preston it would have decreased appreciably. Reducing textile inventiveness (Patent Citations) to the sample average has a big effect on Manchester's cotton employment but a more muted one for Preston (a smaller place).
Counterfactuals

Sources:
See text.
Turning to the counterfactuals where a 10 percent increase is imposed on the independent variables, the most striking result is the strength of the impact of changes in market access compared with the other characteristics. For both Manchester and Preston, in terms of total cotton employment, a 10 percent increase in market access has a bigger effect than a simultaneous 10 percent change for each of the other four characteristics. Since market access effects were growing with the size of the industry while most other characteristics were stable, it is likely that cotton textiles was becoming increasingly “locked in” to its existing heartlands. Nevertheless, good market access could be offset by other disadvantages. For example, for Preston if each of water power, coal price, and textile inventiveness had been only average the model predicts cotton employment would have been close to zero and there were places even within Lancashire itself with better market access than Preston but no cotton mills.
Comparing the impacts of 10 percent changes in different variables reveals something about their relative strength and the tradeoffs that choice of location entailed. For example, Table 6 shows that a 10 percent rise in coal price could be offset by a 44 percent increase in water flow, a 15 percent rise in textile inventiveness, being 28 percent more rugged, or by a 1.6 percent improvement in market access. These results support the emphasis Rodgers (Reference Rodgers1960) gave to coal prices as a major influence in the location of the cotton industry without endorsing his claim that this was the only factor. It might also be noted that, as the industry became more spatially concentrated over time, some locations lost their mills. Based on the data in Peter M. Solar and John S. Lyons (Reference Solar and Lyons2011), we can identify observations in our data set for which there was no mill in 1838 but where there is evidence for cotton textiles at an earlier date. Exit was positively correlated with high coal prices and negatively with textile inventiveness.
Finally, there is an important caveat as to what this methodology cannot do. The counterfactuals show, at best, what would be the implications in 1838 of taking away Lancashire's advantages. They do not provide estimates of the total impact that the “original advantages” had on the location of the industry. Indirect, legacy effects working through accrued agglomeration benefits in the form of sunk costs or otherwise obviously mattered, but are not accounted for in Table 6.
CONCLUSION
We have shown that United Kingdom cotton textiles factories in 1838 preferred those locations with good availability of water power, ruggedterrain, a history of textile invention, close to ports, and with good market access. We have found that lower coal prices did not have a significant effect on the probability that there was a cotton mill in a given location but did increase employment in the cotton industry and the size of mills. We have not found evidence to support the hypotheses that humidity and access to soft water mattered to these issues.
These results vindicate most of Farnie's claims (Reference Farnie1979). In particular it is clear that Lancashire's dominance of cotton textiles was based both on “original” and “acquired” advantages. In the former category, our evidence supports the roles played by “poverty,”“water supply,” and “textile tradition” and, in the latter category, by agglomeration benefits, cheap coal, and access to foreign markets. We do not, however, agree with Farnie's emphasis on the value of a humid climate. Our results are consistent with the view of Rodgers (Reference Rodgers1960) that locations further away from coalfields were at a significant disadvantage in the age of steam power but not that coal prices dominated everything else.
Our results also highlight the close connection between the original geography of the industry and its subsequent location. In particular we found a strong correlation between access to water power and the use of steam engines. This seems to be explained by the impact of the sunk costs of earlier investment in equipment such as waterwheels. We have also found strong evidence for the agglomeration benefits of locating near to other producers which eventually acted to “lock in” the industry to its heartlands. Here is a channel through which original advantages could have legacy effects in much later periods even though their initial relevance had evaporated.
This paper is based on one cross-section—the Factory Inspectors’ report for 1838. While the results provide considerable insight into the determinants of the location of the cotton industry, obviously, there are some important limitations on what can be inferred especially in the presence of endogenous variables. A valuable next step using panel data will be to analyze the evolution of the industry over the remainder of the nineteenth century as it became even more spatially concentrated and reliant on steam power. It will also be important to investigate comparisons with the location patterns of cotton textiles in other countries during industrialization where persistent spatial concentration in one location was not the case.Footnote 15
Inter alia, this will allow investigation of issues relating to the nature of technical change during and after the Industrial Revolution. The Lancashire agglomeration was central to the long-run success of British cotton textiles which were increasingly spatially concentrated in an area characterized by high wages and cheap coal. This emerging geography intensified the rationale identified by Allen (Reference Allen2009) for technological progress whose factor-saving bias was energy-using and labor-saving. So, an analysis of “directed technical change” in the cotton industry over the course of the nineteenth century would seem to offer an excellent opportunity to explore Allen's hypothesis in greater depth.
Technical Appendix: Second Nature Geography and the Effect of Sunk Costs
The early nineteenth century was a time of dramatic technological change in the cotton industry. Especially steam power was rapidly replacing water power, which should have triggered a relocation of the industry towards places with cheap coal. In this appendix we want to show how in the presence of technological change, sunk costs can delay or even prevent the relocation of production. With their assumption regarding fixed costs, Head and Mayer (Reference Head and Mayer2004) do not take into account that a considerable part of the fixed costs are typically sunk costs in the sense that they have been incurred in the past (such as costs for a building), and they are location-specific so that they cannot be recovered upon exit (Motta and Thisse Reference Motta and Jacques-FrançoisThisse1994). A simple reformulation of equation (5) in the text can capture this idea:
![\[
\begin{array}
Max(Profit) = Max[cm- - M - S] j { m- MP F (fit j cmj (1 Mj FjSij, 1
\end{array}
\](https://static.cambridge.org/binary/version/id/urn:cambridge.org:id:binary:20160927090728666-0634:S0022050714000874:S0022050714000874_eqnA1.gif?pub-status=live)
where Sij is an indicator variable equal to some positive value bounded by 1 whenever the location of an existing mill is evaluated against a new location, and zero otherwise. In this formulation, some fraction of fixed costs will now matter for a firm that considers relocating, even if fixed costs are perfectly equal across locations. The existence of sunk costs will dampen the impact of current or prospective changes in the differences in variable costs and market access between locations and will increase the impact of past differences. To see this, consider a situation with only two possible locations (j= 1,2) at two different points in time (t=0,1) and treating market access as exogenous for simplicity (i.e., each firm is small relative to the local market). Initially (t=0), location 1 is more attractive than location 2, due to lower variable costs (m 1 m 2) ceteris paribus, so that:
![\[
\begin{array}
[cm_2 cm2 MP /minus /f1] mp_2 - f_2
\end{array}
\](https://static.cambridge.org/binary/version/id/urn:cambridge.org:id:binary:20160927090728666-0634:S0022050714000874:S0022050714000874_eqnU1.gif?pub-status=live)
or simply

This will attract a larger share of firms to location 1. Now consider a reversal in variable costs in the next period (t = 1), for example, due to biased technological change that affects relative input prices and variable costs. With this, we have m 1 ≥ m 2 or m 1 = (1 + Δ) m 2. A mill owner who has chosen location 1 in t = 0 will have to evaluate the benefit of moving to the lower cost location 2 against the opportunity cost of moving, which will now depend on the level of sunk costs. Let us define the operating profit as profit net of fixed and sunk cost. Then we can see that the critical value of sunk costs FS*, at which a mill owner is indifferent between relocating and staying, is increasing in the difference in operating costs due to the change in variable costs:

or

or

Put differently, in the presence of positive sunk costs, a higher differential in (current and prospective) operating profits is necessary as an incentive for relocation (see Redding et al. Reference Redding, Sturm and Wolf2011). By the same token, past differences in operating profits can have a more persistent effect because more firms will stay at a location even after earlier cost advantages have disappeared.
 where v is the actual water vapor pressure, in units of millibar. Because the dew point (Td
) decreases by about 1°C for every 5 percent decrease in relative humidity (RH), we can approximate the RH using the following equation from Lawrence (