Introduction
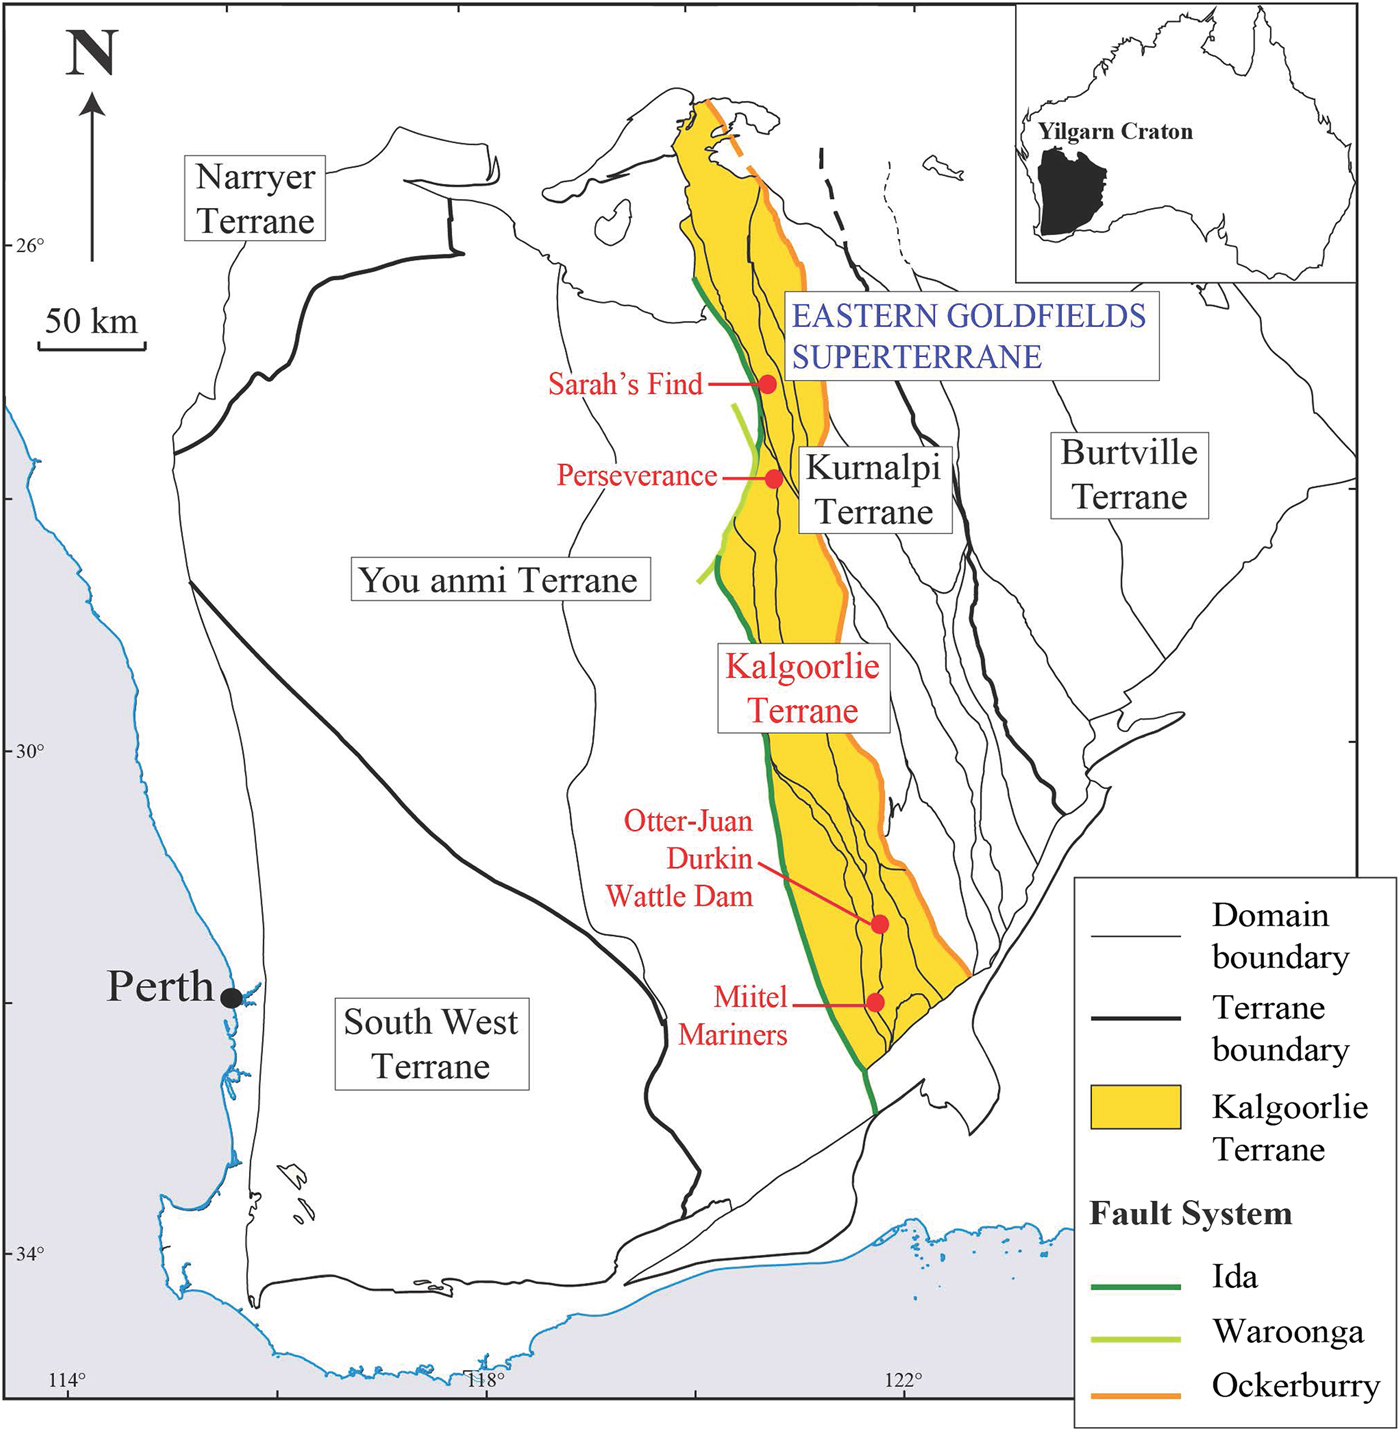
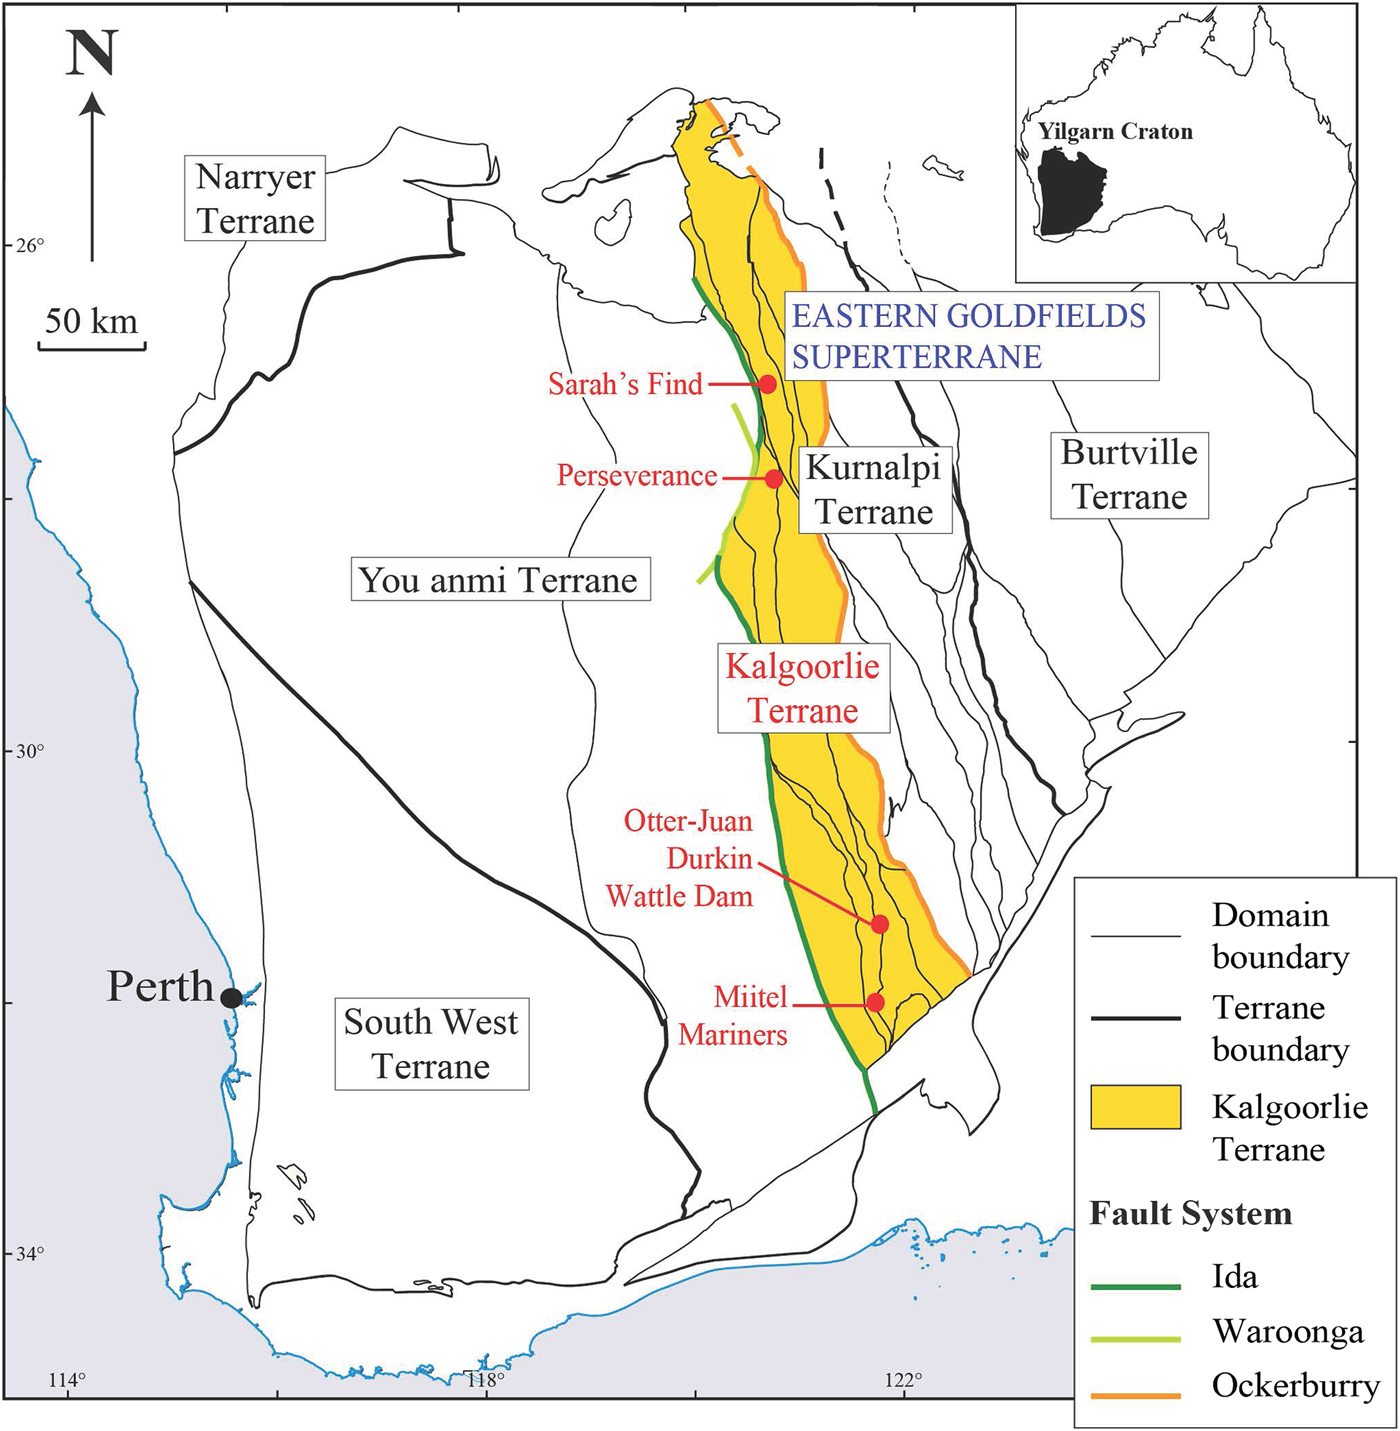
Trace-element composition, specifically precious metal compositions, of certain minerals associated with ore deposits can provide valuable information on their genetic history, and that of the mineralized system they are related to, e.g. PGE contents of oxide and sulfide minerals in Ni sulfide ore systems (Locmelis et al., Reference Locmelis, Fiorentini, Barnes and Pearson2013, Dare et al., Reference Dare, Barnes, Prichard and Fisher2010a,b, Reference Dare, Barnes and Prichard2011; Godel et al., Reference Godel, Gondzalez-Alvarez, Barnes, Barnes, Parker and Day2012). This study presents the results of laser ablation inductively coupled plasma mass spectrometry (LA-ICP-MS) analyses collected on a set of nickel-cobalt arsenides and sulfarsenides of different paragenesis (magmatic vs. hydrothermal), and associated with different types of mineralized systems (gold vs. nickel). In the following discussion we refer to all the arsenide and sulfarsenide minerals studied as ‘arsenides’ for brevity. The trace-element concentrations in platinum-group elements (PGEs), gold and metals of these grains reflect this origin and spatial association. Arsenic-rich minerals, including gersdorffite (NiAsS), nickeline (also called niccolite NiAs), cobaltite (CoAsS) and arsenopyrite (FeAsS) from five different localities within the Kalgoorlie Terrane of the Western Australian Yilgarn Craton were studied (Fig. 1): Two magmatic nickel sulfide deposits that are poor in gold, the Miitel deposit and the Sarah's Find prospect, and that have undergone an episode of As-rich hydrothermal alteration, interpreted as being related to an orogenic gold event that overprinted them (Le Vaillant et al., Reference Le Vaillant, Barnes, Fiorentini, Miller, McCuaig and Muccilli2015, Reference Le Vaillant, Saleem, Barnes, Fiorentini, Miller, Beresford and Perring2016b); one magmatic nickel sulfide deposit that has been overprinted by orogenic As-Au-rich fluids producing economic gold mineralization, the Mariners deposit (Goodgame, Reference Goodgame1997); one magmatic nickel sulfide deposit that has not been affected by As-rich alteration, the Perseverance deposit (Barnes et al., Reference Barnes, Fiorentini, Duuring, Grguric and Perring2011; Diragitch, Reference Diragitch2014); and one gold deposit in ultramafic rocks lacking magmatic sulfides, the Wattle Dam gold deposit (Walshe et al., Reference Walshe, Bath, Cloutier and Hough2014).
Simplified geological map of the Yilgarn Craton showing the location of the case studies, modified from (Cassidy et al., Reference Cassidy, Champion, Krapez, Barley, Brown, Blewett, Groenewald and Tyler2006).
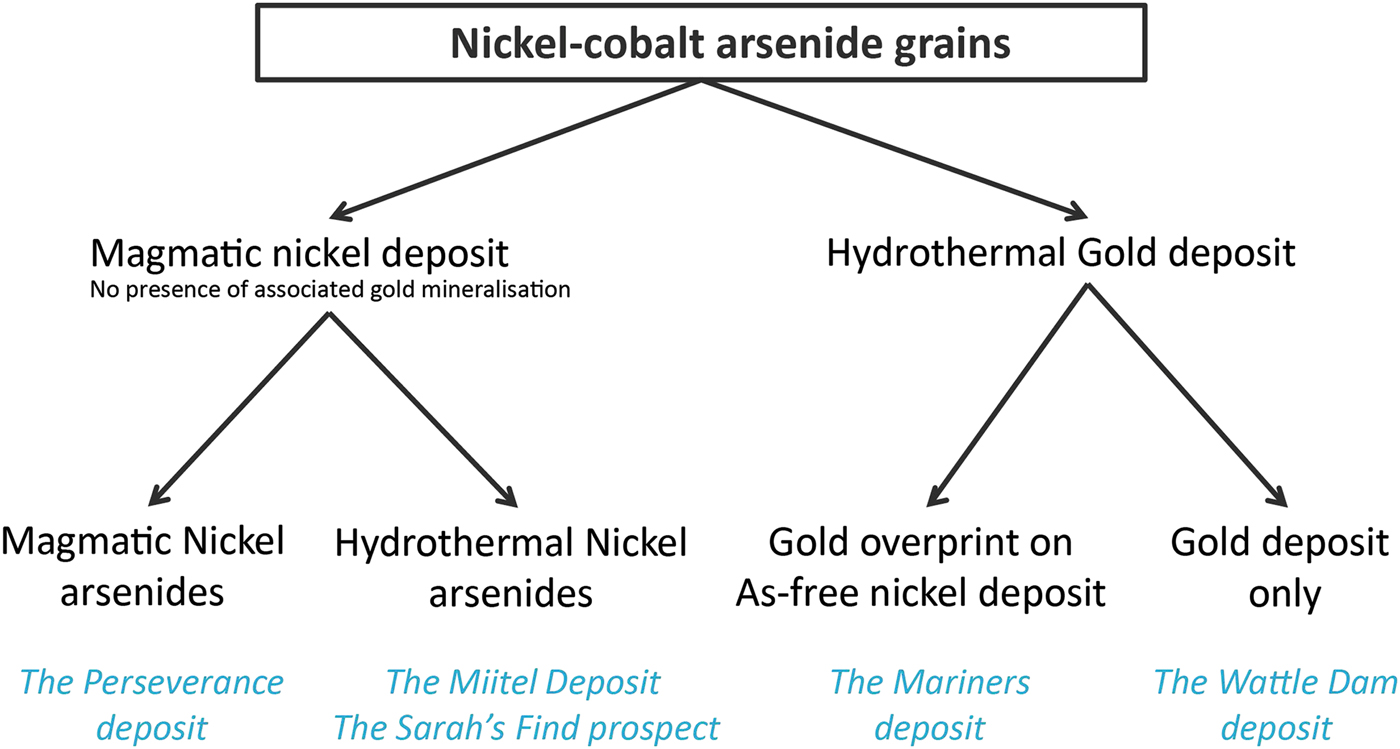
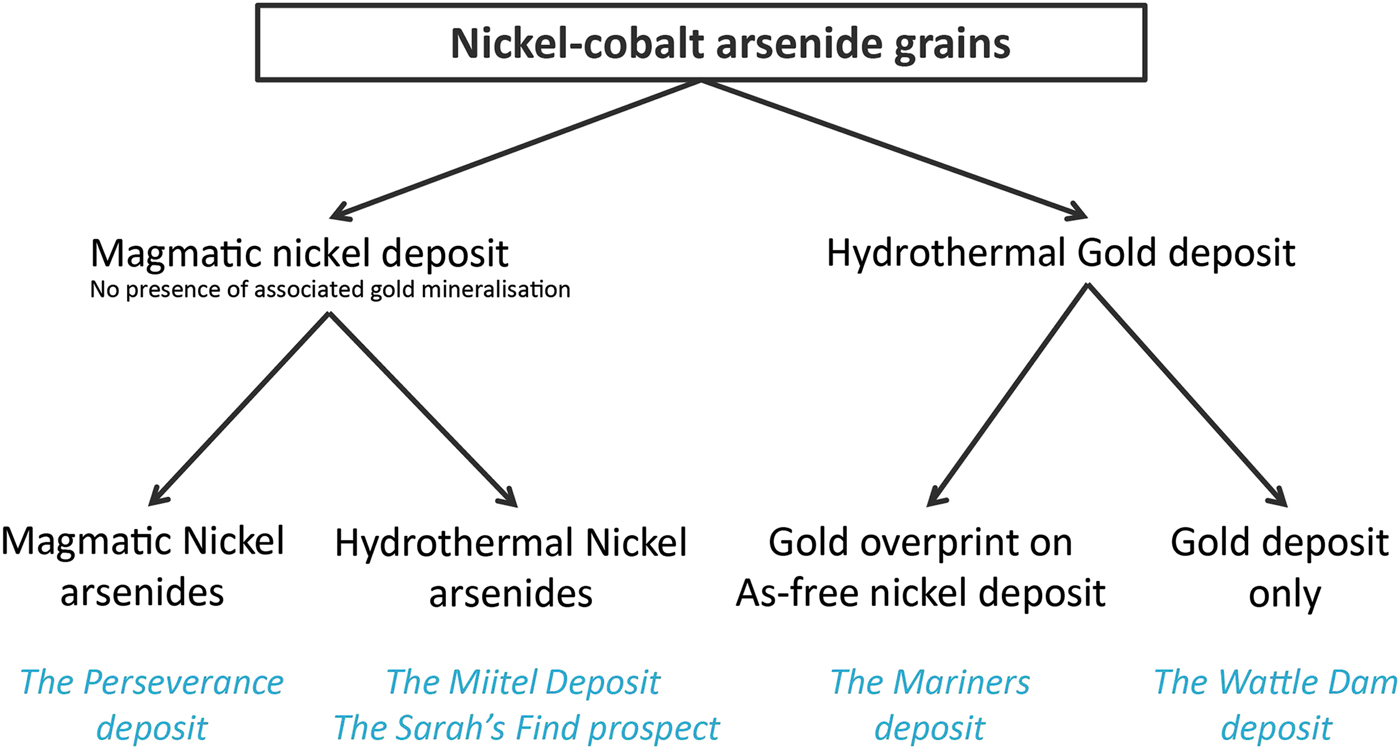
In this study, arsenide occurrences are separated into different categories reflecting their origin and spatial association (Fig. 2). Two different categories are used: (1) magmatic arsenides and (2) hydrothermal arsenides. We use the term (1) magmatic arsenides to define nickel arsenides that crystallize within the nickel massive sulfides upon cooling of the host intrusion or magma flow. Arsenic is an element which is present only in ultra-trace proportions in mafic-ultramafic magmas forming the ore deposits (Helmy et al., Reference Helmy, Ballhaus, Fonseca and Nagel2013b; Canali et al., Reference Canali, Brenan and Sullivan2017), but which is enriched in the crust, particularly in sedimentary units (Ketris and Yudovich, Reference Ketris and Yudovich2009; Samalens et al., Reference Samalens, Barnes and Sawyer2016). Enrichment of the magma in arsenic is produced by thermomechanical erosion of crustal rocks and contamination of the magma upon intrusion or eruption. If arsenic has been added to the magma, and sulfide liquid segregation occurs (the essential necessary step to the genesis of magmatic nickel sulfide mineralization), arsenic will tend to be concentrated in the liquid sulfide droplets, along with the other chalcophile elements (Helmy et al., Reference Helmy, Ballhaus, Wohlgemuth-Ueberwasser, Fonseca and Laurenz2010).
Classification diagram of the different ‘arsenide types’ present within the case studies used for this project.
As the sulfide liquids crystallizes, arsenides will then crystallize alongside the Fe–Ni–Cu sulfide minerals, either as a liquidus phase directly from the melt where As concentrations are exceptionally high (Bai et al., Reference Bai, Barnes and Baker2017), or otherwise as part of late residual assemblages close to the solidus (Helmy et al., Reference Helmy, Ballhaus, Wohlgemuth-Ueberwasser, Fonseca and Laurenz2010), or in some unusual cases from a discrete immiscible arsenide liquid phase (Hanley, 2007b; Godel et al., Reference Godel, Gondzalez-Alvarez, Barnes, Barnes, Parker and Day2012b; Pina et al., Reference Pina, Gervilla, Barnes, Ortega and Lunar2015). We use the term ‘hydrothermal arsenides’ to define arsenides that form by overprinting of the mineralized magmatic system by As-rich hydrothermal fluids. The arsenides in this setting form well after Fe–Ni–Cu sulfides have crystallized and the magmatic system has cooled down, as a result of the interaction between As-rich fluids and solid ores (Le Vaillant et al., Reference Le Vaillant, Barnes, Fiorentini, Miller, McCuaig and Muccilli2015, Reference Le Vaillant, Fiorentini and Barnes2016a,Reference Le Vaillant, Saleem, Barnes, Fiorentini, Miller, Beresford and Perringb). In addition, we also present data on ‘hydrothermal’ arsenides formed in non-magmatic Au-bearing hydrothermal vein systems. For the purpose of this study, we compiled a set of representative samples for these two types of arsenides (magmatic vs. hydrothermal), collected at different localities displaying the presence of either nickel sulfide mineralization, gold mineralization or in one case both (Fig. 2).
Background
Occurrence of nickel arsenides
Magmatic arsenides that evidently crystallized directly from sulfide or associated arsenide melt have been described in the following studies: at the Carratrace and the Arroyo de la Cueva deposits in Spain (Hem et al., Reference Hem, Makovicky and Gervilla2001), Beni Bousera in Morocco (Gervilla et al., Reference Gervilla, Leblanc, Torres-Ruiz and Hach-Ali1996; Pina et al., Reference Pina, Gervilla, Barnes, Ortega and Lunar2013), the Ni-Cu deposit at Las Aguilas in Argentina (Gervilla et al., Reference Gervilla, Sanchez-Anguita, Acevedo, Hach-Ali and Paniagua1997), Serrania de Ronda in Spain (Pina et al., Reference Pina, Gervilla, Barnes, Ortega and Lunar2015), the Copper Cliff North Area, Dundonald Beach South and Creighton Ni-Cu-PGE deposits in Canada (Szentpeteri et al., Reference Szentpeteri, Watkinson, Molnar and Jones2002; Hanley, Reference Hanley2007; Dare et al., Reference Dare, Barnes, Prichard and Fisher2010a), and the Rosie nickel prospect and the Spotted Quoll deposits in Western Australia (Godel et al., Reference Godel, Gondzalez-Alvarez, Barnes, Barnes, Parker and Day2012; Prichard et al., Reference Prichard, Fisher, McDonald, Knight, Sharp and Williams2013). Only a small portion of these studies present the results of LA-ICP-MS analyses on arsenides, but the few that do all agree that magmatic Ni-Co arsenides contain elevated concentrations of PGEs. Arsenides acted as collectors for the PGEs, particularly Pd and Pt, with an average concentration of 257 ppm Pd, 536 ppm Pt at the Rosie prospect (Western Australia, Godel et al. (Reference Godel, Gondzalez-Alvarez, Barnes, Barnes, Parker and Day2012), 234 ppm Pd, 83 ppm Pt at the Spotted Quoll nickel deposit (Western Australia; Prichard et al., Reference Prichard, Fisher, McDonald, Knight, Sharp and Williams2013), and 52 ppm Pd, 167 ppm Pt at the Dundonald Beach nickel deposit, Canada (Hanley, Reference Hanley2007). Gold concentration of these magmatic arsenides vary widely between different deposits, ranging from an average of 0.11 ppm Au at Spotted Quoll (Prichard et al., Reference Prichard, Fisher, McDonald, Knight, Sharp and Williams2013) to 0.708 ppm Au at Rosie (Godel et al., Reference Godel, Gondzalez-Alvarez, Barnes, Barnes, Parker and Day2012).
A few occurrences of nickel arsenides within magmatic nickel sulfide deposits have been interpreted as hydrothermal remobilization of primary, late magmatic arsenide-rich ores, such as the Kylmäkoski Ni–Cu deposit in Finland (Gervilla et al., Reference Gervilla, Papunen, Kojonen and Johanson1998), or the Ni–Cu–PGE sulfide ores of the komatiite-hosted Fortaleza de Minas deposit in Brazil (De Almeida et al., Reference De Almeida, Olivo and de-Carvalho2007). Additionally, a few deposits are interpreted as being entirely the product of As-rich hydrothermal fluids that leached Ni, Co, PGE and sometimes Au from adjacent rocks or massive sulfides and redeposited them as Co–Ni–PGE arsenide ores, such as the Cobalt deposit in Canada (Sampson and Hriskevich, Reference Sampson and Hriskevich1957; Goodz, Reference Goodz1986), the Bou Azzer deposit in Morocco (Leblanc and Fisher, Reference Leblanc and Fisher1990; Ahmed et al., Reference Ahmed, Arai and Ikenne2009), or the Cu–Ni–Co–As (U) mineralization in the Anarak area in central Iran (Bagheri et al., Reference Bagheri, Moore and Alderton2007). Minor Ni arsenides have also been reported from the Avebury hydrothermal Ni deposit in Tasmania, although the As content of this orebody is very low (Keays and Jowitt, Reference Keays and Jowitt2013). No trace-element concentrations have been reported on these purely hydrothermal nickel arsenides.
Arsenide minerals, mainly arsenopyrite, but also Ni-Co arsenides such as cobaltite and nickeline, are often present in gold mineralized systems. However, few studies have looked at their trace-element compositions using LA-ICP-MS. Numerous studies report gold concentrations in arsenopyrite, which vary a lot within as well as between deposits, probably due to complex redistribution processes and to the fact that gold in arsenopyrite, also called ‘invisible gold’ (Cook and Chryssoulis, Reference Cook and Chryssoulis1990), is often present as nanoparticles (<250 nm) with a heterogeneous distribution. A study by Deol et al. (Reference Deol, Deb, Large and Gilbert2012) on arsenopyrites from the Bhukia-jagpura gold prospect in southern Rajasthan, India, reported Au concentrations varying between 6 and 10 ppm Au, and very low Pt values (mostly below detection) with an average of 40 ppb Pt (other PGEs not reported). Another study by Cook et al. (Reference Cook, Ciobanu, Meria, Silcock and Wade2013) on arsenopyrite from a Proterozoic orogenic gold deposit, Tanami gold province, north-central Australia, reported gold values between 8 and 338 ppm Au, but no PGE data were presented. At this stage, there are no available published data on arsenide minerals from settings entirely devoid of economic mineralization.
Platinum-group elements in arsenide minerals
It is well established that the PGEs have strong geochemical affinities for As. Platinum, Ir, Os and Ru have a strong propensity to make PGE-arsenide minerals under a range of conditions, including under some circumstances through direct precipitation from sulfide magmas (Helmy et al., Reference Helmy, Ballhaus, Fonseca, Wirth, Nagel and Tredoux2013a; Canali et al., Reference Canali, Brenan and Sullivan2017; Bai et al., Reference Bai, Barnes and Baker2017) and silicate magmas (Barnes et al., Reference Barnes, Fisher, Godel, Maier, Paterson, Howard, Ryan and Laird2016). The magmatic partitioning of PGEs between solid Fe–Ni sulfide, arsenide melts and sulfide melt has been studied experimentally (Helmy et al., Reference Helmy, Ballhaus, Wohlgemuth-Ueberwasser, Fonseca and Laurenz2010, Reference Helmy, Ballhaus, Fonseca and Nagel2013b). However, their tendency to partition into Ni-Co-Fe arsenides and sulfarsenides is less well known and relatively few experimental datasets are available.
Geology of the study sites
The Perseverance deposit: example of a nickel deposit containing magmatic arsenides
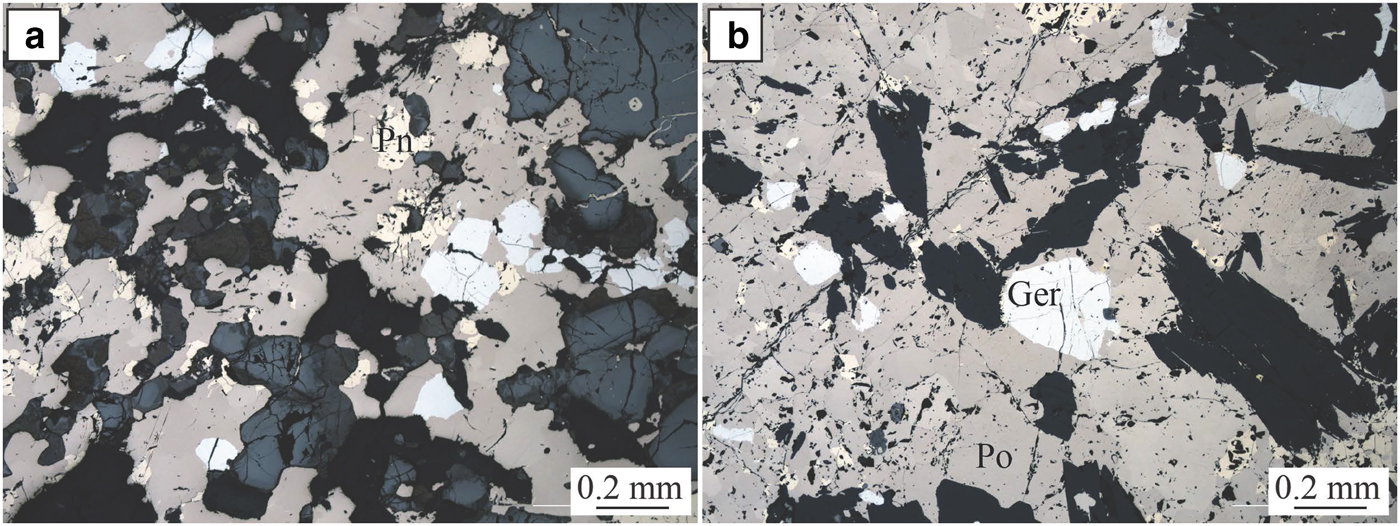
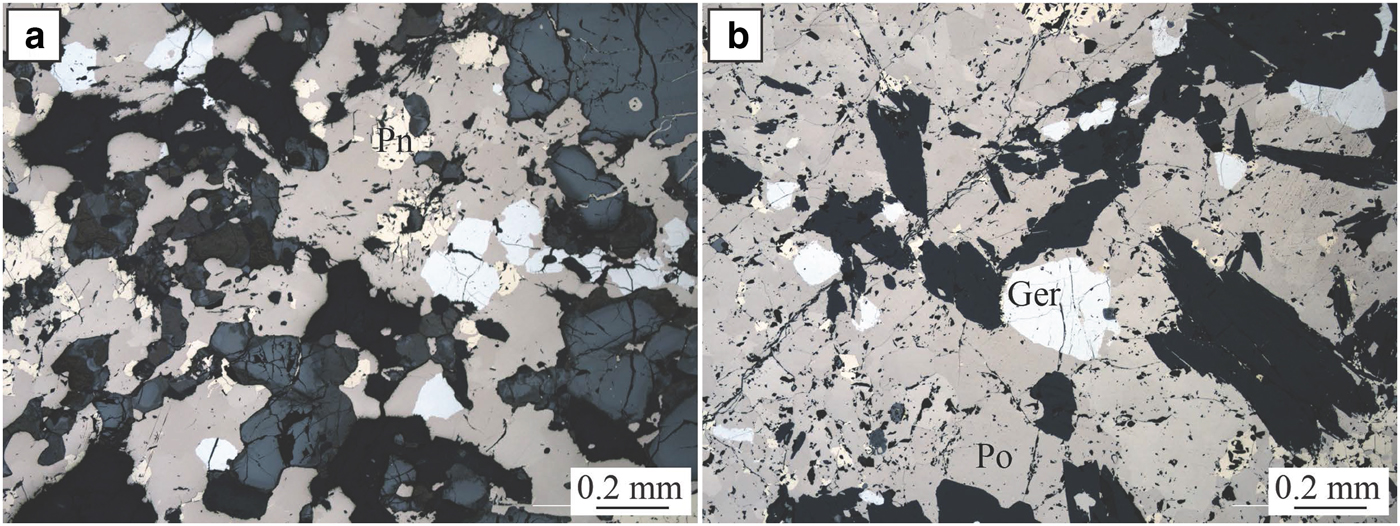
The Perseverance nickel sulfide deposit (Barnes et al., Reference Barnes, Gole and Hill1988a,Reference Barnes, Gole and Hillb, Reference Barnes, Fiorentini, Duuring, Grguric and Perring2011; Perring Reference Perring2015) is located in the Archaean Kalgoorlie Terrane, within the Eastern Goldfields Superterrane (Cassidy et al., Reference Cassidy, Champion, Krapez, Barley, Brown, Blewett, Groenewald and Tyler2006) (Fig. 1). Perseverance, previously known as Agnew (Barnes et al., Reference Barnes, Gole and Hill1988b), is one of the largest known komatiite-hosted nickel-sulfide deposits. It comprises a large tonnage of matrix ore with variably tectonized massive sulfides, representing pre-mining resources of 31,300 kt at 5.9 wt.% Ni, at tenors averaging 9 wt.% Ni (Barnes et al., Reference Barnes, Gole and Hill1988b). The ore is composed of both matrix and disseminated (15–45 vol.%) sulfides with 1–2 wt.% Ni (pyrrhotite, pentlandite, minor chalcopyrite, pyrite and traces of gersdorffite) and massive sulfides with 7.5–9 wt.% Ni (80 vol.% pyrrhotite, <8 vol.% pentlandite and <12 vol.% pyrite, chalcopyrite and magnetite). The longest massive sulfide shoot at Perseverance is the 1A ore shoot, extending as variably mylonitized breccia ore entirely within felsic footwall rocks, up to 100 m north of the disseminated sulfide body. Massive sulfides from the 1A ore shoot are locally enriched in arsenic (Fig. 3). Arsenides within this ore shoot, mainly gersdorffite, were sampled for this study.
Perseverance. Photomicrographs in reflected light of massive sulfides from the Perseverance nickel deposit. Ger = gersdorffite, Pn = pentlandite and Po = pyrrhotite.
The Miitel deposit and the Sarah's Find prospect: magmatic nickel deposits containing hydrothermal arsenides
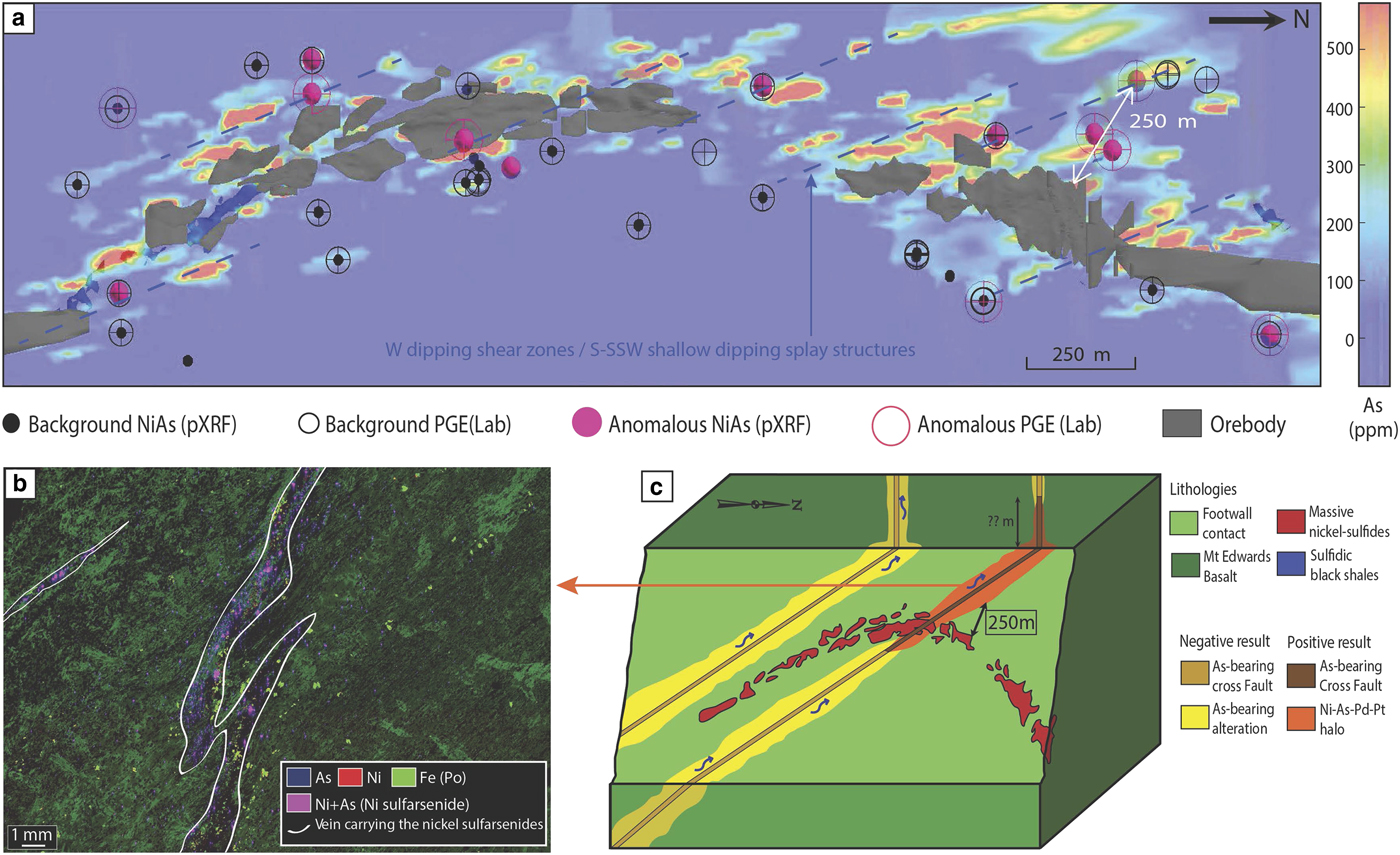
The Miitel deposit is an Archean komatiite-hosted Ni–Cu–PGE deposit located on the eastern flank of the Widgiemooltha Dome (Seat et al., Reference Seat, Stone, Mapleson and Daddow2004) within the Kalgoorlie Terrane (Swager, Reference Swager1997) (Fig. 1). The Miitel ore bodies are located at the basal contact between the Widgiemooltha komatiites and the Mount Edwards basalt; the whole area has undergone upper greenschist- to lower amphibolite-facies metamorphism (McQueen, Reference McQueen1981, Reference McQueen1987; Hayward, Reference Hayward1988; Barnes and Hill, Reference Barnes, Hill, Spry, Marshall and Vokes2000; Le Vaillant et al., Reference Le Vaillant, Barnes, Fiorentini, Miller, McCuaig and Muccilli2015; Moroni et al., Reference Moroni, Caruso, Barnes and Fiorentini2017; Caruso et al., Reference Caruso, Fiorentini, Moroni and Martin2017). Le Vaillant et al. (Reference Le Vaillant, Barnes, Fiorentini, Miller, McCuaig and Muccilli2015) documented a cryptic Ni-As-Pd-Pt geochemical halo around the ore body, formed by the late magmatic or metamorphic circulation of arsenic-rich hydrothermal fluids (Fig. 4). These As-rich fluids were prevalently flowing upwards, mainly along the footwall contact between the komatiitic host rock and the footwall basalt, and along late SSW shallow-dipping cross-cutting splay structures. These hydrothermal fluids collected Ni and PGEs, mainly Pd and Pt, from the massive nickel sulfides, transported them, and re-deposited them within mm to cm wide quartz and/or carbonate veins close to the footwall contact.
Summary of results from the study of the Miitel deposit, modified from Le Vaillant et al. (2015). (a) Perspective view from gOcad® of a long section through the 3D model of the Miitel deposit. This image combines: (1) distribution of the arsenic in mg/g at the contact between the basalt and the komatiites (model derived using Leapfrog®); (2) location of pXRF analyses showing anomalously high Ni and As concentrations; and (3) location of laboratory PGE analyses highlighting samples enriched in PGE. (b) False colour element concentration map (As blue, Ni red, Fe green), of samples DRD918-358.6 which contains nickel arsenides within small hydrothermal quartz and/or carbonate veins cross cutting the Mount Edwards footwall basalt. This map was produced using the data collected with the Maia detector array on the X-ray fluorescence microscopy beamline, at the Australian Synchrotron in Melbourne. (c) 3D block model of the Miitel system showing the possible application of the Ni–As–Pd geochemical halo to exploration targeting for nickel sulfides.
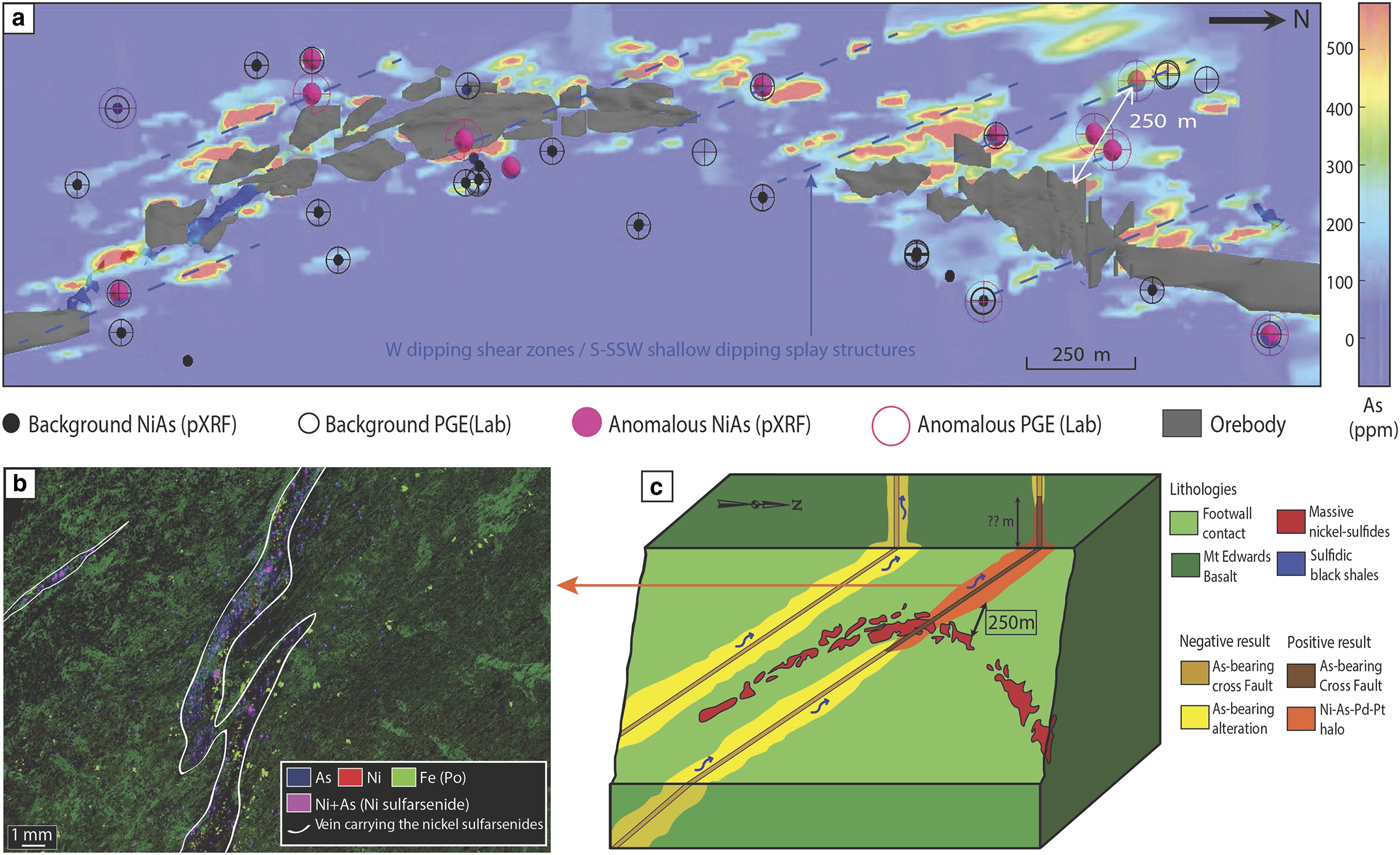
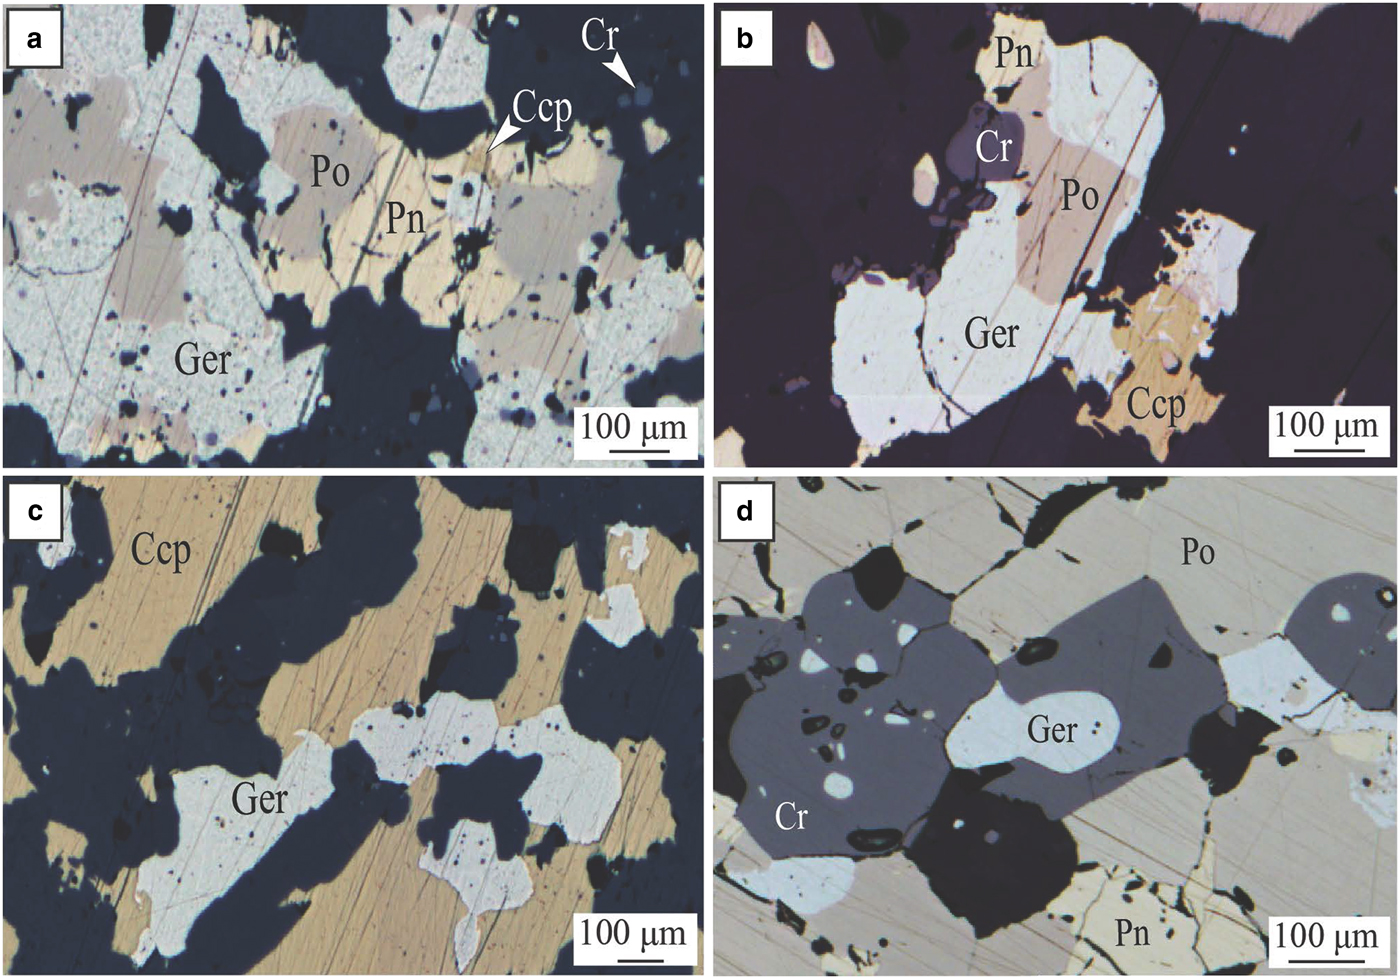
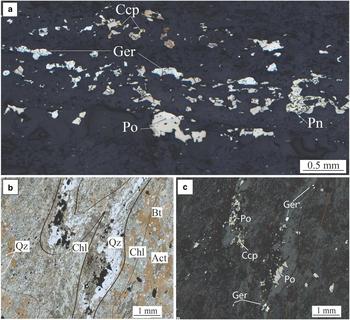
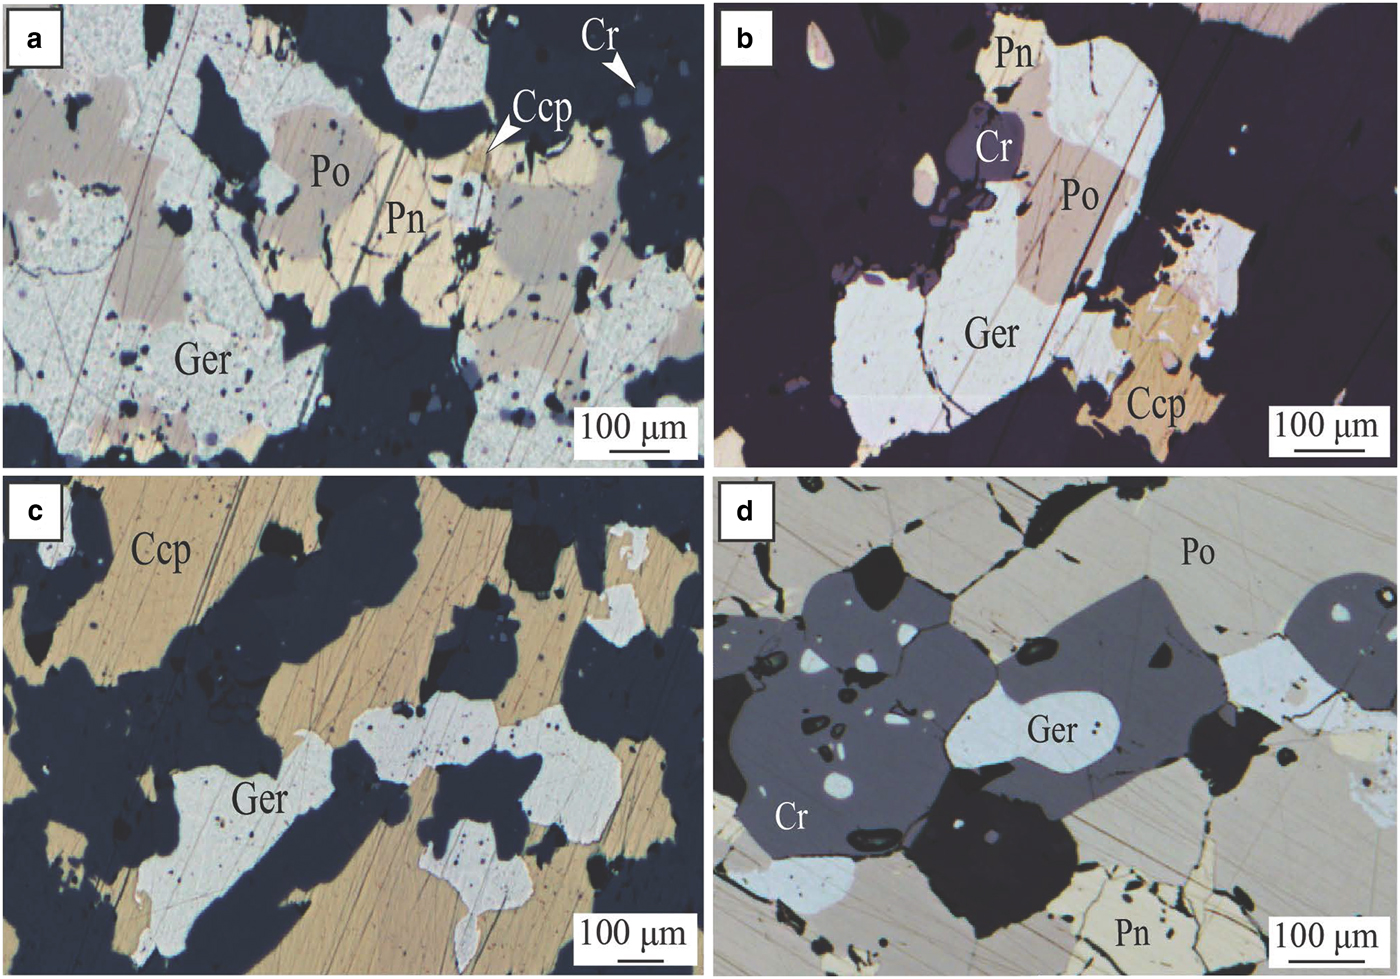
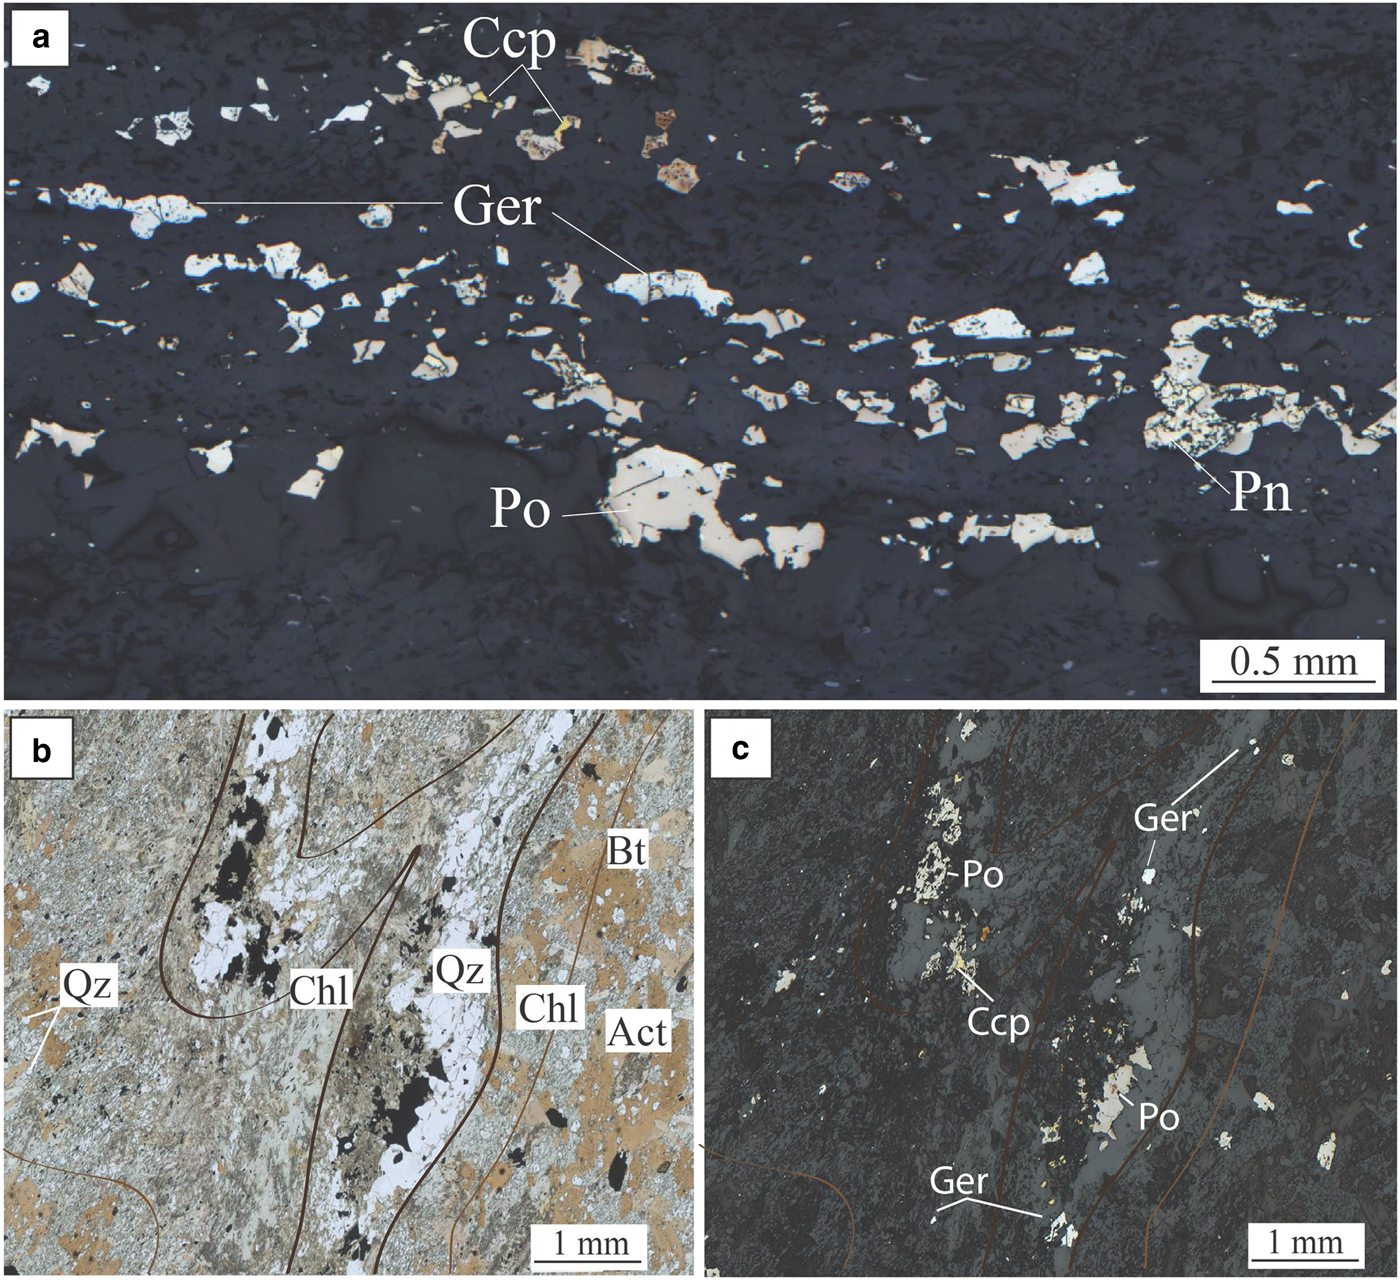
The geochemical halo produced by the hydrothermal circulation of As-rich fluids extends along the basal contact at least 250 m away from the ore. In addition, it is inferred that the larger spread of As-rich metasomatism in rocks surrounding the deposit (As > 100 ppm in whole-rock data), especially along the splay structures outside the limit of drilling availability, could reflect an even wider Ni–As–PGE halo. At Miitel, arsenic seems to have played the critical role of a ligand in remobilizing Ni and PGEs and redepositing them as nickel arsenides within a geochemical halo (Le Vaillant et al., Reference Le Vaillant, Barnes, Fiorentini, Miller, McCuaig and Muccilli2015). These late, arsenic-rich fluids are commonly related to orogenic gold events (Eilu and Groves, Reference Eilu and Groves2001). The As-rich fluids at Miitel produced two distinct modes of occurrence of arsenides: (1) gersdorffite crystallized in situ by local alteration of the massive sulfides (Fig. 5); and (2) gersdorffite that precipitated in small quartz-carbonate veins away from the massive sulfides (Fig. 6) (remobilization of the metals and PGE from the massive sulfides into the hydrothermal fluids). Both types were analysed by LA-ICP-MS within this study.
Miitel. Photomicrographs showing arsenides present within the massive sulfides due to alteration by As-rich hydrothermal fluids. (a), (b) and (c) photomicrographs in reflected light of sample DRD738-371.44, area of the massive sulfides enriched in chalcopyrite and gersdorffite; embayment of gersdorffite in chalcopyrite and pyrrhotite (c), intergrain infill (a) and intergrain infill, mantling and breakdown of pyrrhotite grains into gersdorffite (b). (d) Photomicrographs in reflected light of sample DRD738-371.51, massive sulfides enriched in gersdorffite. Ccp = chalcopyrite, Cr = chromite, Ger = gersdorffite, Pn = pentlandite and Po = pyrrhotite. Adapted from Le Vaillant et al., Reference Le Vaillant, Barnes, Fiorentini, Miller, McCuaig and Muccilli2015.
Miitel. Photomicrographs showing hydrothermal arsenides in the hydrothermal haloe. (a) Photomicrograph in reflected light of sample DRD738-366.23, (b) and (c) photomicrographs in transmitted and reflected light of sample DRD912-239.5. Photos show the presence of quartz veins cross cutting the Mount Edwards basal footwall assemblage of actinolite/tremolite +/− biotite, and containing nickel arsenides (gersdorffite) with pyrrhotite and minor chalcopyrite, associated with green hornblende, cross cutting the Mt Edward basalt. Act = actinolite, Bt = biotite, Ccp = chalcopyrite, Chl = chlorite, Ger = gersdorffite, Pn = pentlandite, Po = pyrrhotite and Qz = quartz. Adapted from Le Vaillant et al. (2015).
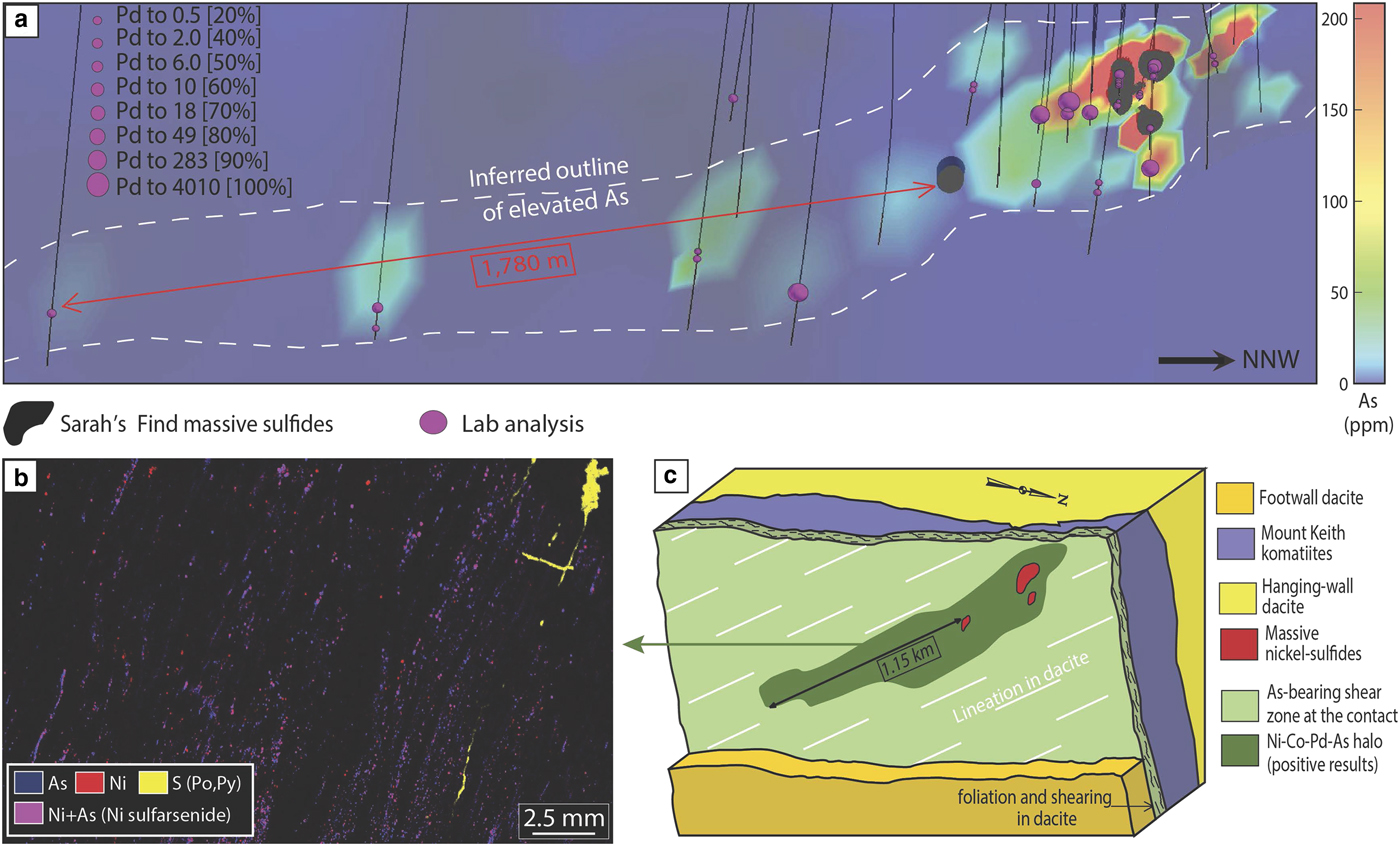
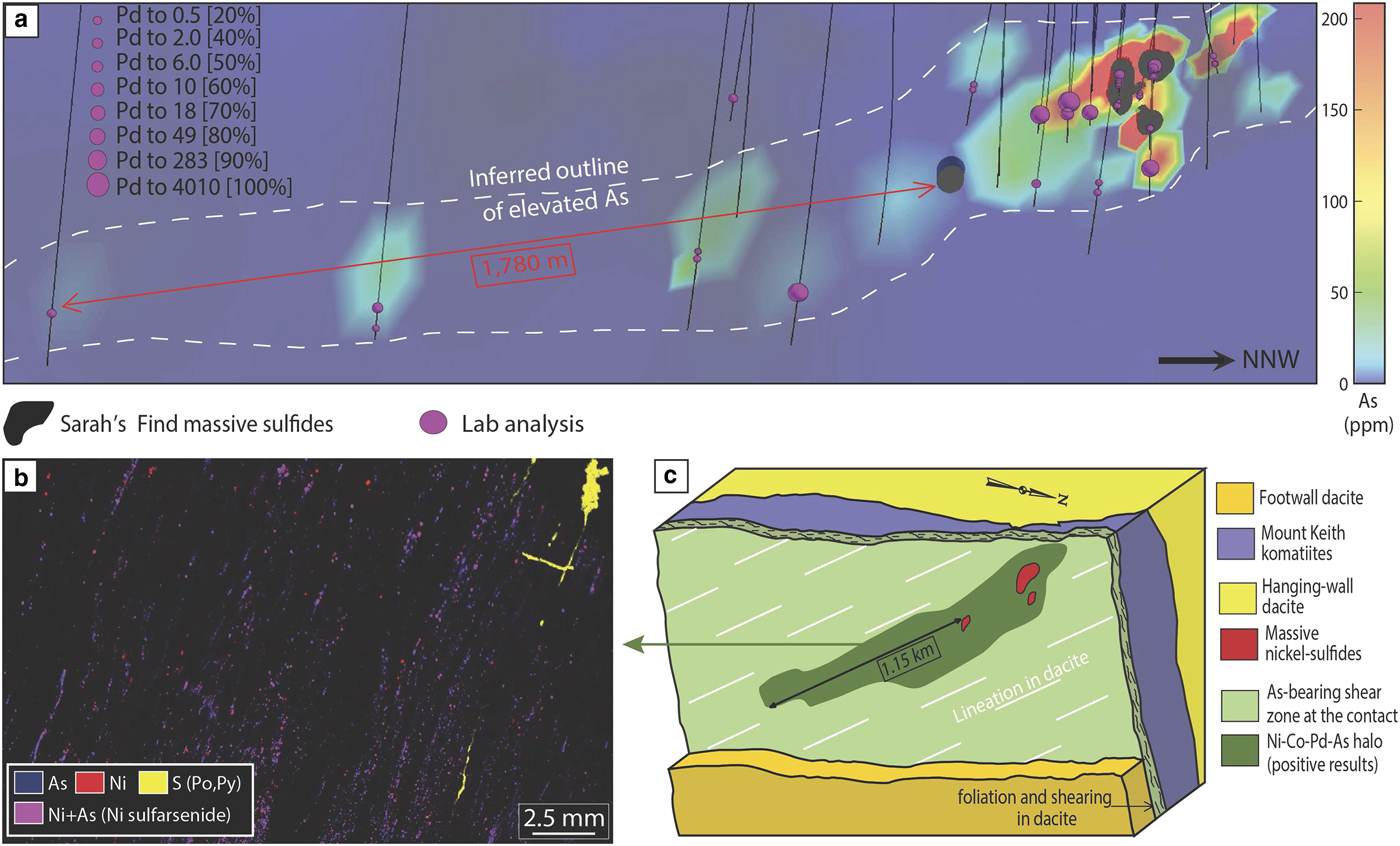
The Sarah's Find prospect is located 4.5 km north of the Mount Keith deposit, in the Agnew-Wiluna greenstone belt (Fiorentini et al., Reference Fiorentini, Rosengren, Beresford, Grguric and Barley2007) (Fig. 1). It is composed of very small lenses or stringers of massive sulfides at the basal contact between the Mount Keith komatiite and the Mount Keith dacite footwall. At Sarah's Find, a Ni–Co–Pd–As geochemical halo was also observed around the massive sulfides (Le Vaillant et al., Reference Le Vaillant, Saleem, Barnes, Fiorentini, Miller, Beresford and Perring2016b), as shown in Fig. 7. This halo is interpreted as the result of combined physical (solid state) and hydrothermal remobilization of Ni, Co and PGEs (Pd, Pt) from the massive sulfides. Physical remobilization, in the form of arsenide minerals smeared along shear planes within a prominent mineral lineation, is observed up to 100–150 m away from the massive sulfides, within the footwall dacite, along the contact with the komatiitic host rock (Mount Keith Ultramafic Unit), parallel to the direction of shearing. Nickel, Co and PGEs (mainly Pd and to a lesser degree Pt) are also interpreted as being hydrothermally remobilized by syn-deformation As-rich hydrothermal fluids, and re-deposited in an even larger halo than the one produced by physical remobilization, prevalently along the direction of shearing. These As-rich fluids collected Ni, Co and Pd from the Sarah's Find massive sulfides and re-deposited them as nickel sulfarsenides within the sheared footwall dacite, along the dominant NNW striking foliation, creating this geochemical halo extending along the direction of shearing up to 1780 m away from the massive sulfides.
Summary of results from the study of hydrothermal haloes around the Sarah's Find deposit, modified from Le Vaillant et al. (2016b). (a) 3D visualization of concentrations in Pd of all analysed samples, combined with a colour representation of the arsenic concentrations along the footwall contact between the Mount Keith komatiites and the Mount Keith dacite. (b) micro-XRF map of one of the sample containing nickel arsenides within the foliation in the dacite footwall. (c) Interpretative block model of the geochemical halo observed around the Sarah's Find ore body. Adapted from Le Vaillant et al. (2016a).
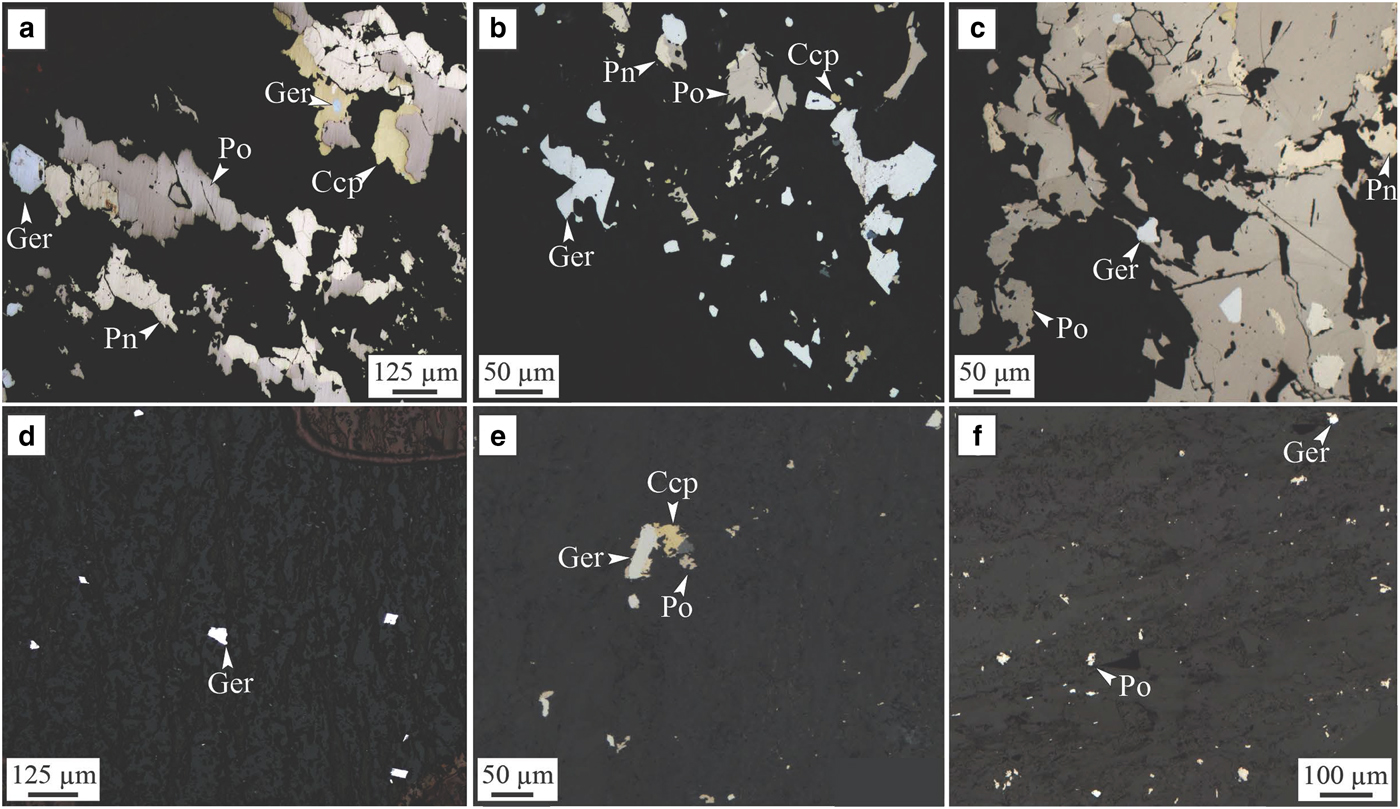
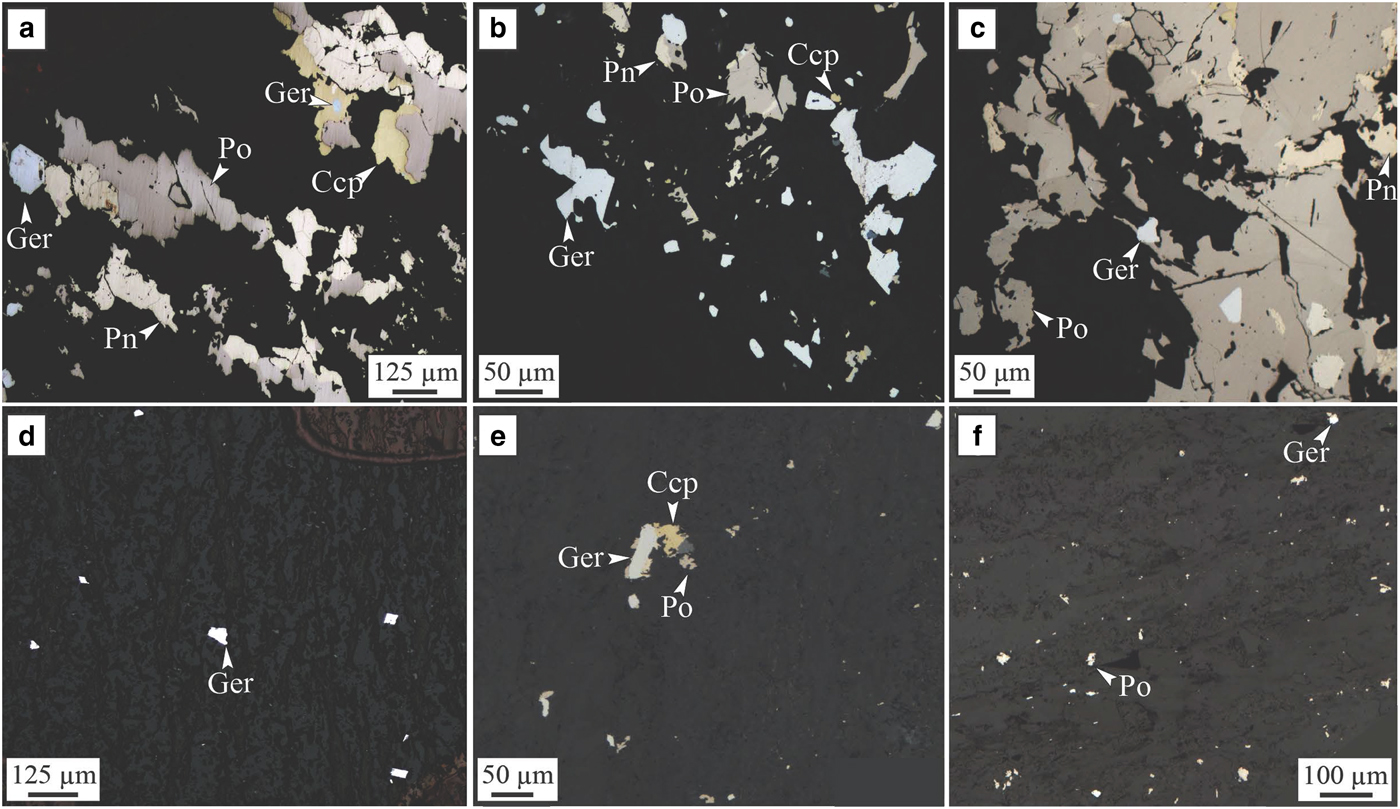
Two types of nickel arsenides associated with this physical and hydrothermal halo were observed. Type (1) is interpreted as forming by purely hydrothermal remobilization of Ni–Co–Pt–Pd from the massive sulfides by As-rich fluids re-depositing them as Co-rich gersdorffite (NiAsS) within the foliation both within the ultramafic host rock and within the dacite footwall (Fig. 8d,e,f). Type (2) is composed of Ni-rich gersdorffites formed by hydrothermal alteration of the mechanically sheared sulfides by As-rich hydrothermal fluids. The trace-element compositions of both types of arsenides were measured as part of this study.
Sarah's Find. Photomicrograph in reflected light of samples from the Sarah's Find nickel prospect. (a, b and c) show the assemblage present in area of the mineralization altered by As-rich fluids or where mechanically remobilized sulfides were altered by As-rich hydrothermal fluids (‘Type 2’); (d, e and f) show the presence of hydrothermal arsenide grains (‘Type 1’) within the foliation of the dacite footwall, forming a halo around the mineralization. (a) Sample MKTD19-281A; (b) sample MKTD506-273A; (c) sample MKTD506-273B; (d) sample MKTD506-273C; (e) sample MKTD23-303A; and (f) sample MKTD23-303C. Ccp = chalcopyrite, Ger = gersdorffite, Pn = pentlandite and Po = pyrrhotite. From Le Vaillant et al. (Reference Le Vaillant, Saleem, Barnes, Fiorentini, Miller, Beresford and Perring2016b).
The Wattle Dam gold deposit: Ni-poor hydrothermal gold deposit
The Wattle Dam orogenic lode gold deposit is located ~25 km south-west of Kambalda (Fig. 1) and occurs within the >250 Moz Au Kalgoorlie Terrane (Goldfarb et al., Reference Goldfarb, Baker, Dube, Groves, Hart, Gosselin, Hedenquist, Thompson, Goldfarb and Richards2005) along the NNW-striking Spargoville Shear. The Wattle Dam deposit is located within the fault bounded Hampton Komatiite from the Coolgardie Domain. The komatiite dips sub-vertically and is locally intruded by granitoids to the east and fault bound by basalts high in magnesium and meta-sediments to the west. The main gold shoot plunges steeply towards the north (~70°) and is predominantly hosted by intense biotite-amphibole altered komatiite with thin (1 m) interflow shale that occurs within the main lode (Hutchison, Reference Hutchison2011). Mineralization is considered to have formed at ~2650 to 2645 Ma.
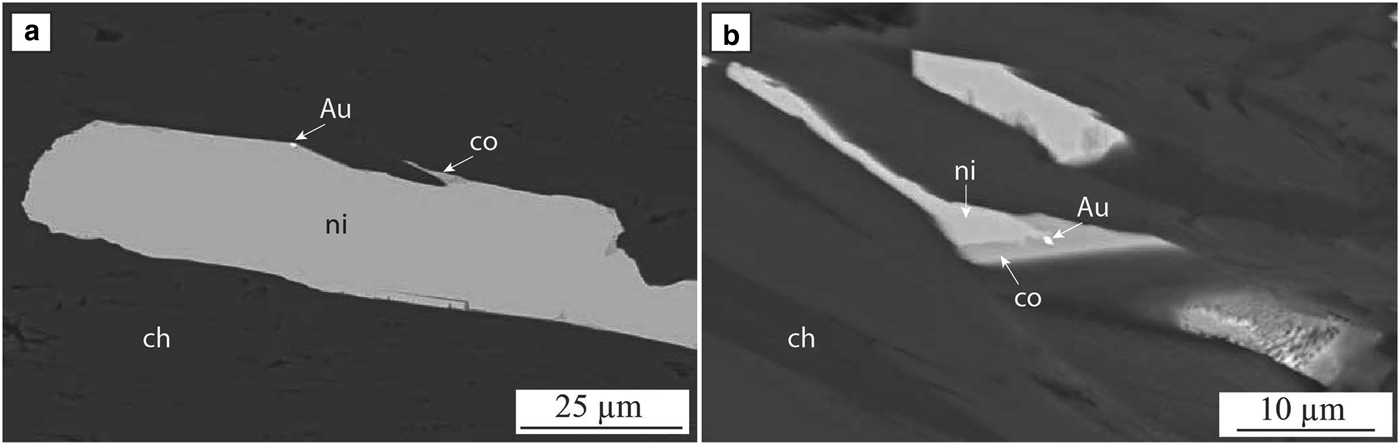
The main lode is a high-grade (average 20 g/t Au) body that is <50 metres in strike and 12 metres in horizontal width. It extends to a depth of >300 metres. Veins of gold cross-cut biotite-amphibole altered and deformed komatiites and interflow shale. Gold also occurs as nuggets up to cm size within the biotite-amphibole assemblage as well as in carbonate veins (Hutchison, Reference Hutchison2011; Cloutier et al., Reference Cloutier, Walshe, Hough and Bath2011; Reference Cloutier, Walshe, Hough, Bath and Hutchison2012) and as inclusions in arsenides near the main lode (Fig. 9). Arsenides with gold inclusions are used here in this study on trace-element composition.
Wattle Dam. Back-scatter electron image of the arsenides observed at the Wattle Dam gold deposit. (a) nickeline, chlorite, cobaltite and gold in altered komatiite ~100 m away from the main lode; (b) nickeline, chlorite, cobaltite and gold overprinting amphibole in altered komatiite ~50 m away from the main lode. Adapted from Walshe et al. (Reference Walshe, Bath, Cloutier and Hough2014).

Details on the various alteration stages and associated paragenesis are presented in Walshe et al. (Reference Walshe, Bath, Cloutier and Hough2014). They describe three main stages of metasomatism: stage 1 biotite-amphibole alteration, which is cross cut by stage 2 alteration, which is divided into three sub-stages. One of these (2c) is characterized by the presence of patches/veins of calcite – dolomite – pyrrhotite – pentlandite – chalcopyrite – chlorite – gold ± ilmenite ± cobaltite ± biotite. Gold occurs in the core of the veins developed in this sub-stage along with pyrrhotite, pentlandite and cobaltite (Fig. 9). Within sub-stage 2c, Mn-rich (up to 1.5 wt.%) calcite cross-cuts euhedral to subhedral Mn-poor calcite blades; cobaltite and gold can occur in these Mn-rich calcite fractures.
Stage 2c arsenides (arsenopyrite, cobaltite, nickeline, maucherite ± gersdorffite) are up to several hundred micrometres in size and occur as clots surrounding amphiboles in chlorite-tremolite – carbonate altered komatiites within 100 m of the main lode. Stage 2c nickeline is rimmed by cobaltite (Fig. 9a) and/or gersdorffite. In a number of nickeline-rich samples, gold was identified as inclusions in cobaltite, which occurs along the margin of nickeline (Fig. 9a). Stage 2c gold was also identified along the margins of nickeline (Fig. 9b). The occurrence of gold inclusions in cobaltite and nickeline indicates a link between the timing of gold mineralization and arsenides at the Wattle Dam deposit. Graphite was also observed associated with arsenides. The presence of cobaltite or arsenopyrite in graphite with quartz and chlorite indicates that arsenides formed under reduced conditions.
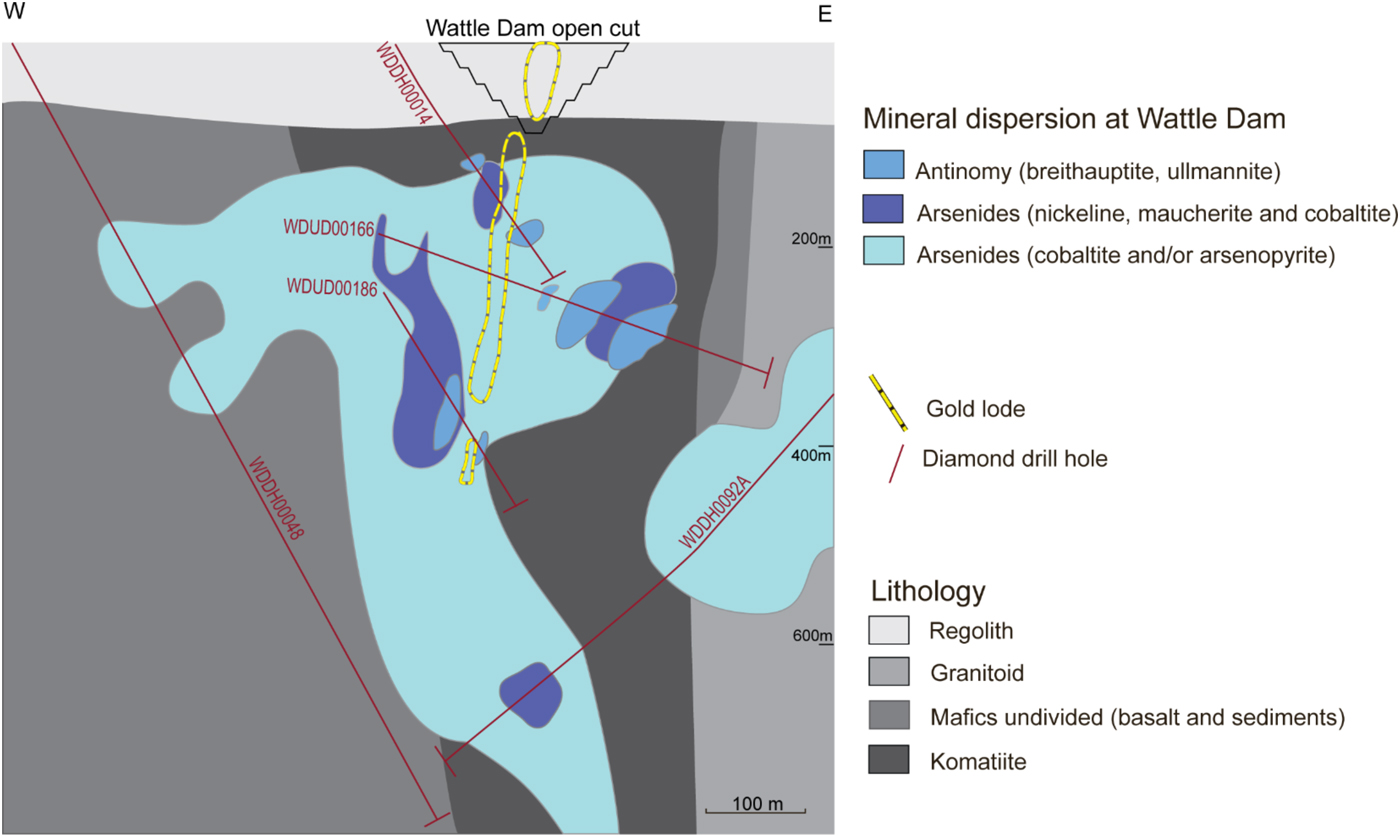
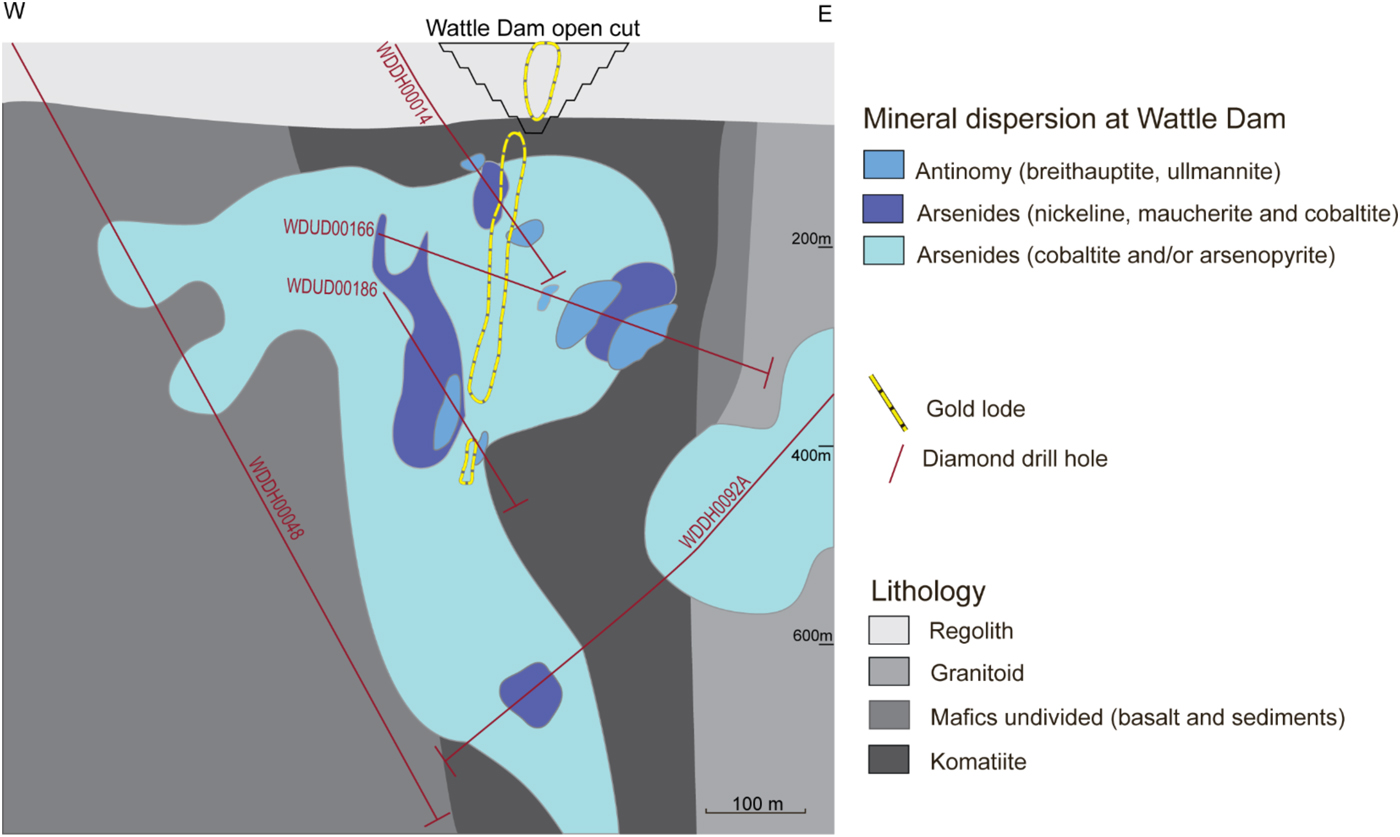
At Wattle Dam, arsenides are distributed widely and can be found in komatiites near the main lode, and in basaltic rocks up to 400 m away from the main lode. An arsenide zone appears to extend laterally in the east and west direction away from the mineralized lode and beneath the main lode (Fig. 10).
Cross-section of alteration domains from the Wattle Dam deposit. The cross-section shows the location of the main lode. Alteration zones are based on the distribution of indicator minerals along drill holes that are shown in the illustration. Figure from Walshe et al. (Reference Walshe, Bath, Cloutier and Hough2014).
The Mariners deposit: a magmatic nickel sulfide deposit with overprinting gold mineralization
The Mariners nickel deposit is, like the Miitel deposit, an Archean komatiite-hosted Ni–Cu–PGE deposit located on the eastern flank of the Widgiemooltha Dome (Seat et al., Reference Seat, Stone, Mapleson and Daddow2004) within the Kalgoorlie Terrane (Swager, Reference Swager1997), ~4 km south of Miitel (Fig. 1). Ore bodies are also located at the basal contact between the Widgiemooltha komatiites and the Mount Edwards basalt. One of the characteristics of the Mariners deposit is its unusually high concentration in arsenic and gold.
The geology of the Mariners deposit is described by Goodgame (Reference Goodgame1997): the primary ore trough plunges for at least 750 m NE at ~50o along the north-south striking bedding contact that dips 35–70oE. The trough is filled with mainly high-magnesium komatiitic olivine cumulates up to 100 m thick. The cumulates have been heavily altered to talc-dolomite-magnesite-anthophyllite-chlorite assemblages indicating substantial carbonate addition. Peak metamorphism is indicated by biotite-actinolite assemblages in mafic rocks along shears, and by tremolite-anthophyllite-talc-dolomite-bearing assemblages in ultramafic rocks. Retrograde alteration along D3 shears is represented by the replacement of pentlandite ((Fe,Ni)9S8) by arsenic minerals, gersdorffite (NiAsS) and nickeline (NiAs), as well as replacement of biotite by quartz, plagioclase, carbonate and chlorite.
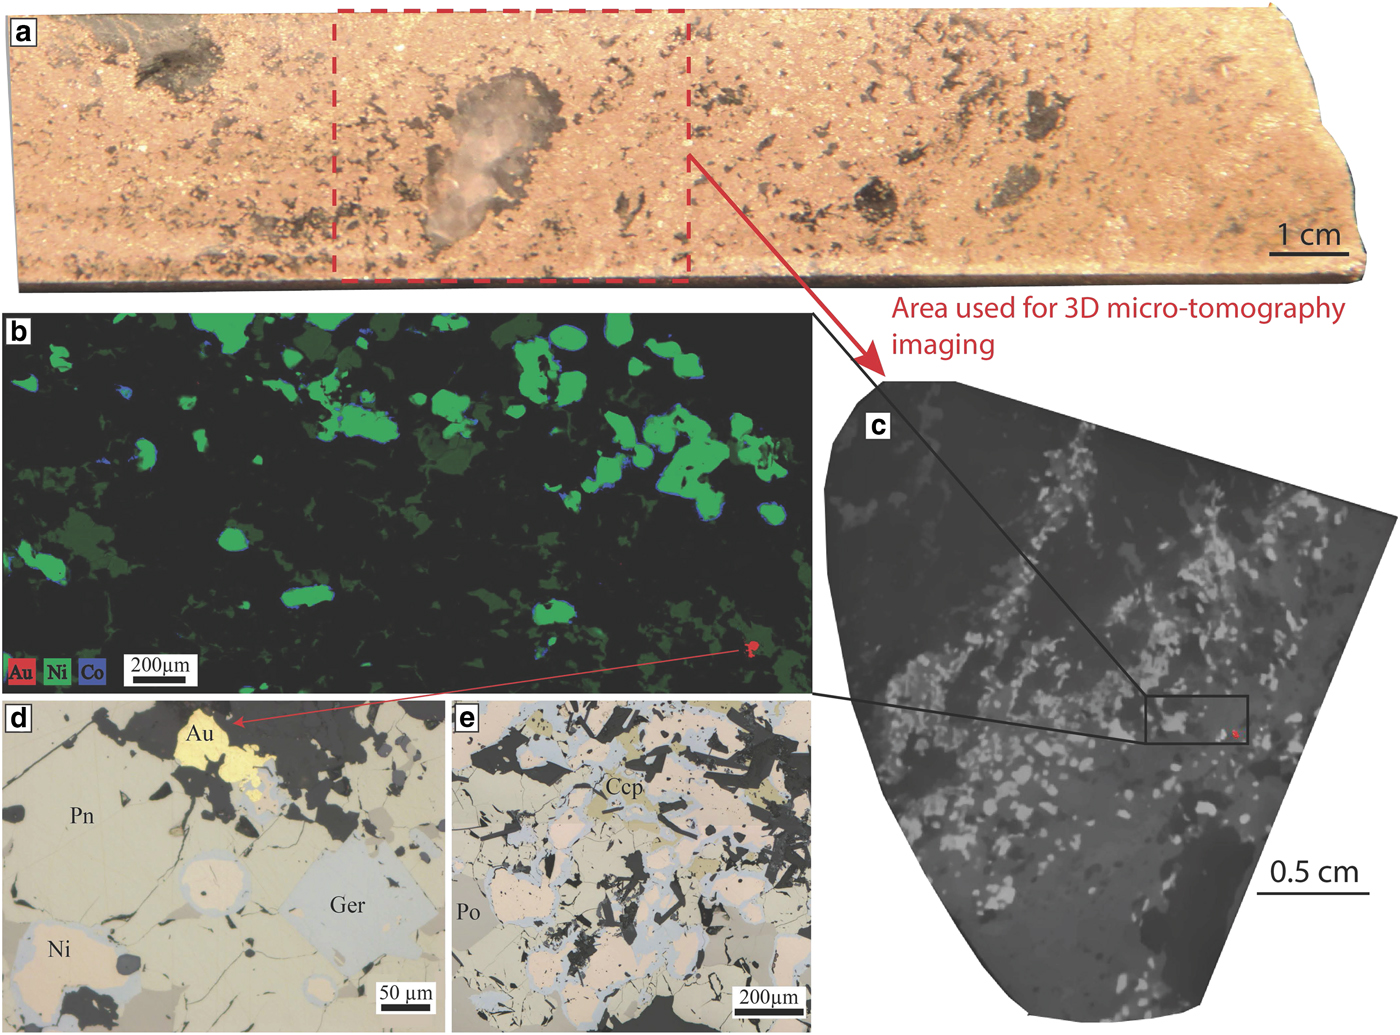
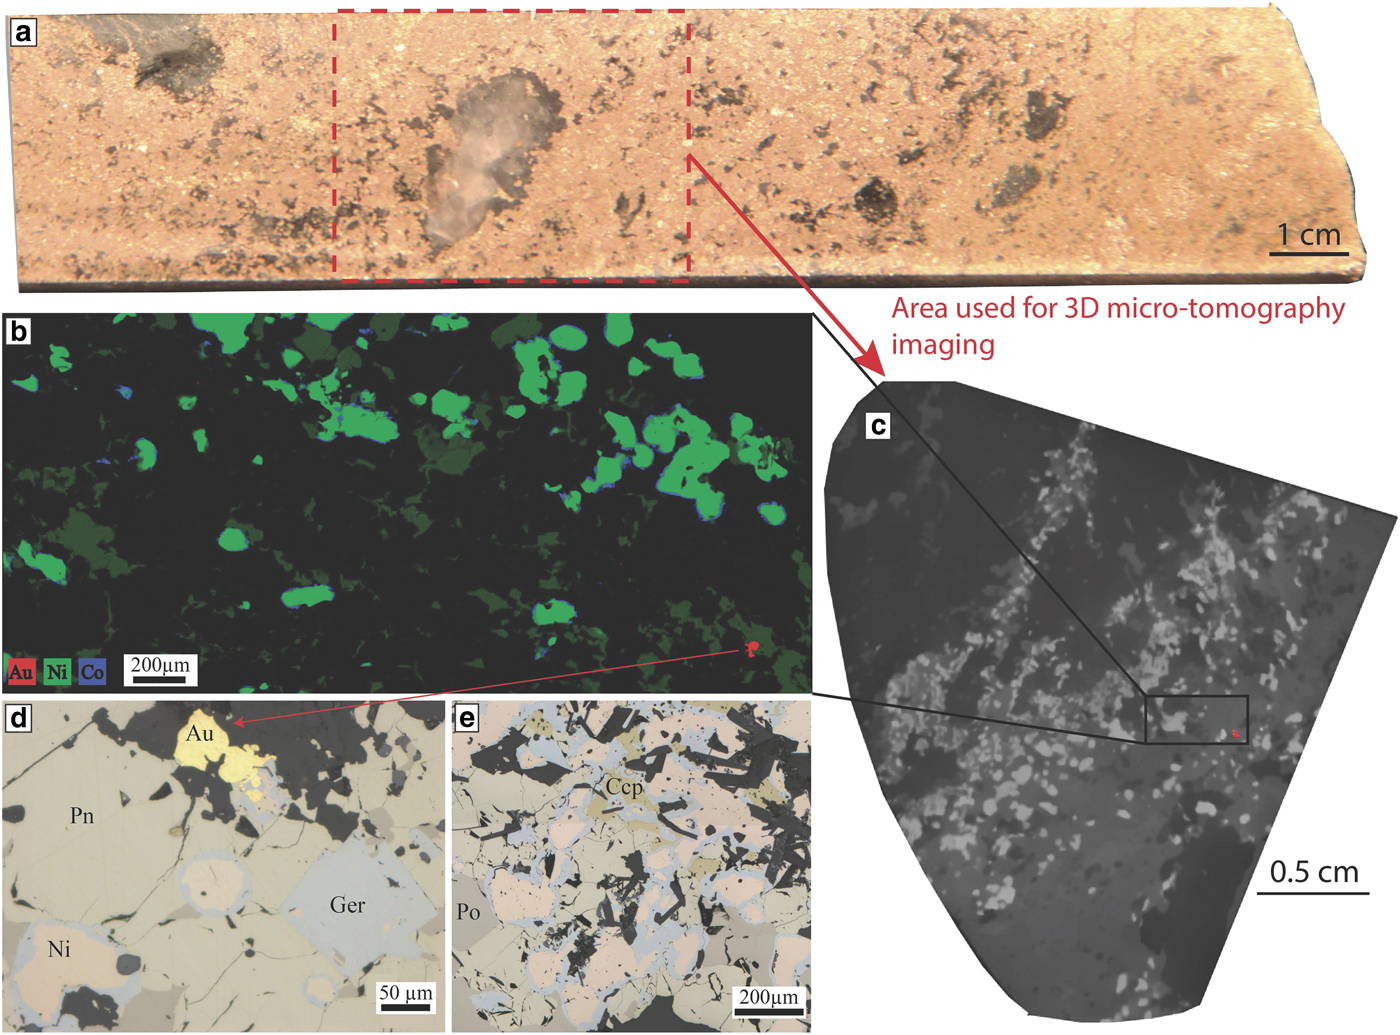
This replacement by Ni arsenides is accompanied by enrichment in Au concentrations of the sulfides. Gold lodes are concentrated along D3 shear zones cross-cutting the magmatic nickel sulfides. In these areas of the ore body, arsenides are present in high concentrations. The sample used for our study was collected in one of these areas, in drill hole MRDH0230 at 414.07 m depth. This interval of the drill hole is particularly enriched in As and Au: 11.85% Ni, 6150 ppb Au and 4.58% As (Fig. 11a). Arsenides present within the sample display a characteristic zoning with a core composed of nickeline and a rim composed of gersdorffite (Fig. 11b,d,e). Both cores and rims were analysed by LA-ICP-MS in this study.
Mariners. Nickel arsenides observed within the massive sulfides of the Mariners deposit. (a) Drill core photo of the sample used for this study, in red is the outline of the part of the sample that was used to collect a 3D micro-CT scan image. (b) Three elemental map showing the Ni-Co zoning of the arsenides at Mariners with a Ni-rich core and a Co-Fe rich rim. A gold grain is also visible in red. This map was produced using the data collected with either the Maia detector array on the X-ray fluorescence microscopy beamline, at the Australian Synchrotron in Melbourne. (c) Grey scale slice through the 3D micro CT scan of the sample that was used to locate gold grains for sectioning, gold grain also highlighted in red. (d,e) Photomicrographs in reflected light showing the nickel-arsenides with a nickeline core and a gersdorffite rim associated with the presence of gold. Au = gold, Ccp = chalcopyrite, Ger = gersdorffite, Ni = nickeline, Pn = pentlandite and Po = pyrrhotite.
Methodology: LA-ICP-MS
The concentrations of Ni, As, S and Fe were determined for each grain by electron microprobe on the Cameca SX50 instrument at CSIRO in Perth. Microprobe data were collected by wavelength dispersive spectrometry at an accelerating voltage of 15 Kv, beam current of 30 nA and counting times of 60 s per element (30 s peak 15 s background on each side).
The trace-element contents of arsenides were determined by LA-ICP-MS at LabMaTer, Université du Quebec à Chicoutimi (UQAC), Canada. The UQAC laser ablation system consists of an Agilent 7700x mass spectrometer with an Excimer 193 nm Resonetics Resolution M-50 laser ablation probe. Samples plus reference material, Ni and Cu blanks were placed in the S155 Dual Volume Sample Cell together. The spectrum of the gas blank was collected for 20 s with the laser switched off to determine the background. Then line scans across the grains were carried out using a beam size of 15 to 44 µm, (depending on the grain size of the arsenides), a laser frequency of 15 Hz, a power of 0.5 mJ/cm3 and a speed of lateral laser displacement of 5 µm/s. Each time the beam size was changed the reference materials and blanks were run to allow accurate calibration. An argon-helium gas mix was used as carrier gas. The material was then analysed using the mass spectrometer in time resolution mode using mass jumping and a dwell time of 10 ms/peak. The following isotopes were monitored: 29Si, 33S, 34S, 57Fe, 59Co, 61Ni, 65Cu, 68Zn, 75As, 82Se, 101Ru, 103Rh, 105Pd, 107Ag, 108Pd, 121Sb, 189Os, 193Ir, 195Pt and 197Au.
To calibrate for PGEs and Au at the Perservance deposit and Sarah's Find prospect, 34S was used as the internal standard; in addition, the certified reference material po-727, which is a synthetic FeS doped with ~0.040 ppm of each of the PGEs and Au provided by the Memorial University of Newfoundland, was used. For the remaining elements we used the certified reference material MASS-1 a ZnCuFeS pressed powder pellet provided by the US Geological Survey and doped with 0.050–0.070 ppm of most chalcophile elements. Two in house reference materials, JB-MSS5 and UQAC-MSS-1, were used to monitor the accuracy of the calibration. JB-MSS5 is a synthetic FeS with 1 wt.% Ni, 0.020–0.065 ppm PGEs, Au, Ag, As, Bi, Sb, Se and Te provided by Prof. J. Brenan. UQAC-MSS1 consists of a synthetic NiFeS2 provided by Dr. A. Peregoedova from McGill University, doped with ~0.002 ppm PGEs and Au.
This analytical protocol could not be used for the arsenide grains from the Mariners, Miitel and the Wattle Dam deposits because the S concentrations of the arsenides were either too variable or too low. Nickel was used as an internal standard for these arsenides; however, both po-727 and MASS-1 contain very little Ni and thus they could not be used for calibration. Therefore, we used MASS-3, an NiS pressed powder pellet provide by the US Geological Survey and doped with 50–70 ppm of most chalcophile elements to calibrate. UQAC-MSS-1 and JB-MSS-5 were used as monitors. Results obtained with the various monitors, analysed as unknown samples for each run to check data quality, are tabulated in Supplementary materials Tables S1, 2 and 3. These reference materials have been used in previous studies (Barnes et al., Reference Barnes, Prichard, Cox, Fisher and Godel2008; Dare et al., Reference Dare, Barnes and Prichard2010b, Reference Dare, Barnes, Prichard and Fisher2011; Godel et al., Reference Godel, Gondzalez-Alvarez, Barnes, Barnes, Parker and Day2012; Le Vaillant et al., Reference Le Vaillant, Barnes, Fiorentini, Miller, McCuaig and Muccilli2015, Reference Le Vaillant, Saleem, Barnes, Fiorentini, Miller, Beresford and Perring2016b).
101Ru was corrected for 61Ni interference by using a NiS blank bead; this correction is equivalent to ~0.001 to 0.0015 ppm in the arsenides. The amount of Cu interference on 103Rh and 105Pd from 63Cu40Ar and 65Cu40Ar, respectively, was determined by running a (CuFe)S2 blank. The Cu corrections on Rh and Pd in the arsenides are <0.01 ppm; therefore, no correction for Cu interference was made. Data reduction was carried out using Iolite software (Paton et al., Reference Paton, Hellstrom, Paul, Woodhead and Hergt2011). Sulfur, As, Ni and Si were monitored to ensure that the minerals measured were arsenides. The presence inclusions of accessory minerals within the arsenides was monitored, and excluded from the time resolved spectrum before calculating the average signal. Their signals were not taken into account during the integration leading to the calculation of trace-elements concentrations in the mineral of interest.
Results
Arsenides from the Perseverance nickel deposit
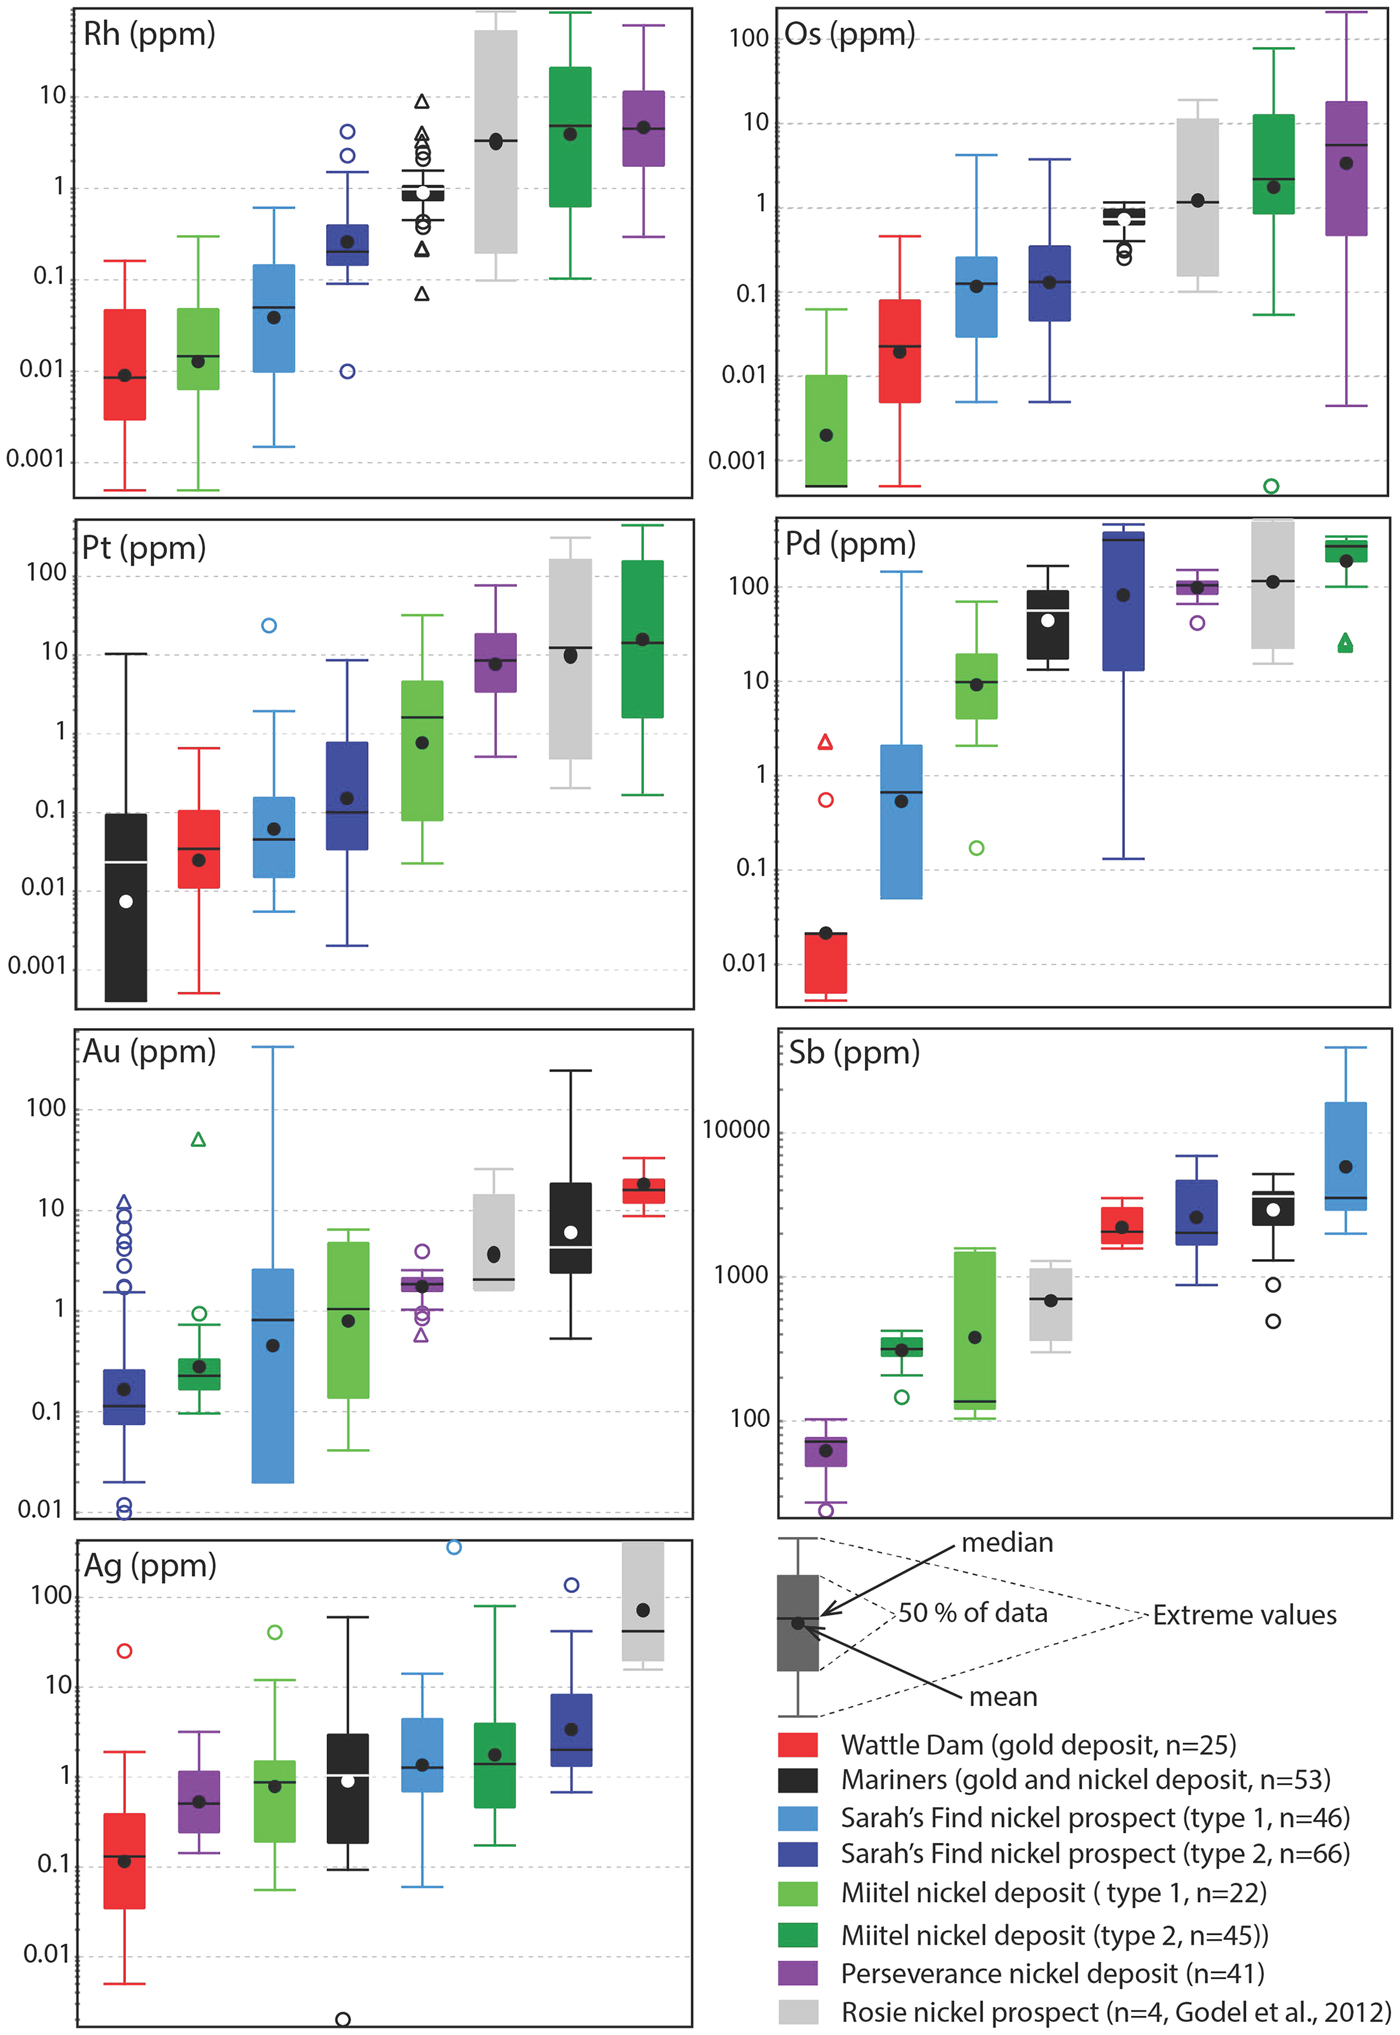
Arsenides from Perseverance are all gersdorffite (NiAsS) with homogeneous compositions (average of 42.1 wt.% As, 21.1 wt.% S, 16.6 wt.% Ni, 8.3 wt.% Co and 8.4 wt.% Fe). These arsenides, which are the only purely magmatic arsenides in this study, have the highest PGE concentrations of all analysed arsenides, particularly in IPGEs (Os, Ir, Ru, Rh) (Figs 12, 13). Average concentrations of PGEs in arsenides at Perseverance are 100 ppm Pd, 132 ppm Pt, 20 ppm Os, 10 ppm Ir, 9 ppm Rh and 32 ppm Ru.
Laser ablation trace-element analyses of arsenides from the various case studies. Data are plotted as mg/g with no normalization.

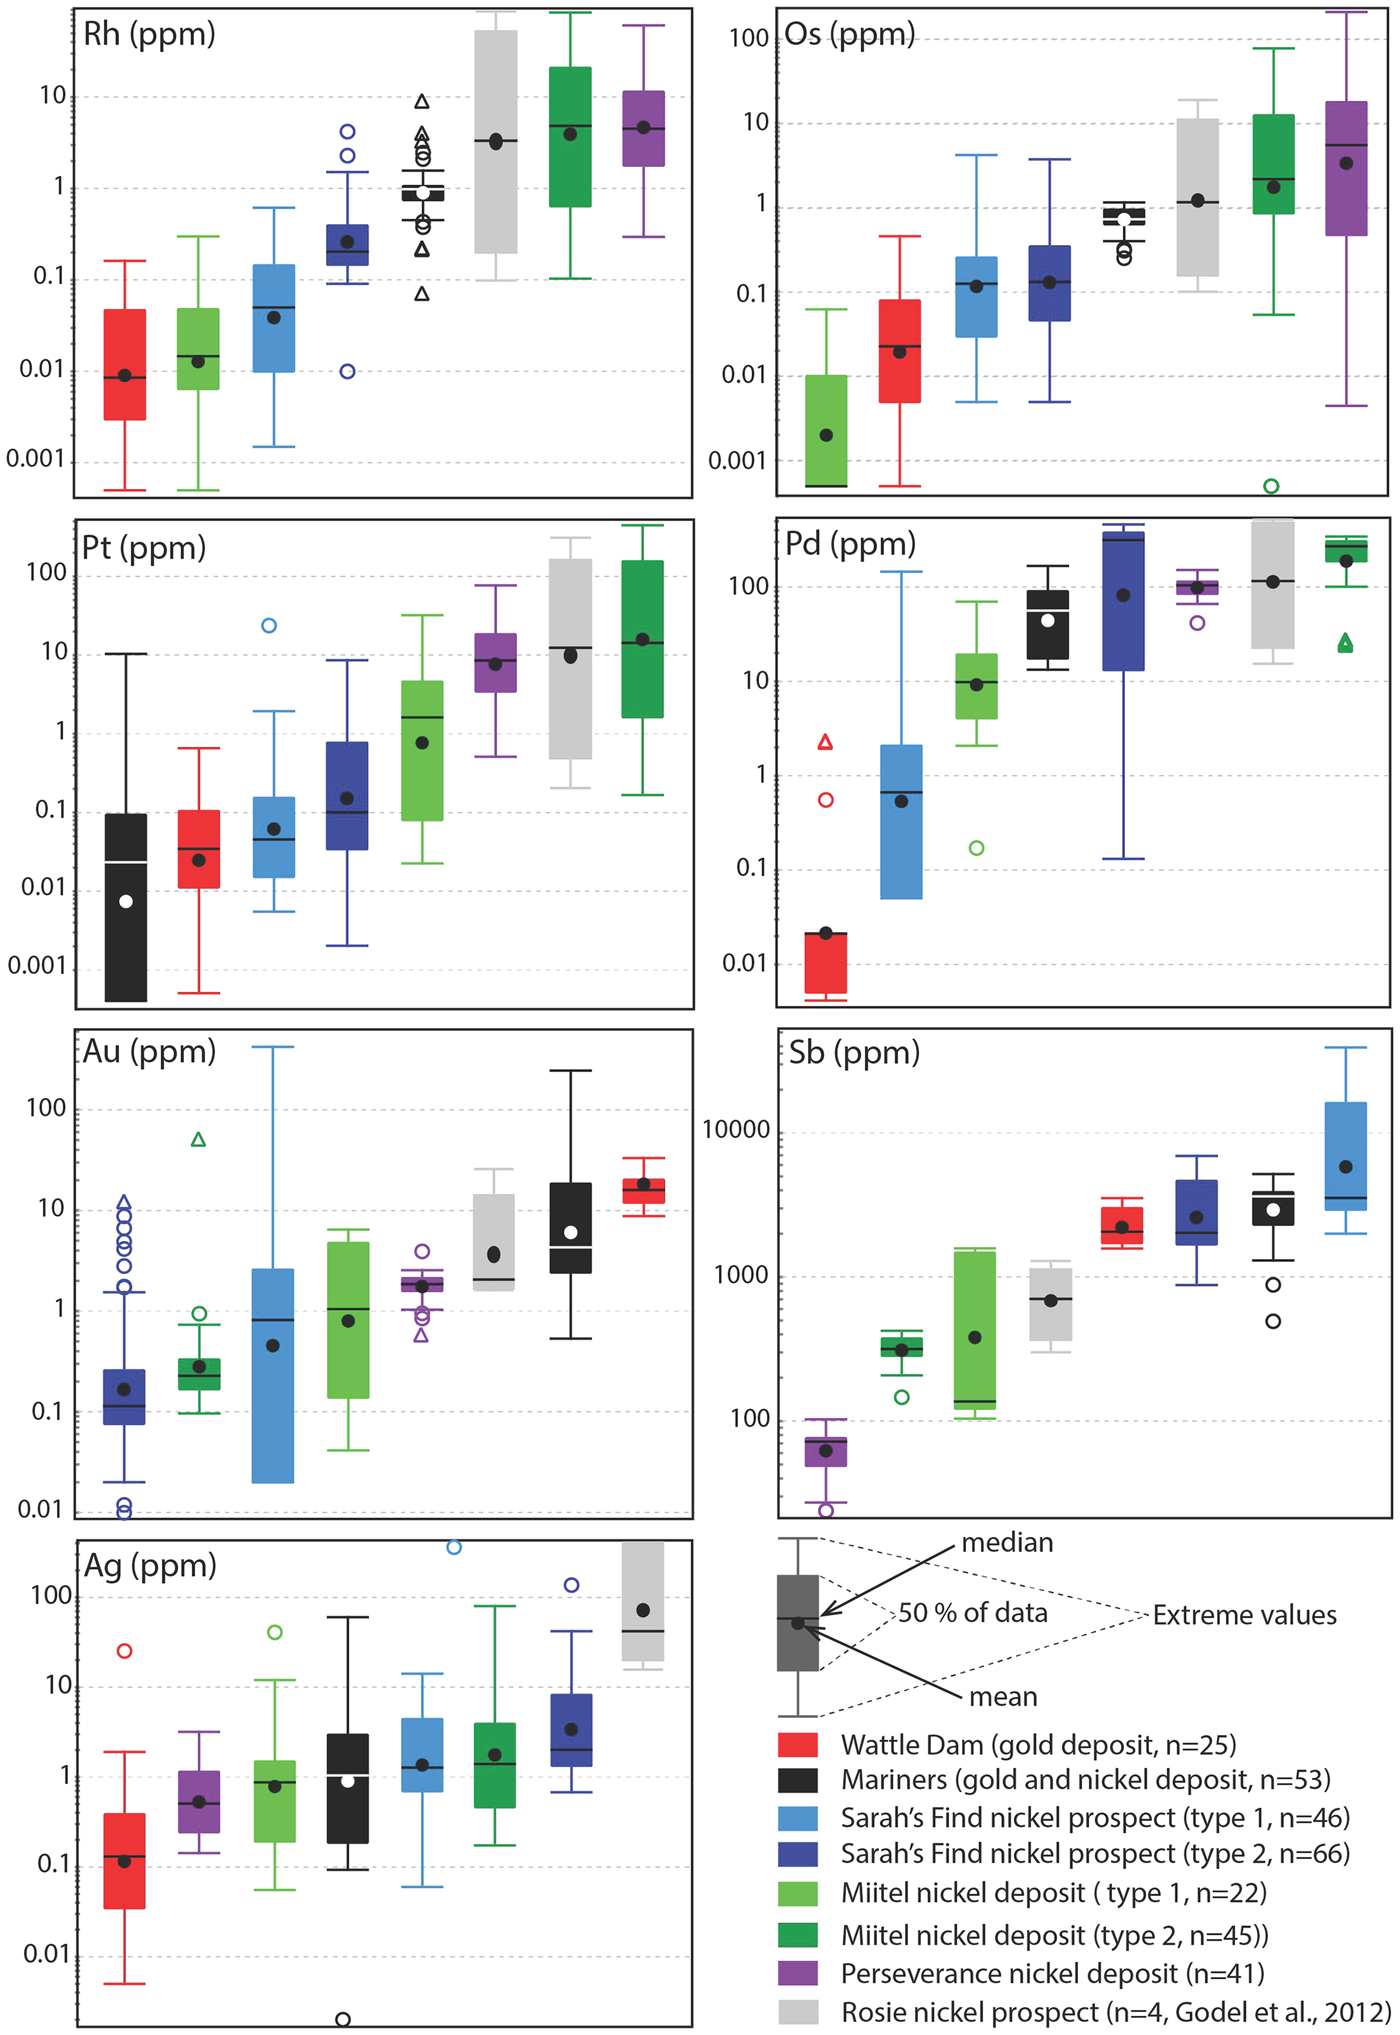
Tukey box plots showing the distribution in PGEs, Au, Sb and Ag for the arsenides within the different case studies presented in this paper. Central box is the intra-quartile range, outlier points (circles) are further than 1.5 x (Q3-Q1) from the box, triangles further than 3 × (Q3-Q1), dot = mean, dash = median, whiskers are extreme values that are not outliers. For arsenides from the Sarah's Find and Miitel localities, ‘Type 1' are hydrothermal arsenides whereas ‘Type 2' are arsenides located within magmatic sulfides that have been altered by As-rich hydrothermal fluids.
Arsenides from the Miitel nickel deposit
Arsenides from the Miitel deposit are all gersdorffite (NiAsS) with homogeneous As and S contents (averages of 49.1 wt.% As and 18.2 wt.% S) but varying Ni, Fe and Co contents due to substitutions (1.7–21.1 wt.% Co, 2.6–10.4 wt.% Fe and 10.4–28.6 wt.% Ni). Moreover, arsenides at Miitel have been separated in two ‘types’: the hydrothermal ones (type 1) and those that are due to local As-rich alteration of the massive sulfides (type 2; see description in Geological background). Gold, Sb and Ag contents of these two types are similar (1.4–4 ppm Au, 310–730 ppm Sb and 3.6–7.7 ppm Ag) but PGE contents vary a lot, with type 2 being more enriched in PGEs, particularly in IPGEs than type 1 (Figs 12, 13 and Table 1). IPGE concentrations of type 1 hydrothermal arsenides are the lowest compared to all arsenide studied here, whereas PGE contents of type 1 are the highest (with Perseverance) of all arsenides included in this study.
Representative compositions of arsenides from different localities.*
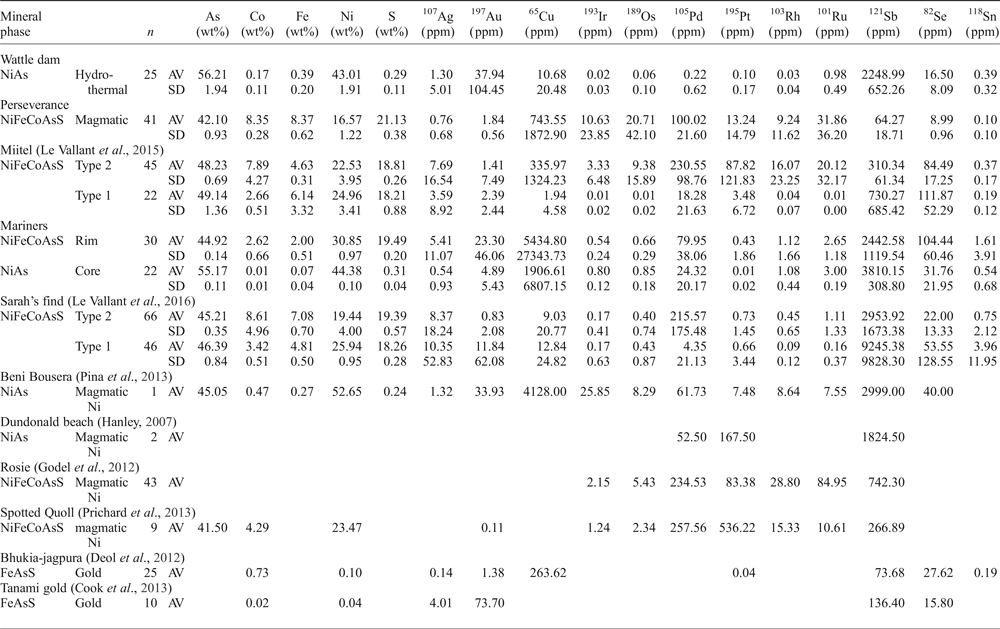
* Concentrations in majors (As, S, Ni, Fe, Co) are obtained by microprobes analyses - see Method section.
Concentrations in trace elements are obtained by LA-ICP-MS analyses - see Method section.
AV = average; SD = standard deviation; n = number of analyses
Arsenides from the Sarah's Find nickel prospect
Arsenides from the Sarah's Find prospect are also all gersdorffites (NiAsS) with homogeneous As and S contents averaging at 46 wt.% As and 19 wt.% S, but varying Ni, Fe and Co contents due to substitutions (1.3–16.54 wt.% Co, 3.7–8.2 wt.% Fe and 12.6–27 wt.% Ni) (Figs 12, 13). Also at Sarah's Find arsenides have been separated in two types: those that are purely hydrothermal (type 1) and those formed by local As-rich alteration of the massive sulfides (type 2). Their compositional range is less than that observed at Miitel, but a difference can still be observed, with more elevated Au concentrations (average of 11.8 mg/g Au) and lower PGE concentrations (average concentrations of 4.3 ppm Pd, 0.6 ppm Pt, 4 ppm Os, 0.1 ppm Ir, 0.1 ppm Ru and 09 ppm Rh) in type 1 (hydrothermal) compared to type 2 (average concentrations of 0.8 ppm Au, 215 ppm Pd, 0.7 ppm Pt, 0.4 ppm Os, 0.2 ppm Ir, 1.1 ppm Ru and 0.4 ppm Rh). Compared to other arsenides studied in this project, arsenides from Sarah's Find seem to have average concentrations in PGEs and Au, but elevated concentrations in Sb (average of 5500 ppm Sb).
Arsenides from the Wattle Dam gold deposit
Arsenides from the Wattle Dam deposit were nickeline (NiAs) with the following average composition: 56.2 wt.% As, 43 wt.% Ni and trace amounts (<0.5 wt.%) of Co, Fe and S. These arsenides are enriched in Au, with an average of 0.017 ppm. Concentrations in platinum-group elements are low with an average of 6 ppm Pd, 1 ppm Pt, 5 ppm Ru, 1 ppm Os and Ir and Rh below 0.5 ppm. Concentrations in Sb are also fairly elevated, with an average of 2250 ppm (Table 1 and Fig. 12). When compared with all other arsenides within the study, the nickeline grains from the Wattle Dam deposit are the least enriched in Pd, Pt and Rh, and the most enriched in Au and PGEs (Fig. 12, Fig. 13).
Arsenides from the Mariners nickel and gold deposit
Arsenides from the Mariners deposit analysed within this study presented a characteristic zoning with a core of nickeline (NiAs), with average compositions of 55.1 wt.% As and 44.4 wt.% Ni and trace amounts of Co, Fe and S, and a rim of gersdorffite (NiAsS), with an average composition of 44.9 wt.% As, 30.8 wt.% Ni, 19.5 wt.% S, 2.6 wt.% Co and 2 wt.% Fe. The trace-element composition of the core and rims are very similar for IPGEs (5–8 ppm Ir, 6–8 ppm Os, 1.1 ppm Ru and 2.6–3 ppm Rh), as well as Sb contents, which are very elevated (2400–3800 ppm Sb; Table 1 and Fig. 12). Gold and PPGEs (Pt, Pd) seem to be a little more enriched in the rims than in the cores: 80 ppm Pd, 4 ppm Pt and 23 ppm Au average in rims compared to 24 ppm Pd, 0.1 ppm Pt and 4.9 ppm Au average in cores (Table 1 and Fig. 12). In general, compared to arsenides from other environments, arsenides within the Mariners deposit have elevated concentrations in Au and Sb, and average concentrations in PGEs (Fig. 12, Fig. 13).
Effects of mineral species and inter-element correlations
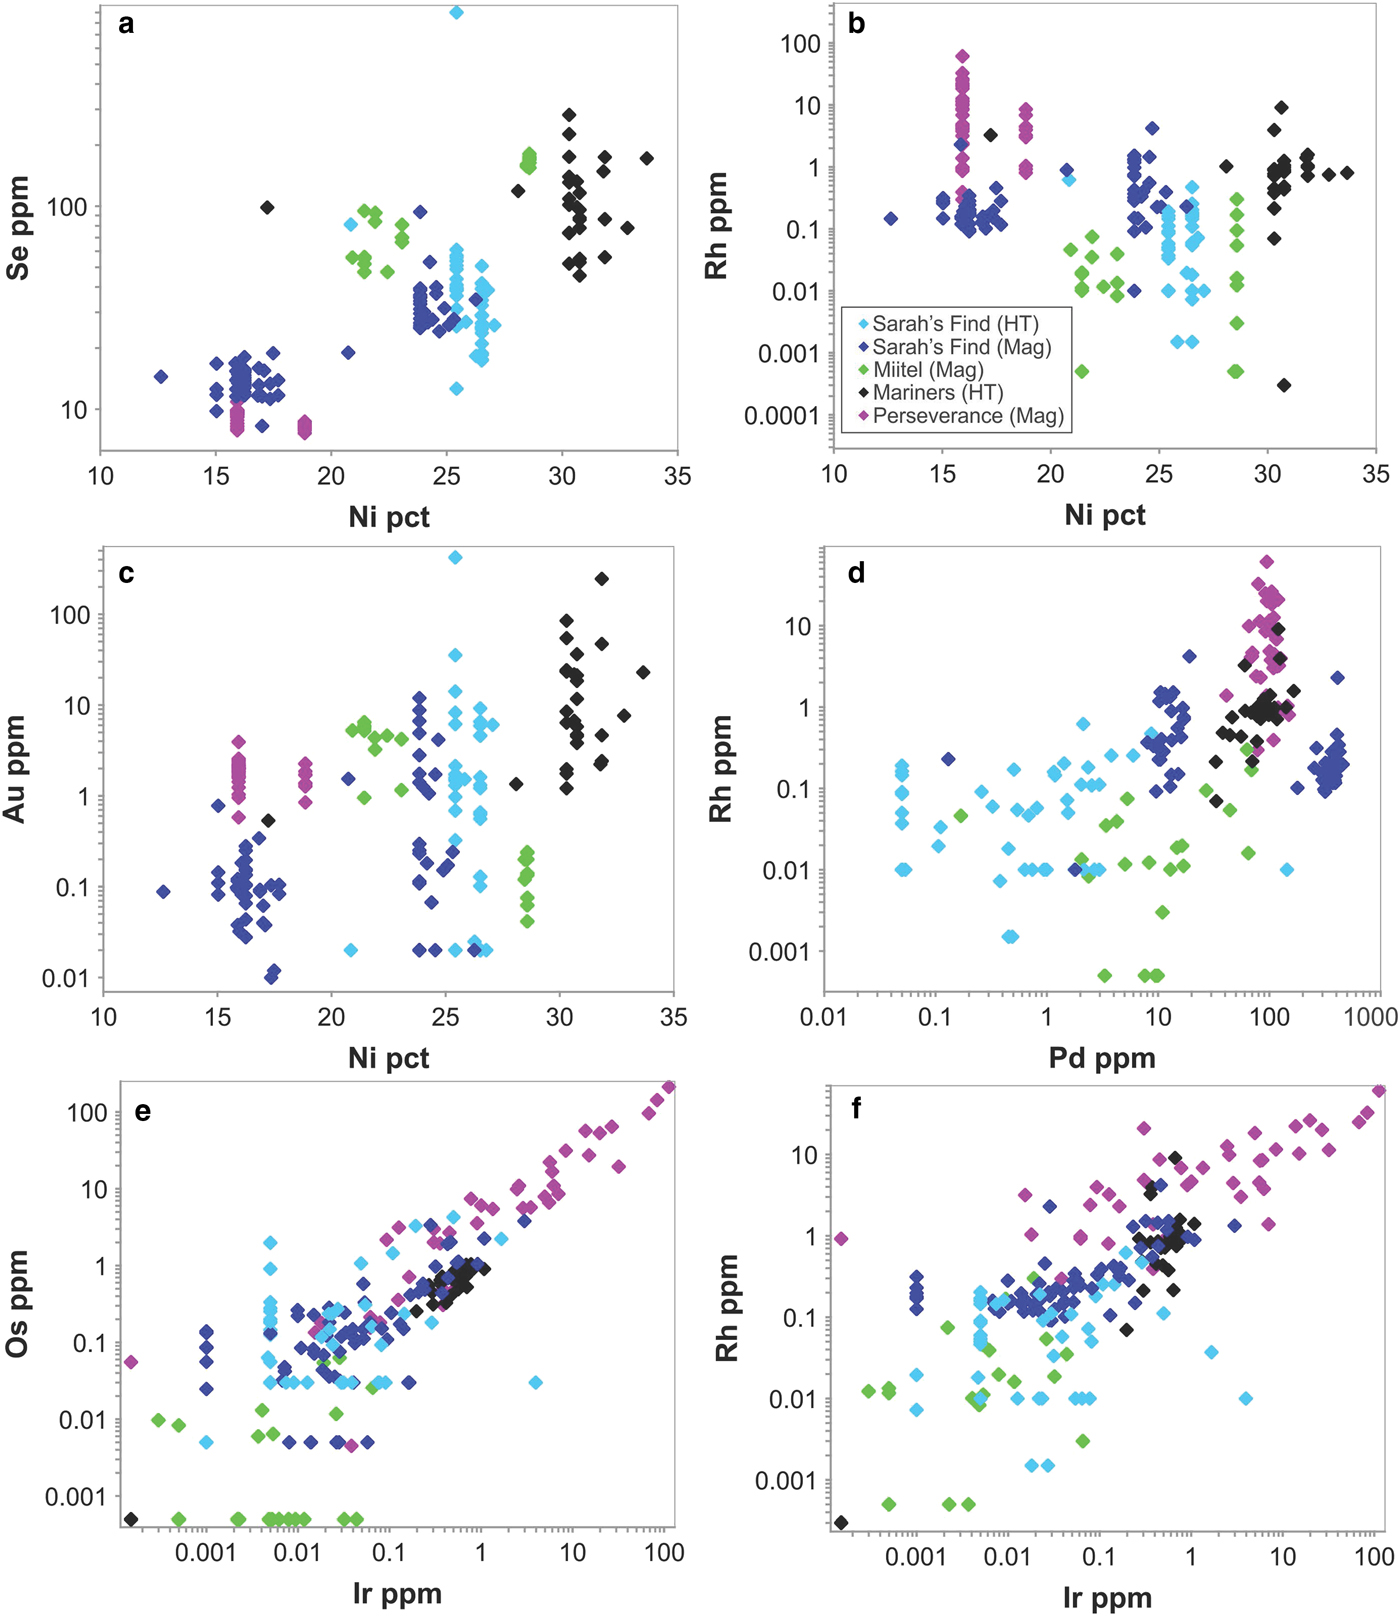
No systematic differences were observed in trace-element contents of Ni arsenide (nickeline, also called niccolite) compared with Ni–Co–Fe sulfarsenides in the only occurrence (Mariners) containing both species, with the exception of Se (median 100 ppm in sulfarsenides, 30 ppm in nickeline), Pd (80 and 20, respectively) and Pt (0.1 and 0.04, respectively). Nickeline rims at Mariners are not enriched in Au relative to sulfarsenides.
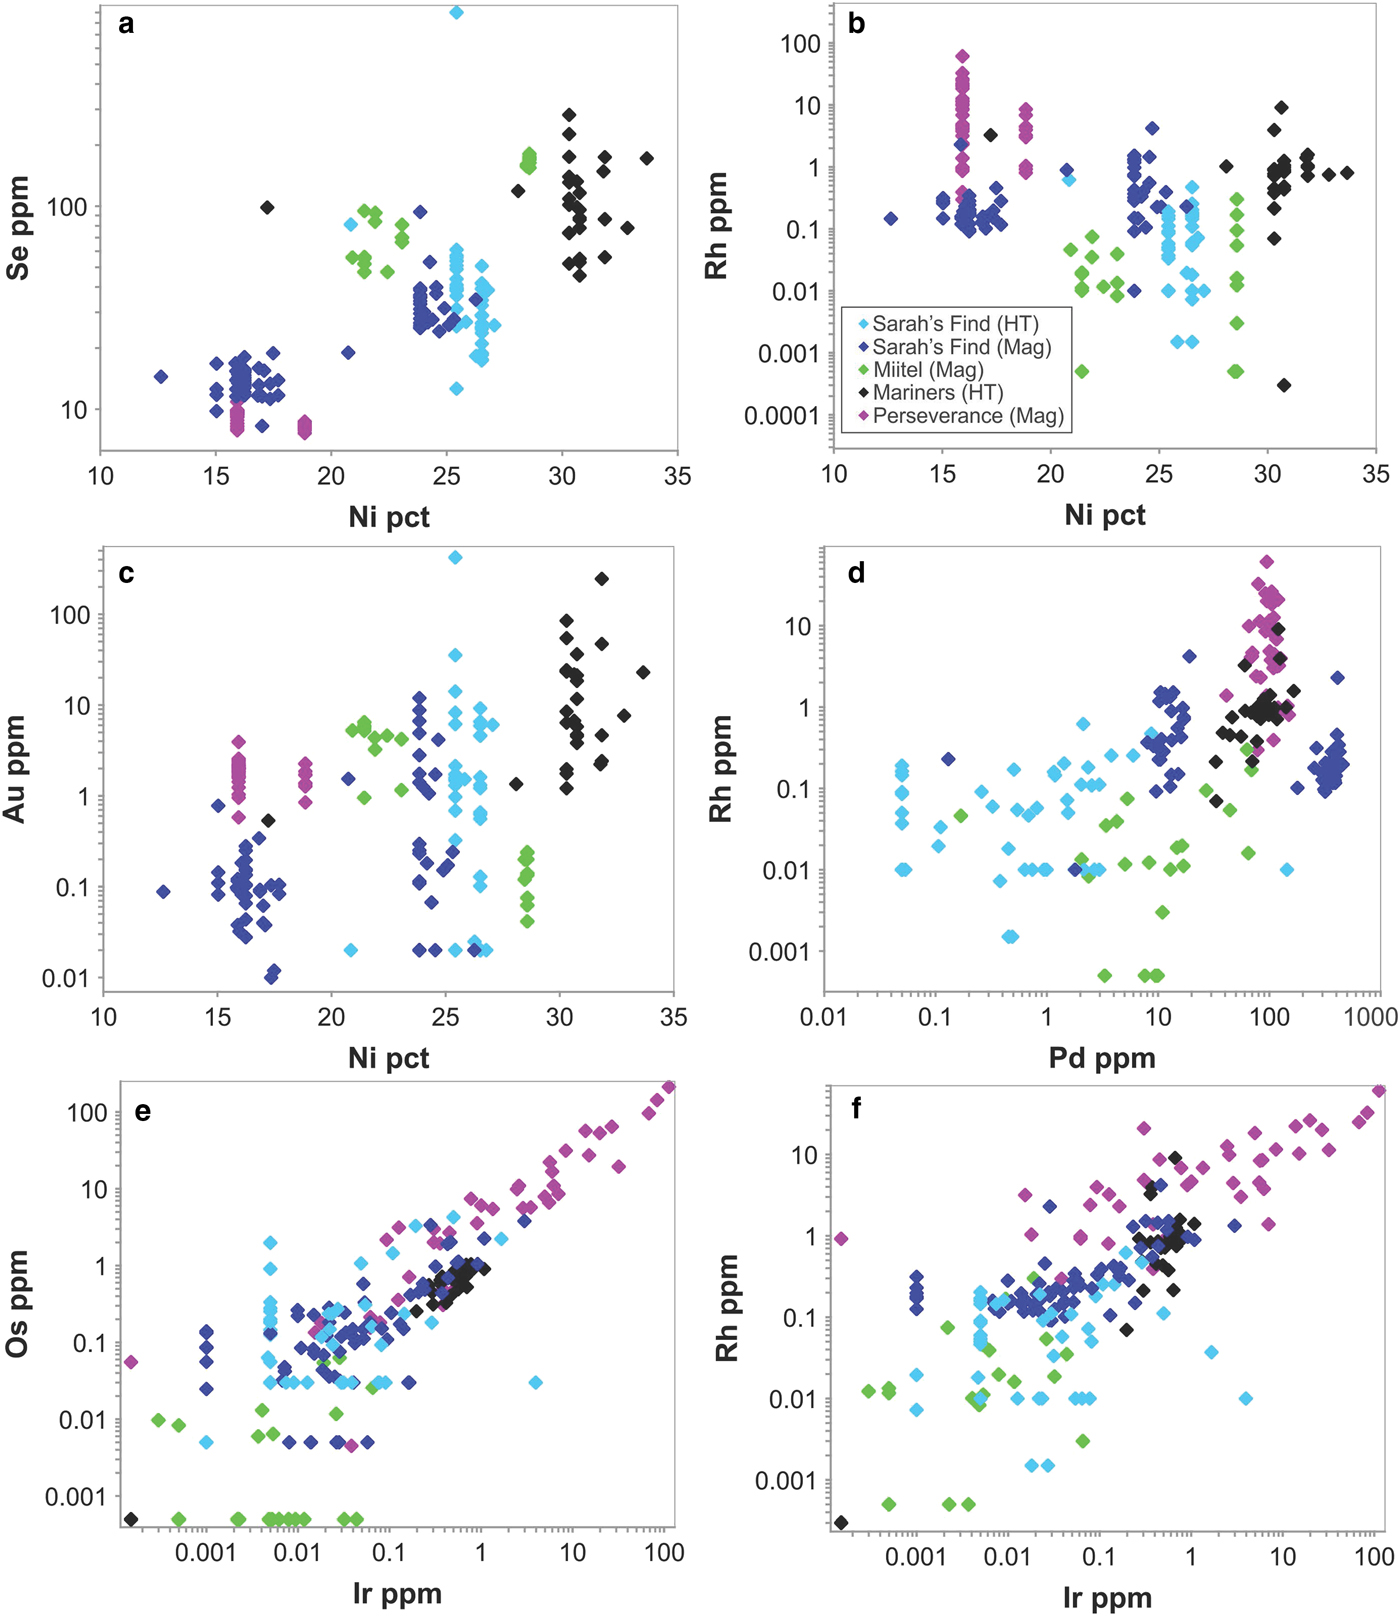
Considering only NiCoFe sulfarsenides, a number of weak inter-element correlations were noted between trace- and major-element contents over the entire set of occurrences (Fig. 14), although these can be attributed mostly to the paragenesis rather than the mineral chemistry. Sulfarsenides from Mariners are the most Ni rich (Table 1) and also the most Au rich (Fig. 14c). The Se contents of sulfarsenides increase with Ni content, but this trend is dominated by the low-Ni magmatic phases from Sarah's Find (Fig. 14a). The IPGEs Ir, Ru and Os along with Rh correlate strongly with one another over the entire sulfarsenide data set (Fig. 14e,f) but show no systematic relationship to Ni. Considering the magmatic arsenide phases from Perseverance alone, there are very strong positive correlations between Pt, Rh, Ru and somewhat less strong between Pt, Os and Ir. Other than these, no significant inter-element correlations are evident. Aside from a very weak correlation between Pd and Rh (Fig. 14d), dominated by the Perseverance data set, Pt and Pd are largely decoupled from the IPGEs and Rh.
Selected scatter plots showing inter-element concentrations in Ni–Co–Fe sulfarsenides from the various study sites. In the legend box, ‘HT’ stands for hydrothermal, and ‘Mag’ stands for magmatic.
Comparison between localities
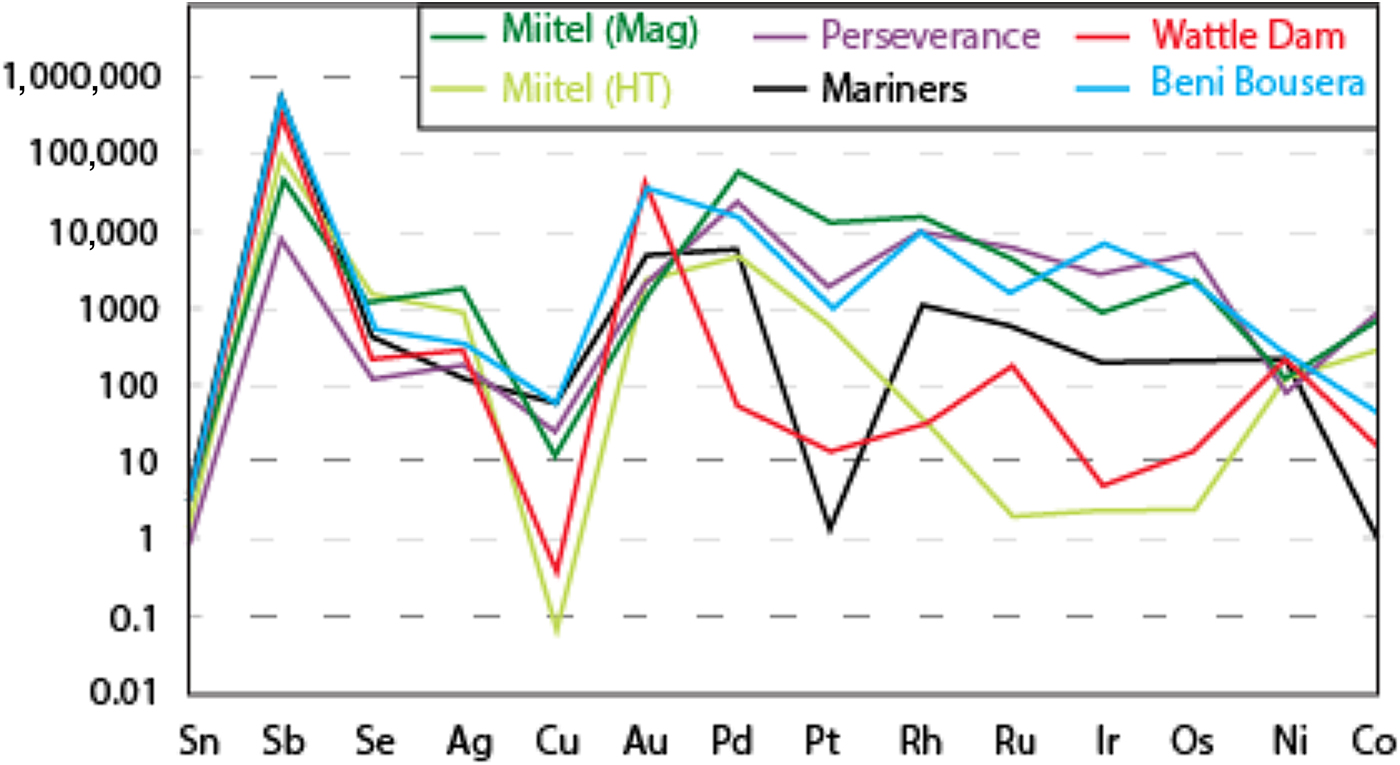
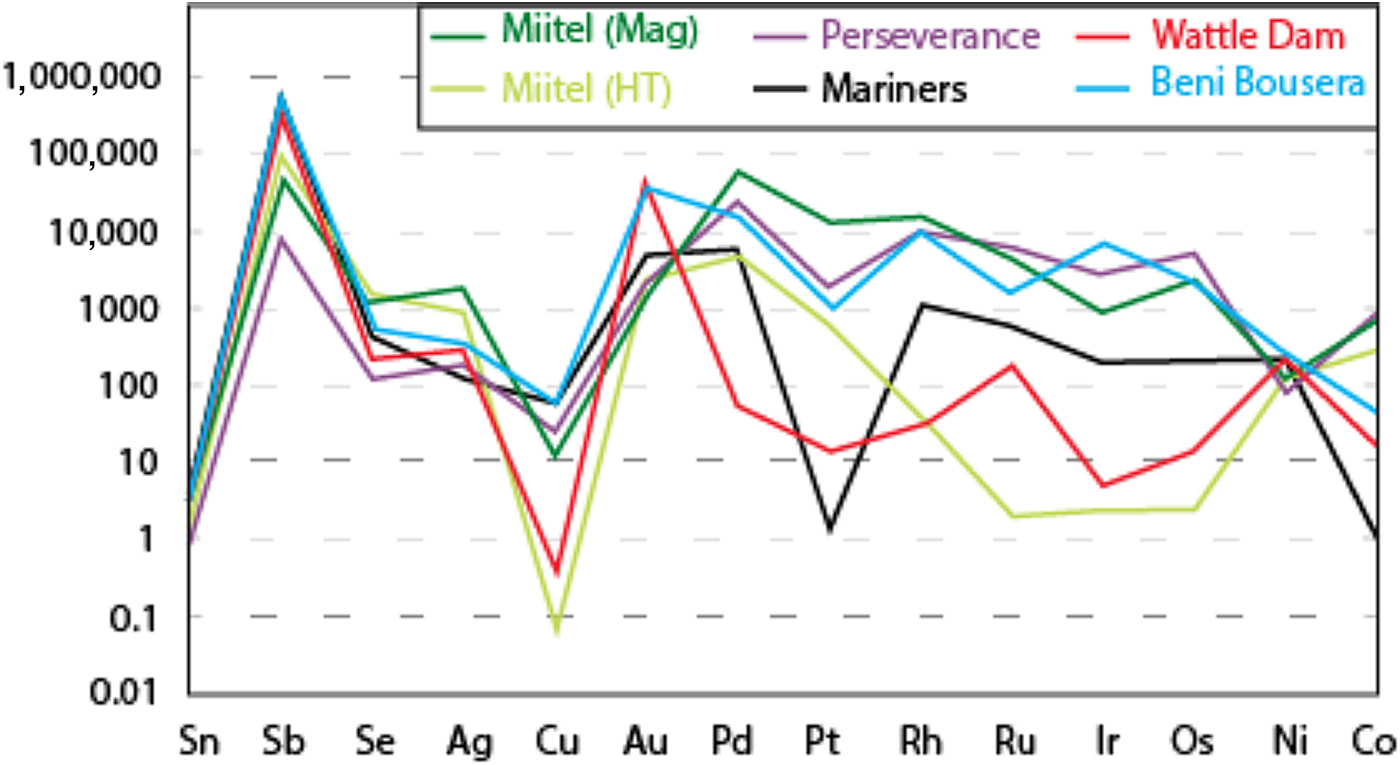
Data on the composition of the various arsenides studied are plotted as mantle normalized averages in Fig. 15, and compared with literature data on known hydrothermal arsenides from Beni Bousera. Results can be summarized as follows: Purely magmatic nickel arsenides from Perseverance are enriched in PGEs compared to hydrothermal arsenides and also compared to concentrations obtained from the literature from the Rosie prospect and the Spotted Quoll deposit in Australia (Fig. 15). Concentrations in Au, Sb and Ag are more variable, lower than for Au deposits, but still higher than Au concentrations observed in hydrothermal Ni arsenides. Purely hydrothermal arsenides linked to Au mineralization on the contrary have low PGE concentrations compared to magmatic Ni arsenides (Wattle Dam deposit), but their Au concentrations are the highest, along with elevated Sb. Interestingly, Ag contents of the arsenides at Wattle Dam are very low.
Mantle normalized average element abundances for the various study areas, compared with data from Beni Bousera (Pina et al., Reference Pina, Gervilla, Barnes, Ortega and Lunar2015). Element order (based on silicate melt compatibility) and mantle normalizing values from Lesher and Keays (Reference Lesher, Keays and Cabri2002).
Hydrothermal arsenides associated with Ni sulfide deposits generally have PGE concentrations that are more elevated than arsenides associated with Au deposits, but lower than magmatic arsenides, whereas their Au contents are lower than both magmatic and Au associated arsenides. However, these hydrothermal arsenides can be divided in two main categories. (1) Arsenides that crystallize directly from the As-rich hydrothermal fluids, away from the massive sulfides, observed within a secondary geochemical halo at Miitel and Sarah's Find (Type 1); and (2) arsenides that crystallized in place within the massive sulfides during alteration by the As-rich hydrothermal fluids such as the ones observed at Mariners where the fluids carry important amounts of Au, but also at Miitel within the massive sulfides (Type 2) and at Sarah's Find, where some have been mechanically remobilized along with the sulfides during deformation (type 2). Slightly different trace-element concentrations can be observed for these two categories of arsenides. Category 2 shows more elevated PGE concentrations than category 1, which displays higher Au contents, except for arsenides from the Mariners Ni–Au deposit which show very elevated Au concentrations, as expected.
Discussion
Processes controlling PGE and Au contents of arsenide phases
In the systems studied here, the source of PGEs and Ni is the mafic-ultramafic magma, whereas the source of Au is either the magma, material assimilated by the magma during emplacement, or the hydrothermal fluids affecting the system later. The crystallization of arsenides from the magmatic sulfide melt, with or without an intervening stage of formation of an immiscible arsenide liquid, is primarily controlled by the As content of the sulfides (Hanley, Reference Hanley2007; Helmy et al., Reference Helmy, Ballhaus, Fonseca and Nagel2013b; Bai et al., Reference Bai, Barnes and Baker2017; Canali et al., Reference Canali, Brenan and Sullivan2017), which in turn is controlled by the amount of As assimilated into the magma during the ore forming process. Other factors such as timing of monosulfide solid-solution fractionation and saturation in PGE arsenide minerals are likely to play a major role in the final deposition of PGEs, introducing complexities that cannot be resolved with the present data set.
The Au content of these arsenides may depend on the amount of Au present within the assimilated crust material upon emplacement of the magma, but is also very likely to be modified by secondary processes such as sea-floor hydrothermal alteration or later regional hydrothermal overprinting. This additional complexity explains why Au contents of magmatic nickel arsenides (Perseverance, Rosie and Spotted Quoll) vary widely from one deposit to another. Experimental data on solubilities of PGEs in As-bearing fluids are lacking, but empirical observations on the association of PGEs with As in hydrothermal settings imply that the solubility of PGEs in aqueous fluids is greatly enhanced by the presence of As-bearing ligands (see Le Vaillant et al., Reference Le Vaillant, Barnes, Fiorentini, Miller, McCuaig and Muccilli2015 and references therein). The composition of arsenides formed by hydrothermal fluids away from massive sulfides will depend on the composition of the fluids and the pressure and temperature conditions of deposition. Therefore, arsenides that form within an Au mineralized environment where no Ni-PGE enriched sulfides are present will be enriched in Au, but poor in PGEs, as observed at the Wattle Dam deposit. The fact that arsenides within hydrothermal haloes around Miitel and Sarah's Find contain PGEs implies that these elements were remobilized and transported by As-rich hydrothermal fluids. As expected, these arsenides contain more Pd and Pt compared to the other PGEs, which are less mobile in hydrothermal fluids.
Finally, the composition of arsenides within massive nickel sulfide ore bodies will depend on both the composition of the As-rich hydrothermal fluids and the composition of the altered sulfides. At Mariners, the fluids are inferred to have been enriched in Au, based on the presence of Au concentrations typical of hydrothermal lode Au deposits. Therefore, arsenides produced in this way contain high Au concentrations compared to the ones observed within the mineralization at Miitel and Sarah's Find, where no anomalous Au contents are observed. In contrast, sulfides at Miitel are very enriched in PGEs; therefore, arsenides produced within the mineralization through the process of alteration of As-rich hydrothermal fluids are also very rich in PGEs. Interestingly, arsenides at Mariners seem to have very low Pt concentrations compared to other PGEs. This could be explained by retention of Pt within its own platinum-group minerals (PGM).
Potential use of arsenides as indicator minerals
The first potential application lies in the interpretation of the petrogenesis of arsenide minerals and As-PGE anomalies associated with shear zones in greenstone terranes. The association of As with talc-carbonate alteration in shear zones is widespread in Archean greenstone terranes (e.g. Groves et al., Reference Groves, Goldfarb, Knox-Robinson, Ojala, Gardoll, Yun and Holyland2000). Where fluid-bearing shear zones intersect Au or Ni ores, potential exists for the mobilization of As and PGEs along the zones, as observed at Sarah's Find. The presence of PGE-enriched or Au-enriched arsenide minerals could be a distal footprint of the existence of mineralization upstream along the fluid flow path.
Secondly, arsenide minerals may well be sampled as part of heavy-mineral assemblages in environments of limited chemical weathering, such as in glacial till samples. PGE-enriched Ni–Co–Fe arsenides would be highly diagnostic indicators for magmatic Ni–Cu–PGE sulfide mineralization, and are likely to be much more abundant and detectable than PGMs themselves. Similarly, Au-enriched arsenides could serve as tracers for hydrothermal Au mineralization. Given that some arsenides, notably sperrylite, are known to be highly stable during weathering (Mota-e-Silva et al., Reference Mota-e-Silva, Prichard, Suarez, Ferreira Filho and Fisher2016), potential also exists for the survival of arsenide minerals in weathered terrains.
Conclusion
Variations are observed in the composition in PGEs and Au of Ni–Co sulfarsenides as a function of the environment in which the arsenides occur and the mineral phases they are associated with. At Miitel, primary Ni-sulfarsenides within magmatic massive sulfides are enriched in Pd and Pt, but also slightly enriched in IPGE (Ir, Os, Ru, Rh), whereas the Ni-sulfarsenides within the hydrothermal halo, concentrated within pervasively altered areas and quartz-carbonate veins, only contain Pd and Pt, in lower concentrations, and also often contain small amounts of Au. A similar observation is found at Sarah's Find, where the Ni–Co sulfarsenides associated with physical remobilization of the massive sulfides are enriched in all the PGEs (particularly Pd and Pt) whereas the Ni–Co sulfarsenides associated with hydrothermal remobilization from the massive sulfides, and concentrated in the foliation, are enriched in Pd and Pt only, in lower concentrations, and also contain small amounts of Au. Possible applications of this understanding would be: (1) the distal detection of shear hosted nickel sulfide or even Au ore bodies using the chemistry of As-bearing minerals, or anomalous arsenic bearing samples in shear zones; and (2) the use of PGE and or Au anomalous arsenide minerals as indicator minerals in glacial till samples.
Acknowledgements
Financial support for this research was provided by MERIWA (project #M413), BHP Billiton Nickel West, Mincor Resources NL and First Quantum Minerals Ltd. The SIRF scholarship of the University of Western Australia and the MERIWA research grant are greatly appreciated. BHP Billiton Nickel West and Mincor Resources NL and are acknowledged for providing on site access and samples. Marco Fiorentini acknowledges support from the Australian Research Council through Linkage Project LP120100668 and the Future Fellowship Scheme (FT110100241). This is contribution 1024 from the ARC Centre of Excellence for Core to Crust Fluid Systems http://www.ccfs.mq.edu.au). The element maps presented in this manuscript were collected using the Maia Detector on the X-ray fluorescence microscopy beamline on the Australian Synchrotron in Clayton, Victoria. We acknowledge financial support for this facility from the Science and Industry Endowment Fund (SIEF). Finally, we would like to thank Danny Savard for help when collecting the LA-ICP-MS data at UQAC, as well as Malcom Roberts for his help when collecting microprobe data at the CMCA, Perth.
Supplementary material
To view supplementary material for this article, please visit https://doi.org/10.1180/minmag.2017.081.100