Introduction
Climate is clearly one of the most important factors in the success of all agricultural systems, influencing suitability, crop production and quality, and economic sustainability (Jones et al., Reference Jones, Reid, Vilks and Dougherty2012). From broadacre crops such as wheat, rice, maize and soybeans to speciality crops such as fruits and vegetables, tree nuts, dried fruits and coffee, all have strong ties to global and regional climates. While broadacre crops are clearly more important as global food sources, speciality crops present unique sensitivities to climate that have made them especially interesting to researchers examining global changes. One such speciality crop that has received attention is wine grapes. Growing grapes for wine production is tied strongly to climate, as it provides the conditions necessary to ripen fruit to its optimum quality to produce a desired wine style (Lebon, Reference Lebon2002; Malheiro et al., Reference Malheiro, Santos, Pinot and Jones2012; Jones, Reference Jones2014). Global wine production occurs over relatively narrow geographical and climatic ranges; however, wine grapes also have relatively large variety differences in climate suitability, further limiting some wine grapes to even smaller areas that are climatically appropriate for their cultivation (Jones, Reference Jones, Macqueen and Meinert2006; Tomasi et al., Reference Tomasi, Jones, Giust, Lovat and Gaiotti2011). These narrow zones for optimum quality and production put the cultivation of wine grapes at greater risk from both short-term climate variability and long-term climate changes than other broadacre crops.
Changes in vine development related to temperature and precipitation
Research on aspects of global environmental change on viticulture and wine production reveal significant changes in numerous temperature and precipitation characteristics (Fraga et al., Reference Fraga, Malheiro, Moutinho-Pereira and Santos2012). In general, wine regions worldwide have seen changes in average climate structure, producing warmer and longer growing and dormant periods; however, these changes are not uniform across regions, seasons or diurnal cycles (Nemani et al., Reference Nemani, White, Cayan, Jones, Running and Coughlan2001; Jones et al., Reference Jones, White, Cooper and Storchmann2005a; Webb et al., Reference Webb, Whetton and Barlow2007; Fraga et al., Reference Fraga, Malheiro, Moutinho-Pereira and Santos2012). Heat extremes have been shown to induce plant stress, reduce photosynthesis, affect flowering and fruit set, cause premature veraison (V), and can slow growth of berries and impede sugar accumulation (Greer and Weston, Reference Greer and Weston2010). Delays in berry ripening and significant reductions in berry quality may also occur (Greer and Weedon, Reference Greer and Weedon2013). Increasing temperatures may also have a direct impact on grape composition and thus flavour development via alteration of secondary metabolites such as flavonoids, amino acids and carotenoids (Schultz, Reference Schultz2000). In addition, water stress has been shown to affect fruit yield and quality through its regulation of active growth processes during vine development (Goodwin, Reference Goodwin2009; Ramos, Reference Ramos2017). Water stress can also result in the chemical breakdown or formation of important berry acids and flavours. Furthermore, water stress can result in decreased berry size and an increase of the skin to juice ratio, which may increase the concentration of anthocyanins and phenolic compounds in the must and wine of red grapes (Goodwin, Reference Goodwin2009).
Grapevine varieties have similar overall phenological timing but differ slightly due to morphological and physiological characteristics that produce early, mid and late season ripening (Tomasi et al., Reference Tomasi, Jones, Giust, Lovat and Gaiotti2011). Growing season temperatures define the suitability of each variety to a given area (Jones et al., Reference Jones, Duff, Hall and Myers2010), although recent research has further confirmed significant links between grapevine phenological timing and temperature in the preceding months (Bock et al., Reference Bock, Sparks, Estrella and Menzel2011; Malheiro et al., Reference Malheiro, Campos, Fraga, Eiras-Dias, Silvestre and Santos2013; Fraga et al., Reference Fraga, Santos, Moutinho-Pereira, Carlos, Silvestre, Eiras-Dias, Mota and Malheiro2016). Thermal requirements expressed in various forms of heat accumulation or degree-day indices have also been considered to help describe and predict grapevine phenology in different viticultural areas (Parker et al., Reference Parker, de Cortázar-Atauri, van Leeuwen and Chuine2011; Fila et al., Reference Fila, Gardiman, Belvini, Meggio and Pitacco2014; Hall et al., Reference Hall, Mathews and Holzapfel2016; and others). In some research, measures of maximum and average temperatures were found to be more important than minimum temperatures in describing phenology timing (Bock et al., Reference Bock, Sparks, Estrella and Menzel2011; Ruml et al., Reference Ruml, Korać, Vujadinović, Vuković and Ivanišević2016). However, Urhausen et al. (Reference Urhausen, Brienen, Kapala and Simmer2011) indicated the need to use a combination of climate variables to best describe events such as budbreak (BB), where heat accumulation in March, maximum temperatures in April, and frost days during January–March were the best predictors. For bloom (BL), the best predictors were growing degree-days (GDD) in May and April, maximum temperatures in June and the date of BB (Urhausen et al., Reference Urhausen, Brienen, Kapala and Simmer2011).
Observed increases in temperature have had direct effects on the onset of individual phenological events, the length between events and on the overall length of the growing period, and has been observed in different viticultural areas around the world (Duchêne and Schneider, Reference Duchêne and Schneider2005; Jones et al., Reference Jones, Duchene, Tomasi, Yuste, Braslavksa, Schultz, Martinez, Boso, Langellier, Perruchot, Guimberteau and Schultz2005b; Sadras and Soar, Reference Sadras and Soar2009; Bock et al., Reference Bock, Sparks, Estrella and Menzel2011; Urhausen et al., Reference Urhausen, Brienen, Kapala and Simmer2011; Webb et al., Reference Webb, Whetton, Bhend, Darbyshire, Briggs and Barlow2012; Ruml et al., Reference Ruml, Korać, Vujadinović, Vuković and Ivanišević2016). Trends in grapevine phenology have ranged from 6 to 25 days earlier over numerous varieties and locations and are correlated strongly with warmer springs and summers. The greatest changes have been observed for V and harvest dates, which typically show a stronger, integrated effect of a warmer growing season (Jones, Reference Jones and Schwartz2013). Interval lengths between the main phenological events have also declined with BB to BL, V or harvest dates shortening by 14–17 days (Jones et al., Reference Jones, Duchene, Tomasi, Yuste, Braslavksa, Schultz, Martinez, Boso, Langellier, Perruchot, Guimberteau and Schultz2005b; Tomasi et al., Reference Tomasi, Jones, Giust, Lovat and Gaiotti2011). A meta-analysis over all locations globally and numerous varieties shows that grapevine phenology has responded with an advance of 4–8 days per 1 °C of warming over the last 30–50 years (Jones, Reference Jones and Schwartz2013). As a result of the shortened ripening period, harvest now occurs in many regions during a period with higher temperatures, which ultimately has a negative impact on grape and wine quality (Duchêne and Schneider, Reference Duchêne and Schneider2005; Webb et al., Reference Webb, Whetton and Barlow2007; Salazar Parra et al., Reference Salazar Parra, Aguirreolea, Sánchez-Díaz, Irigoyen and Morales2010) and yield (Iglesias et al., Reference Iglesias, Quiroga and Schlickenrieder2010; Mira de Orduña, Reference Mira de Orduña2010). Despite the fact that grapevines can be adapted to changing climate conditions, the spatial heterogeneity in temperature and precipitation changes and the projected increased frequency of extreme events (IPCC, Reference Stocker, Qin, Plattner, Tignor, Allen, Boschung, Nauels, Xia, Bex and Midgley2013), may give rise to different responses by grapevines. Furthermore, within the present suitable temperature range for a given variety, climate change may produce different responses from the same variety in different regions.
Expected temperature changes under climate change scenarios and vine responses
Depending on the underlying emissions scenario, climate models predict continued increases in global temperatures of 1.3–4.8 °C by the end of this century (IPCC, Reference Stocker, Qin, Plattner, Tignor, Allen, Boschung, Nauels, Xia, Bex and Midgley2013). But of potentially more concern are changes in the variability of the climate where there are likely to be more extreme heat occurrences, but still swings to extremely cold conditions (IPCC, Reference Stocker, Qin, Plattner, Tignor, Allen, Boschung, Nauels, Xia, Bex and Midgley2013). For wine regions globally, Jones et al. (Reference Jones, White, Cooper and Storchmann2005a) found that mean growing season temperatures could warm by an average 2 °C in 27 of the world's top wine-producing regions by 2049. Numerous studies have examined changes across Europe and point to similar trends with increases in temperatures and spatially variable changes in precipitation (Fraga et al., Reference Fraga, Malheiro, Moutinho-Pereira and Santos2012). For Spain, Moreno et al. (Reference Moreno, Aguiló, Alonso, Álvarez Cobelas, Anadón, Ballester, Benito, Catalán, de Castro, Cendrero, Corominas, Díaz, Díaz-Fierros, Duarte, EstebanTalaya, Estrada Peña, Estrela, Fariña, Fernández González, Galante, Gallart, García de Jalón, Gil, Gracia, Iglesias, Lapieza, Loidi, López Palomeque, López-Vélez, López Zafra, de Luis Calabuig, Martín-Vide, Meneu, Mínguez Tudela, Montero, Moreno, Moreno Saiz, Nájera, Peñuelas, Piserra, Ramos, de a Rosa, Ruiz Mantecón, Sánchez-Arcilla, Sánchez de Tembleque, Valladares, Vallejo and Zazo2005), using different emission scenarios, examined temperature and precipitation changes and found that increasing temperature trends of 0.4–0.7 °C per decade are likely with summer warming greater than winter. Overall, the changes result in warming in Spain by 2100 of between 5–7 °C inland and 3–5 °C along the coast. Moreno et al. (Reference Moreno, Aguiló, Alonso, Álvarez Cobelas, Anadón, Ballester, Benito, Catalán, de Castro, Cendrero, Corominas, Díaz, Díaz-Fierros, Duarte, EstebanTalaya, Estrada Peña, Estrela, Fariña, Fernández González, Galante, Gallart, García de Jalón, Gil, Gracia, Iglesias, Lapieza, Loidi, López Palomeque, López-Vélez, López Zafra, de Luis Calabuig, Martín-Vide, Meneu, Mínguez Tudela, Montero, Moreno, Moreno Saiz, Nájera, Peñuelas, Piserra, Ramos, de a Rosa, Ruiz Mantecón, Sánchez-Arcilla, Sánchez de Tembleque, Valladares, Vallejo and Zazo2005) also show much drier springs and summers and lower annual rainfall, which was shown to be less spatially homogeneous across Spain.
Examining grapevine responses to climate change, Lebon (Reference Lebon2002) used model output to show that the start of Syrah ripening (V) in Southern France would shift from the second week of August today to the third week of July with 2 °C of warming and to the first week of July with 4 °C of warming. In addition, spatial modelling of suitable zones for viticulture in Europe show latitudinal, coastal and elevation shifts from historic wine regions (Malheiro et al., Reference Malheiro, Santos, Pinot and Jones2012; Santos et al., Reference Santos, Malheiro, Pinto and Jones2012; Moriondo et al., Reference Moriondo, Jones, Bois, Dibari, Ferrise, Trombi and Bindi2013). In South Africa, regional projections of rising temperature and decreased precipitation have been shown to put additional pressure on both the phenological development of the vines and on the water resources necessary for irrigation and production (Carter, Reference Carter2006). Webb et al. (Reference Webb, Whetton and Barlow2007) analysed climate change scenarios for viticulture in Australia, showing that temperatures by 2070 are projected to rise by 1.0–6.0 °C, increasing the number of hot days and decreasing frost risk. Precipitation changes, however, are more variable but result in greater growing season stress on irrigation. Webb et al. (Reference Webb, Whetton and Barlow2007) indicate that one of main issues in the future is the shift in phenology that is likely to push ripening and harvest into a warmer part of the summer, ultimately affecting fruit and wine quality.
To further understand the potential impacts of climate change on the wine sector, the current research details the observed phenological timing and thermal requirements of Cabernet Sauvignon in two regions of Spain (Penedès and Ribera del Duero). These two regions are climatically different; they represent approximately 2.4% and 2.3% of the vineyard area in Spain and have long traditions in grapevine cultivation. The objective of the current study was to (1) analyse the structure and change in phenology during the growth cycle under the two different climatic conditions, (2) examine whether different grapevine growth stages are affected in a similar manner, and (3) study how projections of warmer conditions might alter phenology in the future. Although Cabernet Sauvignon is not the main variety in either of these regions, it is the most widely planted variety around the world and results from the current research could provide insights into how this variety might perform in other regions in the future. The analysis could also provide information about the response of this variety compared with the main varieties cultivated in each area, whose changes have been already analysed. The work was carried out for present climate conditions and under future Representative Concentration Pathways (RCP), corresponding to 4.5 W/m2 (RCP4.5) and 8.5 W/m2 (RCP8.5) for the years 2030, 2050 and 2070. RCP4.5 assumes that greenhouse gas emissions increase with a peak in 2040 and then decline, while RCP8.5 represents increasing emissions throughout the century. Although different emission scenarios could arise, these two RCPs represent a balance between stabilizing of the anthropogenic components of radiative forcing (Thomson et al., Reference Thomson, Calvin, Smith, Kyle, Patel, Delgado-Arias, Bon-Lamberty, Wise, Clarke and Edmonds2011) or a situation where emissions continue to rise throughout the 21st century.
Materials and methods
Areas of study
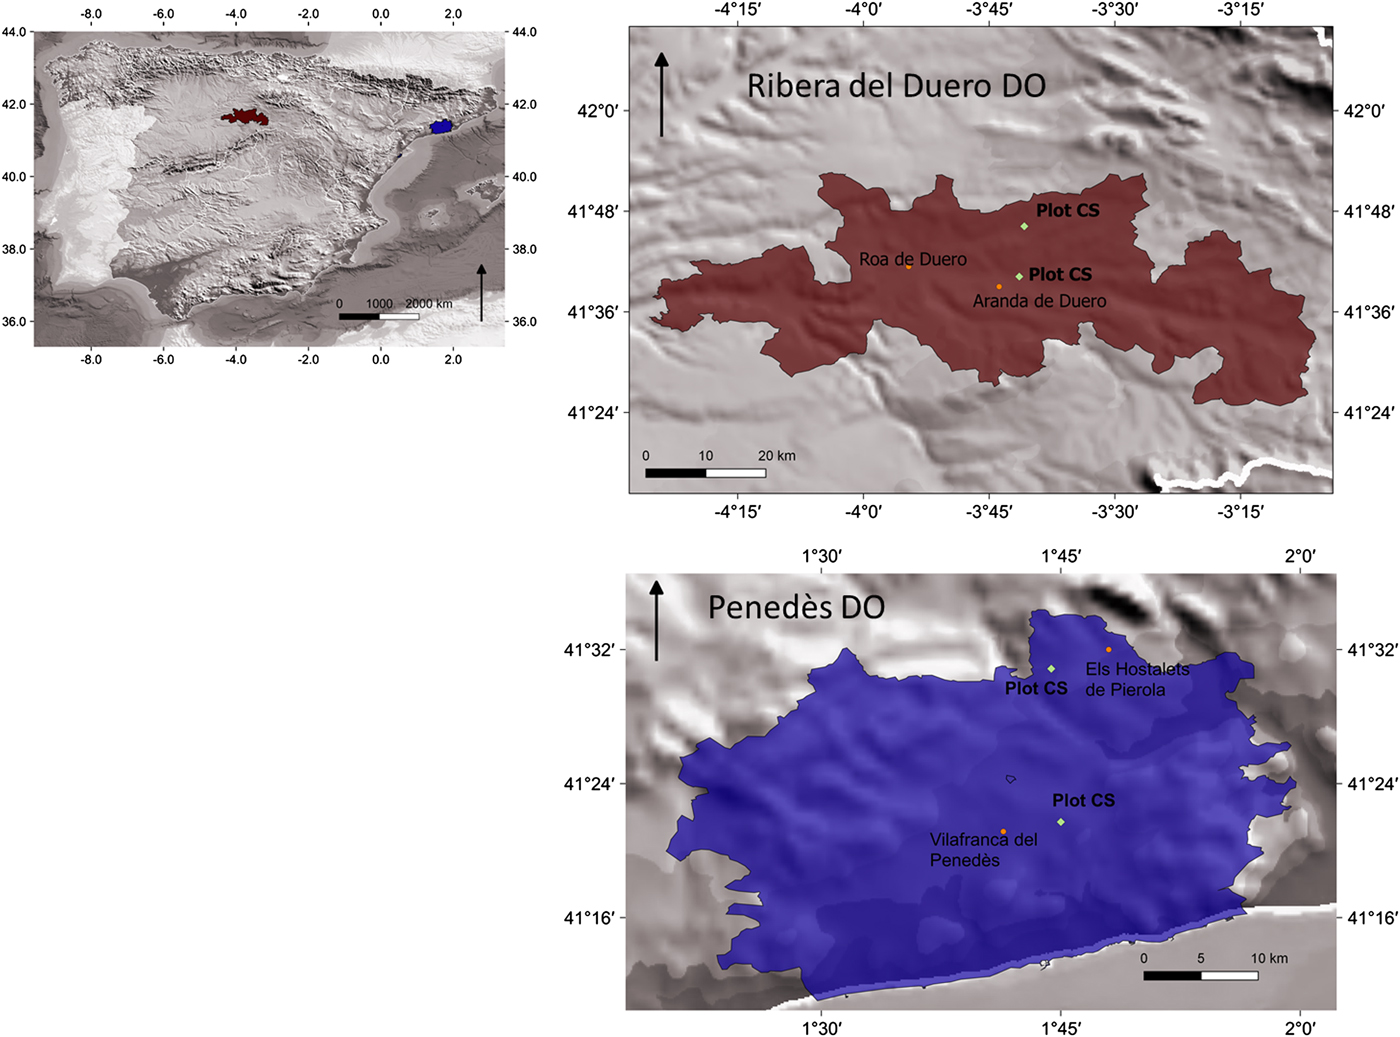
Ribera del Duero DO is located in the north-central region of Spain (Fig. 1), in the large septentrional plateau formed by a large ancient bedrock formation that was levelled and partly covered with Tertiary deposits. The landforms in the riverside basin resulted from erosional processes, including alluvial plains (old terraces of the river that have remained at higher elevations), foothills (areas with rocky materials that have rolled down the hillsides), terraces (recent deposits near the river) and moorlands (high areas that formed part of the original bedrock). The region covers an area running mostly east to west approximately 115 km along the Duero River. Vineyards are cultivated at elevations between 700 and more than 1000 m asl on river terraces and on hillslopes above the terraces. Grapevines have been cultivated in the area since the Roman period (second century BC) and at present under the Designation of Origen ‘Ribera del Duero DO’. Roughly 98% of the vineyard area is planted with red varieties (Tempranillo, Cabernet Sauvignon, Grenache, Malbec and Merlot), with Tempranillo being the main red variety cultivated (95%), and 2% of the vineyard area is planted to white varieties (mainly Albillo).
Location of study areas used in this research. Colour online.

The climate of Ribera del Duero DO is continental with long, cold winters and dry, temperate summers, often with sudden temperature changes throughout the year. Maximum and minimum temperatures during the growing season average 25.2 and 8.6 °C, respectively. The mean annual precipitation ranges between 244 and 550 mm with roughly 0.46 occurring during the growing season of April through September. On two commonly used viticultural bioclimatic indices, Ribera del Duero DO is a Region Ib on the Winkler Index (WI) with an average 1272 GDD and in a Temperate class on the Huglin Index (HI) with an average 2076 GDD (Ramos et al., Reference Ramos, Jones and Yuste2015).
Penedès DO is located in north-eastern Spain (Fig. 1). This region forms part of the Penedès Tertiary Depression. In the area, the main lithological types are calcilutites (marls), with occasional sandstones and conglomerates. Vineyards are planted between sea level and about 800 m, under the designation of Origin ‘Penedès’ and ‘Cava’ DOs. Approximately 82% of the cultivated grapes are white varieties, mainly Macabeo, Xarelo, Parellada and Chardonnay, with the remainder (about 18%) being red varieties (mainly Tempranillo, Merlot and Cabernet Sauvignon).
The climate in the area is predominantly Mediterranean with a maritime influence due to its proximity to the sea. It is characterized by moderately warm, wet winters and hot, dry summers and with higher insolation hours compared with the Ribera del Duero DO. Annual rainfall ranges between 400 and 600 mm with about 45% occurring during the growing season. However, effective rainfall may be lower due to high-intensity rainfall events that commonly occur in autumn, from which a significant amount of water is lost as runoff. The bioclimatic index WI classifies this area as Region III (1860 GDD) and temperate on the HI index (2196 GDD) (Ramos et al., Reference Ramos, Jones and Martínez-Casasnovas2008). Maximum and minimum temperatures during the growing season average 24.5 and 13.9 °C, respectively.
Soil and vine characteristics for each plot in each area
In Ribera del Duero DO, two vineyard plots located close to the main city in the region, Aranda de Duero, at elevations between 800 and 850 m asl, were used in the current study. The two plots were managed by the Consejo Regulador of Ribera del Duero. The age of vines planted in the plots was 20 years and the training system was vertical shoot positioning with a planting pattern of 1.6 m between plants and 3.0 m between rows, with spur pruning in double cordon and 16 buds per plant. The plots were not irrigated and were managed by hand. The soil types in the plots were classified as Typic Xerofluvent and Calcic Haploxeralf (Soil Survey Staff, 2014). Soils in the plots had sandy loam to medium loam texture, with clay content ranging from 157 to 227 g/kg; silt content from 300 to 338 g/kg and sand from 436 and 516 g/kg. The organic carbon content ranged between 12 and 17 g/kg and the soil permeability ranged between moderate and moderately slow. Soil pH values ranged between 7.8 and 8.1. Soil water retention at −33 and −1500 kPa were on average 0.234 and 0.135 gwater/gdry soil and 0.252 and 0.126 gwater/gdry soil, respectively, in both plots.
Two Penedès DO vineyard plots were included in the current study with an average vine age of 25 years. The plots belonged to two different owners and were managed by the same people during the period analysed. Vines of the analysed plots had a planting pattern of 1.3 m between vines and 3.1 m between rows, trained to vertical shoot positioning with spur in double cordon pruning and with 16 buds per plant. Vineyards were not irrigated and were maintained with soil bare most of the time, to avoid water competition. The plots were mostly mechanized, including harvest.
The soils in the plots were classified as Typic Xerorthents and Typic Calcixerept (Soil Survey Staff, 2014). They were relatively low in organic carbon content (between 14.7 and 17.4 g/kg) and had loamy textures with silt content ranging between 420 and 440 g/kg; sand between 300 and 330 g/kg, and clay content between 240 and 250 g/kg. The soils were calcareous with pH values ranging between 8.1 and 8.6. Water retention capacities at −33 and −1500 kPa were 0.176 and 0.108 gwater/gdry soil and 0.213 and 0.132 gwater/gdry soil, respectively, in both plots. These soils also had high susceptibility to structural soil crusts or sealing, giving rise to low infiltration rates.
Data and analysis
Climate data
Daily climatic data (maximum and minimum temperature (T max, T min) and precipitation (P)), recorded at Aranda de Duero (Ribera del Duero) (belonging to Agencia Estatal de Meteorología, AEMET) and Els Hostalets de Pierola (Penedès) (belonging to Servicio Meteorolóógico de Cataluña, METEOCAT), respectively, for the period 1996–2015 were used for the observed climatology, representing all years of the phenology data in both regions. These meteorological stations are the closest to the studied vineyards with available data during the time period, residing 7 and 17 km from the plots in Penedès and 7 and 27 km from the plots in Ribera del Duero. The average Tmax and Tmin and total precipitation during the growing season (period between BB (growth stage C according to the Baggiollini Scale, Baggiollini, Reference Baggiolini1952] and maturity [M, growth stage N)) and during the periods between the phenological events were evaluated for each year. The variation over the time period was analysed and average trends evaluated by simple regression analysis. Trends were evaluated using the Mann–Kendall test (Yue et al., Reference Yue, Pilon and Cavadias2002), and they were considered significant if P < 0.05. Hourly data from 1999 to 2009 in Penedès and from 2004 to 2014 in Ribera del Duero were also analysed in order to estimate the thermal requirements, described below.
Phenology
Observed phenological data from the two plots in each region referred to the main events of BB, BL (growth stage I), V (growth stage M) and M for the period 2004–2015 in Ribera del Duero and 1996 to 2012 in Penedès. The data from Ribera del Duero were supplied by the Consejo Regulador of Ribera del Duero, and for Penedès the data were supplied by two growers in the region. A given stage was defined when approximately 50% of plants had reached the corresponding phenological stage. The final data of maturity, in both areas, was based on the desired alcoholic degree (about 13° Baumé). During the period included in the current study, all surveys were carried out by the same personnel.
Thermal requirement estimations
The accumulated GDD needed to reach each phenological event were calculated for each viticultural region under the present climatic conditions, as the difference between the daily mean temperature and the base temperature critical for effective heat accumulation (T b) recorded from a given starting date (ti) until the data at which the phenological stage was reached (tn) (Eqn (1)).
 $${\rm GDD} = \mathop \sum \limits_{{\rm ti}}^{{\rm tn}} \displaystyle{{(T{\rm max} + T{\rm min})} \over 2}-T{\rm b}$$
 $${\rm and\ if}\ \displaystyle{{(T{\rm max} + T{\rm min})} \over 2} \lt T{\rm b},\; {\rm then}\; {\rm GDD} = 0\; $$
Average GDDs and those related to the phenological dates were utilized in the future climate change scenarios.
To calculate the GDD needed to reach each phenological stage, the chilling and warming periods were estimated for each region. Daily chill accumulation (in Chill Portions) was calculated according to the Dynamic Model specified by Fishman et al. (Reference Fishman, Erez and Couvillon1987) using hourly temperature data. Daily heat accumulation (in growing degree hours) was calculated according to Anderson et al. (Reference Anderson, Richardson and Kesner1986). The chill and heat phases were determined by analysing the relationship between BB dates and the means of 10 days of daily chill and heat units from 15 September (of the year preceding the recorded BB) to 30 April using a Partial Least Squares (PLS) regression. Negative correlation coefficients are interpreted as periods that produced an earlier BB. Once the chill and heat phases were delimited, the thermal requirements to reach each phenological stage, expressed in GDD, were calculated as the difference between the daily mean temperature and the base temperature critical for effective heat accumulation (Eqn (2)).
 $${\rm GDD} = \Sigma {\rm} (T{\rm i}-T{\rm b}){\rm} = {\rm} \Sigma T{\rm i}-n{\rm Tb}$$
where T i is the average daily temperature, T b is the base temperature and n is the number of days to reach a given stage. If T i < T b, then T i = T b and no GDD were accumulated.
The T b values were estimated through an iterative process until reaching the temperature that minimized the standard deviation for GDD. The optimization was done using the Generalized Reduced Gradient (GRG) in the SOLVER tool (Microsoft Office Excel 2010). The obtained values were calibrated by analysing the fit of the predicted to observed, dates using the root mean square error (RMSE) calculated as indicated in Eqn (3).
 $${\rm RMSE} = \sqrt {\displaystyle{{\; \mathop \sum \nolimits_1^n \; {({\rm DOYs}-{\rm DOYo})}^2} \over n}\;} $$
where DOYs and DOYo are the simulated and observed dates at which the corresponding phenological event occurs, respectively.
Climate change scenarios
Changes in temperature and precipitation were simulated in the current work using eight models (MIROC5; ACCESS1.0; CNRM_M5; INMCM4; MPI-ESM_MR; CMCC-CM; BCC-CSM1-1; MSI_CGCM1; BNU-ESM) and for two RCP greenhouse gas concentration trajectories – RCP4.5 and RCP8.5 – and averaged for 2030, 2050 and 2070. Data downloaded at a daily time scale for 2006–2100 by AEMET were compared with a reference period (1970–2000). The data were calibrated with the existing data in both locations throughout 2015.
Based on the results observed at the present time, the average heat accumulation values (GDD) from the date at which chill hours were achieved to each phenological stage was then used to determine the phenological dates under future climate scenarios. The analysis was carried out using each of the individual climatic models used in the current research and then averaged into an ensemble mean for use in the final analysis.
Results
Climatic conditions and phenological dates in both areas
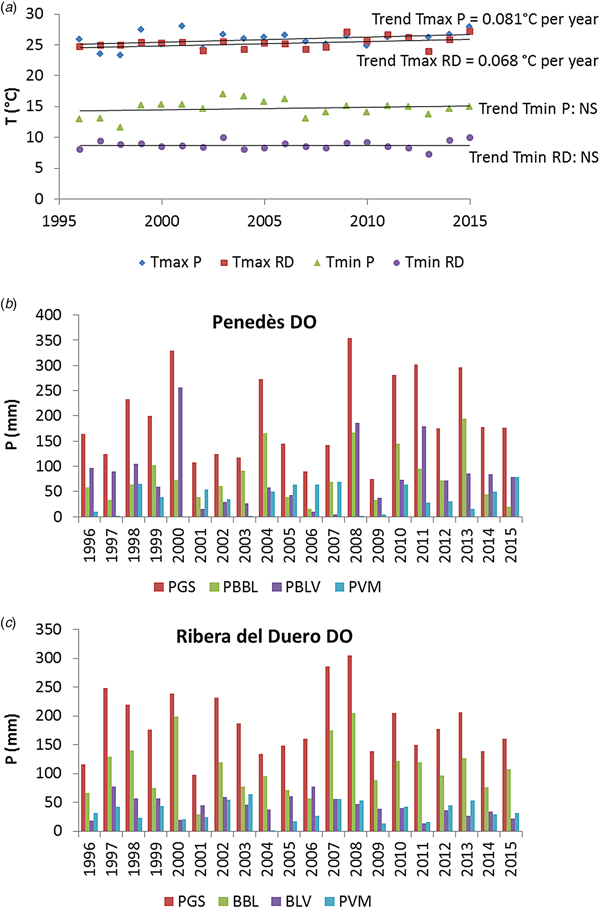
Figure 2 summarizes the average maximum and minimum temperatures and precipitation recorded during the growing season (period between BB and M) for the period of study in both areas. During this period, the average T min was much lower in Ribera del Duero, ranging between 7.2 and 9.9 °C, while in Penedès, it ranged between 11.8 and 17.0 °C. The differences in T max between the two locations were smaller, ranging between 23.9 and 27.0 °C in Ribera del Duero and between 23.3 and 28.0 °C in Penedès. Differences in GDD between the two regions reflected the T max and T min characteristics, ranging between 1098 and 1584 in Ribera del Duero and between 1788 and 2530 in Penedès. Annual rainfall varied between 244.1 and 549.8 mm in Ribera del Duero and between 397.8 and 903.1 mm in Penedès. In addition, Penedès experienced more year-to-year variability in total precipitation. Furthermore, the wetter years were not always the same in the two regions and they were not the years in which higher rainfall was recorded during the growing season. During the growing season, precipitation varied between 74.8 and 454 mm in Penedès and between 160 and 305 mm in Ribera del Duero, and within the growing season, the highest differences between the locations were observed between V and maturity.
(a) Average maximum and minimum temperature during the growing season (T max P and T min P, maximum and minimum temperature in the Penedès region; T max RD and T min RD, maximum and minimum temperature in the Ribera del Duero region); (b) precipitation during the growing season and in periods between phenological events in the Penedès; and (c) precipitation during the growing season and in periods between phenological events in the Ribera del Duero (PGS, precipitation recorded in the growing season (period budbreak to maturity); PBBL, precipitation recorded in the period budbreak to bloom; PBLV, precipitation recorded in period bloom to veraison; PVM, precipitation recorded in the period veraison to maturity). Colour online.

The average dates of each phenological stage in both areas are shown in Table 1. Differences of more than 15 days in BB, approximately 6 days for BL and about 12 days for V, on average, were observed between the two areas, with earlier phenological timing in Penedès compared with Ribera del Duero. As a result of the earlier growth cycling, maturity occurred a week earlier in Penedès. These differences in the main phenological events (BB, BL and V) were driven mainly by differences in temperature, particularly in T min.
Average dates ± standard deviation (in days) of budbreak (BB), bloom (BL), veraison (V) and maturity (M) in each studied area for the period (1996–2012 in the Penedès and 2004–2015 in the Ribera del Duero)

The dates correspond to the stages C, I, M and N in the Baggiolini scale and were taken when approximately half of the vines reached the given stage (d: days).
Phenological thermal requirements: chill and heat phases and base temperatures
Chill and heat units analysed for the periods that included ten growing cycles in both areas showed that chill units are typically accumulated through to 15 and 20 March in Penedès and in Ribera del Duero, respectively. During the period between 25 October and the dates in March, the PLS analysis between BB dates and chill units resulted in negative coefficients in different periods with some discontinuities. The negative coefficients suggest that during the late October through mid to late March period, increases in chilling were correlated with advanced BB. From the March dates, correlation coefficients were positive. Based on these results, heat accumulation was then defined to start on 16 March in Penedès and on 20 March for Ribera del Duero.
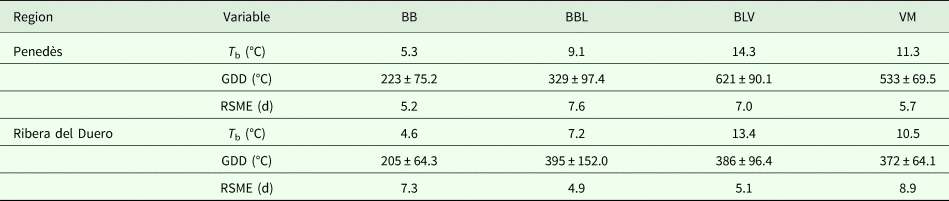
The base temperature values (T b), calculated for each stage in each viticultural area, are 4.6 and 5.3 °C for BB; 7.2 and 9.1 °C for BL; 13.4 and 14.3 °C for V; and 10.5 and 11.3 °C to reach maturity for Penedès and Ribera del Duero, respectively (Table 2). The average GDD values needed to reach each phenological stage using these base temperatures are also shown in Table 2. The GDD values were slightly greater in Penedès than in Ribera del Duero for BB, slightly higher for BBL in Ribera del Duero, and moderately higher for V and M in Penedès.
Base temperature (T b) values for Cabernet Sauvignon adjusted for each phenological stage in each area; average heat units accumulated in the previous period to reach each phenological stage (BB, from 15/20 March to budbreak; BBL, from budbreak to bloom; BLV, from bloom to veraison; VM, from veraison to maturity); GDD growing degree days ± standard deviation needed to reach each period and RMSE (root square mean error) of the fit between observed and estimated dates (in days:d)

Predicted changes in temperature and projected effects on phenology
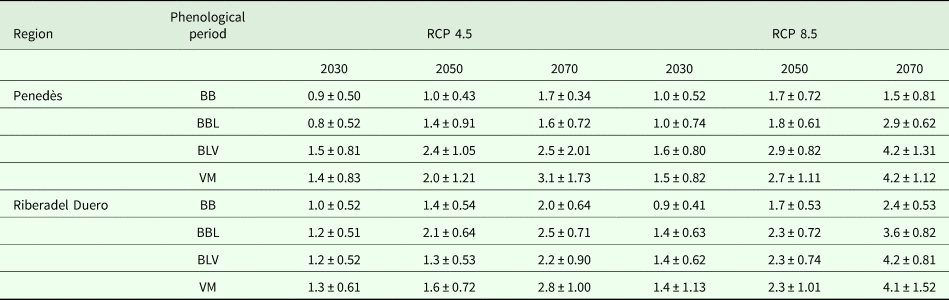
The predicted changes in average temperature for the different periods between phenological events under the different emission trajectories are shown in Table 3. During the growing season, projected temperature increases for 2070 are estimated to be 1.6–2.9 °C during the period between BB and BL; between 2.5 and 4.2 °C for the period BL to V; and 3.1 and 4.2 °C for the period V to M under the RCP4.5 and the RCP8.5 emission trajectories, respectively. In the earliest growth stages, the projected temperature increase is greater in Ribera del Duero than in Penedès, while for the later growth stages the opposite is true.
Predicted changes (mean values ± standard deviation obtained from the models used in the analysis) in the average temperatures for different periods between phenological events for each area under the RCP4.5 and RCP8.5 emission trajectories (BB, from 15 or 20 March to budbreak (depending on the location); BBL, from budbreak to bloom; BLV, from bloom to veraison; VM, from veraison to maturity)

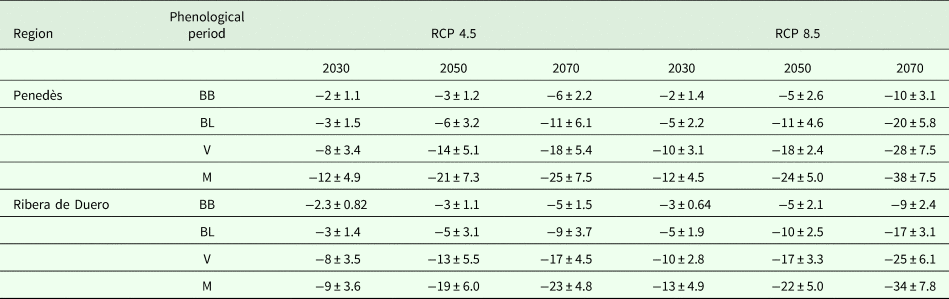
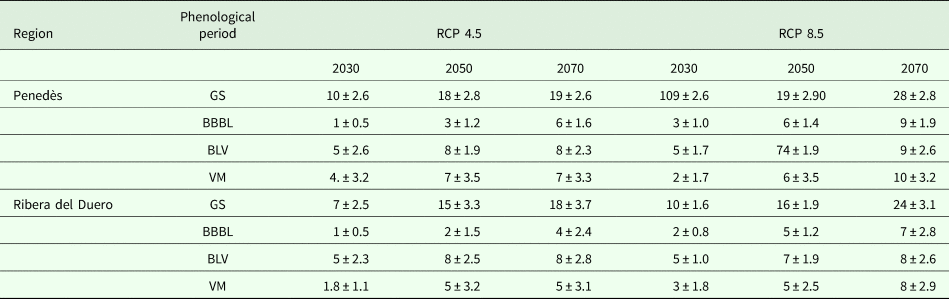
Table 4 shows the predicted changes for each phenological stage by 2030, 2050 and 2070 under the RCP4.5 and RCP8.5 emission trajectories. The results are based on the thermal requirements for each stage observed during the period analysed (1996–2012 for Penedès and 2004–2015 for Ribera del Duero). The projected changes in phenology for BB were similar in both viticultural areas, but for later stages the projected changes were greater in Penedès than in Ribera del Duero. The phenological events of BB, BL, V and M by 2070 in Penedès and Ribera del Duero are projected to be earlier by as much as 5.6 v. 5.1, 11.3 v. 9.4, 18.3 v. 17.3 and 24.9 v. 22.7 days, under RCP4.5 and 10.3 v. 9.4, 19.7 v. 16.9, 28.4 v. 25.4 and 38.1 v. 33.5 days under RCP8.5 in Penedès and Ribera del Duero, respectively. The advance in phenological timing is also likely to result in a shortening of the growing season and each period between phenological phases (Table 5).
Predicted advances (mean values ± standard deviation obtained from the models used) in phenological dates by 2030, 2050 and 2070 under the RCP4.5 and RCP8.5 emission trajectories in both viticultural areas studied (BB, stage C–budbreak; BL, stage I–bloom; V, veraison–stage M; M, maturity–stage N)

Predicted shortening of the phenological periods (mean values ± standard deviation in days) by 2030, 2050 and 2070 under the RCP4.5 and RCP8.5 emission trajectories in both viticultural areas studied (GS, growing season; BBBL, budbreak to bloom; BLV, bloom to veraison; VM, veraison to maturity)

Discussion
During the period analysed, years with different climatic conditions were recorded in both areas. The variability in T max and T min from year to year was greater in Penedès than in Ribera del Duero. While T max was similar between the two locations, the main differences in the climatic conditions between the two areas were related to minimum temperatures. The average differences in T min and T max during the growing season were 6 and 0.7 °C, respectively.
Despite variability from year to year, T max showed significant increasing trends during this period in both regions (0.068 °C per year in Ribera del Duero and 0.081 °C per year in Penedès), which were higher than the average trend corresponding to a longer series in both areas (Ramos et al., Reference Ramos, Jones and Martínez-Casasnovas2008, Reference Ramos, Jones and Yuste2015) and are in agreement with observations in other areas around the world (IPCC, Reference Stocker, Qin, Plattner, Tignor, Allen, Boschung, Nauels, Xia, Bex and Midgley2013). Growing degree days showed an increasing trend in Ribera del Duero, although it was not significant, while in Penedès the high variability observed during the period swamped the trend. The difference in annual precipitation between the areas was roughly 200 mm, although the average value during the growing season was similar. There were also differences in the distribution of the rainfall recorded outside of the growing season. In Penedès, a greater proportion of the annual rainfall occurs just after the harvest, and a significant portion (up to 50%) is lost as runoff (Ramos and Martínez-Casasnovas, Reference Ramos and Martínez-Casasnovas2010), while in Ribera del Duero, the rainfall recorded during the dormant period represents a greater proportion of the annual rainfall than in Penedès. This indicates that Ribera del Duero develops higher reserves of water for the following growth cycle. The distribution was also different within the growing season, with higher values in Penedès. During grapevine growth cycles, the precipitation recorded during the period between BB and BL was, on average, greater in Ribera del Duero than in Penedès, while the opposite was observed during the period between BL and V. These differences in climatic conditions may influence some of the phenological differences in the regions. In addition, soil water availability, determined by water retention capacity and organic matter content, were also higher in Ribera del Duero than in Penedès. In Penedès, Ramos and Martínez-Casasnovas (Reference Ramos and Martínez-Casasnovas2014) found that soil water available may be around 90% of the total capacity until June and then declines rapidly, reaching very low values (<10%) at the end of the cycle.
Increased temperatures are predicted for both regions by 2030, 2050 and 2070 but projected increases are greater in the warmer region, Penedès, particularly during the periods corresponding to BL to V and V to M. The higher projected increase in Ribera de Duero than in Penedès in the earliest stages could be due to differences in the dates at which these phenological phases occur. However, in later stages, the changes are opposite, due mainly to the higher temperature differences recorded in late spring and summer in Penedès than in Ribera del Duero. The projections for warmer conditions in these regions also predict advances for all phenological events in comparison to the present. The projected advances are in agreement with predicted changes in both regions, being higher in Ribera del Duero than in Penedès in the earlier stages and opposite in the later stages. Projected changes in phenology are higher for BL, V and M than for BB, where temperature changes are not projected to be as high. This result agrees with other research from wine regions where the link between phenology and temperature is stronger in specific growth periods. Bock et al. (Reference Bock, Sparks, Estrella and Menzel2011), studying the white varieties Müller-Thurgau, Riesling and Silvaner in Franconia, Germany found that BB is related negatively to the mean maximum temperatures in February and April; full flowering was influenced by the maximum temperature of the preceding months (April to June); and V was dependent on temperature in later time periods (May to July). Jones and Davis (Reference Jones and Davis2000) and Jones et al. (Reference Jones, Duchene, Tomasi, Yuste, Braslavksa, Schultz, Martinez, Boso, Langellier, Perruchot, Guimberteau and Schultz2005b) also found that later phenological events were related more strongly than early season events to temperature.
The predicted changes in phenological dates for the projected changes in temperature are in agreement with results observed in other wine regions. Fraga et al. (Reference Fraga, Santos, Moutinho-Pereira, Carlos, Silvestre, Eiras-Dias, Mota and Malheiro2016) indicated that BB is expected to advance between 1 and 5 days depending on the scenario analysed and that BL (between 2 and 6 days) and V (between 6 and 14 days) were likely to change more than BB. Webb et al. (Reference Webb, Whetton and Barlow2007) found that the Cabernet Sauvignon variety was projected to experience budburst in Coonawarra (Australia) 6–11 days earlier by 2050, and that harvest could be 45 days earlier by 2050 under the warmer scenario. Examining regions in Italy, Moriondo et al. (Reference Moriondo, Bindi, Fagarazzi, Ferrise and Trombi2011) predicted advances in BB of about 20 days for the period 2070–2099, as an average of the emission scenarios A2 and B2, and up to 24 days of advance at higher elevations (between 400 and 600 m asl). However, the same authors indicated similar trends for BL and even greater changes for the maturation stages at higher elevations.
Under the predicted warming shown in the current research, the advance in phenological timing is also likely to result in a shortening of the growing season. In Penedès, the period between BB and BL could be reduced by as much as 5.8 and 9.4 days by 2070 under RCP4.5 and RCP8.5, respectively. The period between BL and V might suffer a shortening of up to 7.9 and 8.7 days in the two emission trajectories, respectively, while the period between V and M might be shortened by up to 6.6 and 9.7 days, respectively. These changes are much higher than those projected for white varieties cultivated in the same area (Ramos, Reference Ramos2017), such as Chardonnay, Macabeo or Parellada, which are better adapted to the climatic conditions recorded in the area. In Ribera del Duero, however, according to the projected advance of each stage, the length of the periods might experience smaller changes. The period between BB and BL may be shortened by up to 4.8 and 7.5 days by 2070, the period from BL to V could be shortened by up to 7.5 and 8.5 days, while the period from V to M might be shortened by 5.4 and 8.1 days under the two emission trajectories (RCP4.5 and RCP8.5), respectively. These changes are similar to those projected for other red varieties cultivated in the same area, such as Tempranillo (Ramos et al., Reference Ramos, Jones and Yuste2018).
In this respect, the results found in the literature do not always point to the same conclusion. Ruml et al. (Reference Ruml, Korać, Vujadinović, Vuković and Ivanišević2016) indicated that the change in timing of phenological events did not significantly affect duration of the growth intervals due to significant inter-correlation between the onsets of each phenological stage. Moriondo and Bindi (Reference Moriondo and Bindi2007) found that higher temperatures did not decrease the length of the BB to anthesis phase, whereas duration of the anthesis to maturation phase was shortened in the future compared with the present period. However, Jones et al. (Reference Jones, Duchene, Tomasi, Yuste, Braslavksa, Schultz, Martinez, Boso, Langellier, Perruchot, Guimberteau and Schultz2005b) found shorter intervals between the main phenological events for 17 varieties across nine countries in Europe that ranged from 4 to 14 days and Tomasi et al. (Reference Tomasi, Jones, Giust, Lovat and Gaiotti2011) found a shortening of the intervals between events between 6 and 15 days. Similarly, Fraga et al. (Reference Fraga, Santos, Moutinho-Pereira, Carlos, Silvestre, Eiras-Dias, Mota and Malheiro2016) also indicated projected reductions of 1–2 days for the period BB to BL and between 4 and 8 days for BL to V. However, it is clear that shortening of the overall growth cycle is driven mainly by the effects of temperature during the later stages of growth in the spring. Changes such as these across the growing season will bring ripening into the summer under higher temperatures than at present (Webb et al., Reference Webb, Whetton and Barlow2007). With maturity likely to occur both earlier in the year and in warmer conditions, there is a high likelihood of a decoupling between sugar synthesis and polyphenol development, ultimately affecting grape quality attributes in a negative manner (Mori et al., Reference Mori, Goto-Yamamoto, Kitayama and Hashizume2007; Sadras and Moran, Reference Sadras and Moran2012; Deis et al., Reference Deis, de Rosas, Malovini, Cavagnaro and Cavagnaro2015). However, new vineyard management practices and the use of irrigation (where available) may help mitigate the impacts of higher temperatures and reduce the potential changes in phenology (Palliotti et al., Reference Palliotti, Panara, Silvestroni, Lanari, Sabbatini, Howell, Gatti and Poni2014; Zheng et al., Reference Zheng, del Galdo, García, Balda and Martínez de Toda2017).
The changes in grape composition among years with different characteristics (the ‘vintage’ effect) have been detailed further in one of the areas examined in the current study. In Ribera del Duero, significant differences in grape composition were found between years with significant differences in temperature in the same study area. For example, in vintages where average growing season temperatures were close to 20 °C (2006, 2009 and 2011), low tartaric (<4.5 g/l) and malic acidity (~3 g/l) were observed. In vintages where the average growing season temperature was cooler, 18 °C or less (2004, 2007 and 2008), tartaric acidity ranged between 6 and 7 g/l and malic acidity reached values ranging between 4.4 and 6 g/l. Differences in the region were also found in the total and extractable anthocyanins, where in 2006, for example, total and extractable anthocyanins were 413 and 257 mg/l, while in 2008 they were 727 and 263 mg/l, respectively (data obtained from Ribera del Duero D.O.). Thus, these results may give an indication of the expected changes to wine chemistry under future changes in climate.
Conclusions
Grapevines yield high-quality fruit at economically sustainable production levels when grown in suitable climates, ultimately providing for quality wine production. The current research has provided an examination of the phenological timing of one cultivar and its relationship to the prevailing climate in the Penedès and the Ribera del Duero wine regions in Spain. Wine production in these regions is a significant sector of the economy and as such the regions are concerned with how changes in climate might influence the productivity and sustainability of the industry. To address these impacts, the current research also examined how changes in climate are projected to evolve in these regions and how these conditions are likely to affect growing characteristics and cultivar suitability for the variety Cabernet Sauvignon.
The projected changes in grapevine phenology for Cabernet Sauvignon under two climate change emission trajectories (RCP4.5 and RCP8.5) suggest an earlier onset of all phenological events in the Penedès and Ribera del Duero wine regions in Spain. The projections indicate greater changes in later growth events (higher advances of BL and V), which will ultimately shorten the growth intervals and shift ripening and harvest into a warmer part of the summer. This is likely to mean a decoupling between the timing of optimum sugar accumulation, acid respiration, phenolic maturation and fruit character. The projections for earlier grapevine growth are higher in the Penedès than in the Ribera del Duero, which is in agreement with greater temperature increases in Penedès. The differences in phenological timing for Cabernet Sauvignon that is observed today between these two areas (up to 15 days in BB and V and up to 6 days in BL and maturity) may increase significantly under future climate change scenarios. The results from the current research suggest that the effects may be more negative for this variety in Penedès than in Ribera de Duero, probably meaning significant changes to cultivar suitability in the region. Due to the fact that Cabernet Sauvignon is the most widely cultivated variety in the world, the results from the current research may be very useful for policy makers in many regions. The current work and the growing body of evidence from other studies point to wine regions such as Penedès and Ribera del Duero likely requiring a portfolio of adaptation measures in the vineyard and/or the adoption of new varieties more suited to the new climatic conditions in the future and new management practices.
Acknowledgements
Authors thank the Consejo Regulador Ribera del Duero DO and vine growers of Penedès for the information about their vines and the AEMET and METEOCAT for the meteorological information used in this research.
Financial support
This research received no specific grant from any funding agency, commercial or not-for-profit sectors.
Conflict of interest
None.
Ethical standards
Not applicable.